Wednesday, May 29, 2013

OGPSS - Future oil production from Iraq - an optimistic view

There is often quite a debate in the Peak Oil community over the difference between a reserve and a resource. Simplistically a resource is the amount of, for the sake of discussion, oil that is in the ground in a certain country, while the reserve is the amount of oil that can be both technically and economically recovered from that resource. The numbers can differ quite markedly, and the judgment as to whether a certain body is a reserve is finally made when a well is drilled down, and production (or not) begins.

Just having the reserve available is not, however, within the global discussion of Peak Oil, an adequate sufficiency. Because oil well flow declines over time it is important that the rate of oil production from that reservoir, and the timeliness of its arrival within the supply chain be considered. This is particularly true in discussions over the help that the reserve will provide in ensuring that there is an adequate supply available when the global demand needs it. Normally, as noted, the decisions on production are made on geologic and economic grounds, but it would be foolish not to recognize that there are other factors. Consider the case of Iraq. It is common to find the assumption that Iraqi oil production will rise considerably, with some suggesting it will reach the levels currently only achieved by Russia and Saudi Arabia, although there are some who project it might even rise to as much as 13 mbd, given that there are contracts in place, which if all were fulfilled on time, would raise Iraqi production four-fold to 12 mbd by 2017.

In their Special Report on Iraq last year the IEA noted that the country is already the world’s third-largest oil exporter, with the potential and intent to increase production much further. And, as the EIA notes, Iraq became the second largest oil producer in OPEC, when it passed Iran at the end of last year.


Figure 1. Iraqi production of oil since 1990. (EIA)

Iraq is currently producing around 3.1 mbd of crude and thus the potential production levels, and their contribution to reserves and to the daily global need for supply, still has a way to go. With so much oil potentially available, and yet with considerable question over the rate at which it will arrive, it is worth examining the conclusions that the IEA came to, before the current increase in violence occurred. This new spate of attacks come after an interval when violence was decreasing in the country, and may prove a further impediment to significant growth in production.


Figure 2. Level of violence in Iraq showing the number of attacks each week since 2007. (IEA )

The IEA built three different scenarios in their report, for which their was extensive consultation in country. The main or Central Scenario that they project anticipates that GDP in the country will continue to rise, though tapering off as stability are achieved in the out years.


Figure 3. Anticipated growth rates for Iraqi GDP under the different models the IEA used. (IEA )

The Iraqi GDP grew 10.2% last year, and has been growing at an increasing rate over the past few years.


Figure 4. Actual annual growth rate in Iraq GDP (Trading Economics )

The oil fields in the country are largely concentrated in two separate regions, down around Basra in the south of the country, and in the region around Kirkuk and Mosul in the North.


Figure 5. Oil and gas fields in Iraq (IEA ).

This division is somewhat unfortunate from a politically stable point of view since the region in the south is predominantly Shiite, while the reserves in the north lie in the Kurdish region of the country. There is significantly less within the Sunni communities which are largely found in the central region of the country.

In recent times Euan Mearns has written of the potential for oil production in the Kurdish region in the north. In total this is estimated to hold around 4 billion barrels of oil, or around 17% of the national reserve. However, as exploration of the potential fields in Kurdistan continues, this estimate has been increased by the local government to a possible 45 billion barrels. Euan, for example, wrote about the development of the Shaikan oil field and the potential size of between 8 and 13.4 billion barrels that it showed in January 2012. Current plans are for production to reach 40,000 bpd “soon”, with production ramping up to 400,000 bpd. The Kurdistan Regional Government (KRG) see it playing a considerable role in achieving their target of 400 kbd this year, 1 mbd by 2015, and 2 mbd by 2019. The field is being developed by Gulf Keystone Petroleum.

In the south current production is centered around the Rumaila oil fields. BP has committed $2.85 billion toward improvements in Rumaila this year, with the intent of raising production from the current 1.4 mbd, through 1.45 mbd at the end of this year, up to 6 mbd by 2017. 300 new wells will be drilled in the field over the next five years, to meet the goal, with 150 of these being drilled in the second half of this year. BP operates the field in partnership with CNPC.


Figure 6. Detail showing the location of the Rumaila fields in south Iraq. (Energy-pedia)

The overall scale of Chinese involvement is of concern to some, since as oil supplies tighten in the years to come, it is expected that up to 80% of future Iraqi production will head towards Asia, and particularly to China.

With the growing development of the Majnoon field, with an estimated reserve of 38 billion barrels, it might thus appear that the country is well on its way to meeting the projections that the contracts might suggest. However there are many constraints on future production, including infrastructure and water availability, and I will discuss these and why they limit the IEA to an optimistic assessment that the country will produce 6 mbd by 2020, and only reach 8.3 mbd by 2035 in the next post.

Tuesday, May 28, 2013

Waterjetting 9d - Deepening a hole and cautions with glass

The last three posts have described what happens when a jet of water first arrives on a surface, and then starts to penetrate into the material. At a close stand-off distance the erosion starts around the edge of the jet, and continues to widen the hole as it gets deeper, until a point where the pressure at the bottom of the hole falls, and the jet stops going deeper. The lateral flow away from the bottom of the jet continues to erode material, however, and so the hole gets a little wider at the bottom. This creates a small chamber under the entrance hole and this can build up enough pressure that it can cause the material around the hole to break.


Figure 1. Progress in the high-pressure waterjet drilling of a hole in rock.

In the last post I showed where this happened with a 1-ft cube of rock that had been broken with a single pulse, but this fracture of the target can occur when piercing glass or other brittle materials. So the question becomes how to stop the fracture if one is trying to cut glass. This applies when the job calls for making an internal cut in the glass, and not when cutting in from the side, although that also has some problems that I will address in a later post.

When starting an internal cut, obviously, if it is possible, it means piercing a starter hole through the glass in a region that is going to be part of the scrap, if this is possible, as it would be, for example when cutting a sculpture. A secondary reason for that location, apart from confining any small cracks that might happen during the pierce, is that these starter holes are larger in diameter (for the reason given above) than the cut line once the jet starts to move, and that hole section would appear as a flaw on a final cut line.

Vanessa Cutler, in New Technologies in Glass discusses the process of cutting in more detail, but suggests that the starter hole be pierced at a lower pressure than that to be used in the cut. This is so that the pressure within the cavity will remain lower during the pierce, and insufficient to cause the glass to break. She suggests (and she has a vastly greater experience than I in this) that the piercing pressure be around 11,000 to 18,000 psi – this varies a bit with abrasive grit size, machine size and glass type.


Figure 2. Detail of the glass sculpture "p1", by Vanessa Cutler. (Note that these holes do not pierce all the way through the glass but all end at the same depth.)

She also recommends, when there are multiple cuts to be made on a sheet, that all the piercing holes be completed before any cutting begins. One of the reasons for this is to avoid constantly resetting the cutting pressure, which could be a problem, if you forget to lower the pressure back down before starting the next pierce. (Would I as an Emeritus Professor ever be that absent-minded? Why else bring it up?)

You will notice, with abrasive cutting into glass, that there is not the belling at the bottom of the cut that there is with plain waterjet cutting, and that the hole tapers with depth, as the cutting effectiveness reduces with the fall in pressure with depth, and the jet is less able to cut into the side walls of the opening at these lower pressures.

Stepping back from the cutting of glass to the more general condition where the jet runs out of power at the bottom of the hole, the main reason for this is the conflict between the water in the fresh jet coming into the hole, and the spent water trying to make it out of the hole at the same time.

One way of overcoming the problem is to interrupt the flow of water into the hole. Back in my grad student days we tried doing this by breaking the jet into slugs, so that one slug would have enough time to travel to the bottom of the hole, cut a little, and then rebound out of the hole, before the next slug of water arrived. There was relatively little sophistication in the tool we designed to do this. Simply it was a disk, with holes drilled in it at an angle.


Figure 3. Interrupter disk placed in the path of a continuous jet. (My PhD Dissertation)

The reason for the angled holes was to make the disk self-propelling as it rotated under the jet, since the angled edges of the hole forced the disk to continue rotating once started. (On a minor note the disk would rotate at several thousand rpm, and the noise that it made was loud enough that I was instructed to only carry out the tests after the staff had left for the evening).


Figure 4. The penetration of a waterjet into sandstone with the jet running continuously (black), with the jet interrupted (red) and with the jet rotated slightly off-axis (green). (Brook, N. and Summers, D.A., "The Penetration of Rock by High Speed Waterjets", Intl. Journal Rock Mechanics and Mining Science, May, 1969)

As can be seen in figure 4, with the pulsating jet more energy was getting to the bottom of the hole, without interference, and the hole continued to deepen over time. However the interruption tool had a number of disadvantages, apart from the noise and that the disk would be very rapidly destroyed under an abrasive jet. It was wasting a significant portion of the energy, in a more optimized design, that I won’t discuss further, the energy loss was about 50%.

But if the jet was moved slightly over the surface, and in these early tests the easy way to do this was to have the target rotate with the jet hitting the rock just offset from the axis of rotation. (At the time high-pressure swivels weren’t yet available). This gave the upper curve in figure 4, and a much more rapid penetration of the target.

In more modern times the nozzle is moved, either by causing it to move slightly around the hole axis, or by causing a slight oscillation or “dither” in the nozzle while the pierce is taking place. This is generally a feature of the control software that drives the cutting table. But the reason for the movement is to get the water flowing in such a way that the water going out of the hole does not interfere with that going in, and so there is a reduced risk of pressure build-up in the hole, with the consequent cracking that this would cause.

Thursday, May 23, 2013

OGPSS - Cutting back on supply in the presence of optimism

We have reached, I would suppose, a period of complacency in the perception of the coming of Peak Oil. We are in a period where, as recent posts have shown, the promises of bountiful supply are built on increasingly tenuous propositions. Unfortunately the evolving story of the mess that we are heading into is at a point where the critical aspects of the problem rate minor paragraphs in articles that largely talk about something else. And the potential of the fossil fuels that lie within shale have commentators drooling over the benefits that will come from this abundant resource. Unfortunately within this euphoria there are sufficient concerns that need airing, since, overall, the situation has not changed that much since the Hirsch Report was published, just over eight years ago.

One of the points that was made in that report was that it would take some twenty years for new technologies to mitigate the foreseen shortages of liquid fossil fuels, made when gasoline prices averaged some $2 a gallon. Driven by concerns over climate change, there has been a significant effort to find alternate fuel options that can provide a renewable option. And the hopes for these producers lead to predictions of a different future.

The British Department of Energy and Climate Change (DECC) has just released a report on the future of coal-fired power plants in Germany, Spain and the Netherlands. It notes that, although Germany will open more coal-fired power plants this year than at any time within the past twenty years, the future for coal is not that promising. In rough numbers Germany has a peak demand of 85 GW of electricity with coal and lignite capacity of around 47.6 GW in 2011. From then until 2015 an additional 10.7 GW of coal-fired plant will come on line. The DECC report notes that while an additional 2.7 GW of plant are in development they have not advanced and, it is suggested, they will likely be cancelled. Some 22 coal-fired projects have been cancelled, and four postponed in recent years. New plant does not spring, like corn, fresh out of the ground within months of planting. Rather there are years of effort, and millions of investment, before power starts to flow. The report brings these views to the following:
We conclude that further new projects to build coal-fired generation in Germany, the Netherlands, and Spain are all very unlikely.

The three major oil companies each had different technologies on which they hung their hats to ease any fears of the future – including the widespread development of either methane hydrates of the oil shales of Colorado. (Neither of which can be realistically expected to come to pass in the next twenty years). The British National Grid in their view of the future seems to put is faith more in the widespread use of high-efficiency heat pumps.


Figure 1. Projected growth of heat pumps in the UK, under three future scenarios (National Grid)

The also anticipate considerable growth in future sales of electric vehicles, though admitting that their earlier projections for these numbers were overly optimistic.


Figure 2. Projected growth in electric vehicle usage in the UK (National Grid)

As a result they anticipate significant reduction in the needs for fossil fuels, although the least optimistic of the scenarios (the Slow Progress one) means that:
In the Slow Progression scenario developments in renewable and low carbon energy are comparatively slow, and the renewable energy target for 2020 is not met until some time between 2020 and 2025. The carbon reduction target for 2020 is achieved but not the indicative target for 2030.
The concern with these optimistic projections, is that it also impacts the investment strategies of those who will need to supply those fuels in the future. Just as it takes time and money to build a power station, so it also takes time to permit and build a coal mine, or an oil or gas well, and the infrastructure to support it.

The current situation in the United States has proponents of the natural gas boom urging the development of export terminals to ship LNG to a global market at a very competitive price. By last December there were plans for a dozen such terminals in the works.


Figure 3. Proposed new LNG Export terminals in the United States (Oil and Gas Journal)

This additional supply, and the likely impact of cheaper natural gas into the European market, has already caused Gazprom to rethink its strategy for natural gas development over the next few years.

The major Russian current development is taking place in the Yamal Peninsula, where the Bovanenkovo field, which came on stream last October had been projected to yield 4 Tcf by 2017, increasing 5 Tcf in the out years. Other adjacent fields, Kharasaveyskoye, Kruzensternskoye, Tambey and Nonoportskoye, were scheduled to follow in order to meet anticipated demand.

But those plans are now being scaled back. Russia has already lost some of their Chinese natural gas market to Turkmenistan, and now it can see that the US might take some of the European market. It cost $41 billion to develop Bovanenkovo, which made it “one of the most expensive industrial projects in the world.” Gazprom is cutting production by to around 83% of capacity this year, and expects it may have to go lower. The natural follow-on to this will be a slowing of investment and development in Yamal, which also produces oil.

At present Russia is closing in on a record post-Soviet oil production () reaching a level of 10.49 mbd (the Soviet peak was 11.48 mbd in 1987). Rembrandt recently noted that it is going to take a significant and ongoing investment in order to have any hope of sustaining those numbers.

My concern is that, in the current Western euphoria, those who must invest to build the alternative infrastructure that will provide sufficient fuel, if all the current plans and projections for alternative supplies and conservation fail, will not b motivated to make those investments in a timely manner. If they do not, or have not, then we will still need the 20-years that Robert Hirsch and his committee projected, when we run out of that time. (That clock is ticking). Unfortunately those who, like Cassandra, sing this song are less likely to be heard in this interval.

Wednesday, May 22, 2013

Waterjetting 9c - Starting to make hole

This small sequence of posts describes the initial milliseconds during which a high-pressure waterjet penetrates into a target material. Because this work was largely developed using rock targets, most of the illustrations will be with that material, but the concept apples, to a degree, also with abrasive laden jets penetrating into materials such as glass.

For this post I am going to discuss just what happens with the jet being fired down onto the target surface, without either the nozzle or the target moving. Much of this work was carried out in the 1960’s in the UK, though I will begin with some tests that Dr. Bill Cooley carried out using his modification to a Russian hydraulic cannon that he redesigned so that it was capable of firing at 500,000 psi – and yes I have seen it fired at that pressure (I took the photo).


Figure 1. The Cooley Cannon ready to fire at 500,000 psi in an underground mine.

In order to see how effective different processes were in cutting into different materials the international scientific community that was developing waterjet technology at the time needed a method to compare the different approaches. The metric that was used was to define the Specific Energy as the amount of energy that it took to remove a unit volume of the target material. (And in time that will be subject of some more specific posts).

Bill’s cannon used stored gas that was suddenly released as a way of driving the water at the desired pressure, and measured the pressure indirectly by timing the break of two pencil leads in front of the nozzle. This gave the jet velocity, and pressure could be back-calculated from that value.

Dr. Cooley took results from his work and from other scientists working with similar devices, to produce the following graph.


Figure 2. Specific energy as a function of the impacting jet length, measured in nozzle diameters. (Cooley, W.C., "Correlation of Data on Erosion and Breakage of Rock by High Pressure Water Jets," Chapter 33, Dynamic Rock Mechanics, ed., G.B. Clark, 12th Symposium on Rock Mechanics, University of Missouri-Rolla, November, 1970, pp. 653 - 665.)

For those running a conventional cutting table the water orifice is around 10 thousandths of an inch in diameter. So what this graph is saying is that once the first thousand diameters of length (1000 x 0.001= 10 inches) has hit the surface, then the process starts to become significantly less efficient. If the jet is moving at 2,000 ft/sec that length arrives in around 0.0005 seconds. Why this rising inefficiency after that time, and how do we get around it?

Earlier in this series I mentioned that one of the tests to find the pressure at which a waterjet penetrates a target is to note the point at which, instead of the water hitting the surface, and flowing along it, it changed direction to flow back towards the nozzle. This is because, as the jet penetrates it makes a hole, and the only way out of that hole is back along the way the jet came. Unfortunately there is more water still coming down into the hole, and so the water leaving the hole (at the same volume flow rate) meets the water coming into the hole. The rapidly moving water going out is moving about as fast as that coming in, and so, as the hole gets deeper, so the pressure at the bottom of the hole gets less. This has been measured by a number of folk, but Dr. Stan Leach was the first, and produced this plot:


Figure 3. Depth at the bottom of a hole, as a function of the incoming jet pressure. (Leach, S.J., and Walker, G.L., "The Application of High Speed Liquid Jets to Cutting," Philosophical Transactions, Royal Society (London), Vol. 260 A, 1966,pp. 295 - 308.)

Because the holes were preformed of metal (to hold the transducer) and were sized to the nozzle diameter, this is not, as it turns out totally accurate, although it illustrates the problem.

It isn’t totally accurate because, as the illustration from the last two posts showed, the erosion occurs initially around the edge of the jet, rather than under it, and thus the hole created is about twice to three times the jet diameter, rather than being of the same size.


Figure 4. Damage pattern around the impact point of a 10,000 psi pressure, 0.04 inch diameter jet on aluminum, target close to the nozzle.

Nevertheless as the hole deepens the pressure at the bottom of the hole gets less, and after a while the jet penetration slows to almost a halt.


Figure 5. Penetration as a function of time (My Dissertation)

The sides of the hole, however, continue to erode, but from the bottom upwards so that, after a short while, the narrower entry hole starts to constrict the flow out, and pressure begins to build-up in the hole.

Remember that a waterjet works by growing existing cracks in the material. So that if there is a natural crack in the rock, which may be as small as a grain boundary, or the scratch made by an abrasive particle as it moves back out of a hole in glass, then the water entering that small crevice will pressurize the walls and cause the crack to grow. Often there is more than one, and the result can be, in rock:


Figure 6. Rock breakage around the jet impact point on a 1-ft block of sandstone (after Moodie and Artingstall Moodie, K., Artingstall, G., "Some Experiments in the Application of High Pressure Water Jets for Mineral Excavation," paper E3, 1st International Symp on Jet Cutting Technology, Coventry U.K., April, 1972, pp. E3 25 - E3 44.)

In rock that might not be such a bad thing, since in many cases the intent is just to break the rock out of the way, so that a tunnel can be created that folk can walk or drive through. But in the case of glass and other such brittle materials, where the object is just to make a very fine cut, with no side cracks, cracking the sheet is disastrous. This can be illustrated by the results when a jet was fired along the central axis of a 2-inch diameter core of granite. The escape of water into the cracks allowed the cycle to repeat several times, and the hole was, as a result, much deeper than it would have been if the cracking had not occurred.


Figure 7. 2-inch diameter granite core that split when a short jet pulse was fired into the core, along the axis.

And so, next time, I’ll write about some of the ways in which we can get around this problem.

Tuesday, May 21, 2013

Poser Pro 2014 comes out, and I get distracted

It turns out that Poser Pro 2014 was released early this morning.


I did not load everything quite the way that I should, and one or two files got misplaced (try the entire Content Library) so that I had to find where it had gone and set it to rights.

Be that as it may,it turns out that I finally got most things in place, and apart from a wee problem that I still have with lighting, and some poor choice of textures, it seems to be working well. If I can get the Lux Render to work right (it was and I seem to have erred there again) I will add that below the fold.

But this is why today's post will appear tomorrow. The picture is all composed from the work of others - not that much time for creativity. It is Raining Bird of the Cree (courtesy of the Cahokia Men series) wearing Shaman warpaint, leaping Merlin's Country Wall, with my own Iroquois village background. Enjoy!


Hopefully this will be rendered by dawn.

Thursday, May 16, 2013

OGPSS - The weather, corn, ethanol and oil production

News of the future was, in my youth, something that one found by crossing the palm of a lady in a dark tent with a piece or two of silver (or the modern equivalent) at one of the fairs that came to town. Such opportunities still exist, with all the caveats that existed back then likely still being in force. However projecting the future, whether of the weather, the likely corn crop this year in the United States, or the production of crude oil by the nations of the world has become a much bigger business with copious tables, graphs and theories replacing the rather worn pack of cards or crystal ball of my youthful experience.

Our part of the world underwent a drought last year severe enough to kill several trees in our yard, for example, as well as hurting the corn crop. This year, corn plantings have been severely impacted by the heavy rains and cold weather, so that decisions on crop plantings have become more complicated and delayed, with follow-on impacts on the ultimate yield in a number of Mid-Western states. Corn yield apparently falls at an average rate of 2.3 bushels per acre per day of delay in Northern Wisconsin. These changing conditions make it difficult to assess how much ethanol, for example, will be available to meet demand, although the latest EIA TWIP holds out some optimism for this year.

The impact of the drought on corn prices, and the consequent fall in ethanol production, as production costs rose, are directly visible from their plot of the two over the last year.


Figure 1. A comparison of corn prices and ethanol production in the USA (EIA TWIP )

However, with the weather impacts still being assessed it is already being concluded that the US corn crop is unlikely to reach the record level of close to 14.6 billion bushels that were earlier projected. It still, however, has the potential to reach around 12.3 billion bushels, which would satisfy the just under 5 billion bushel need for ethanol, as well as other demands of the market. By May 12th only 28% of this year's expected crop had been planted, in contrast with a normal year where 65% would be in the ground. Thus even the relatively short-term projections of the EIA could yet be in trouble for this year.

Moving to the slightly longer-term the nations that form OPEC must try and estimate global demand for their products, and the amount that other non-OPEC nations will produce, so that they can balance supply and demand at such a level that will sustain prices at a level they are comfortable with. Their estimates come out as Monthly Oil Market Reports and in the latest (May) version they continue to expect global demand to increase by 0.8 mbd over 2013, but are beginning to hedge that bet, as the global economy continues to appear anemic, with Russian and Asian economies slowing. Yet by the fourth quarter of the year they anticipate that global demand will reach 90.9 mbd.


Figure 2. Global oil demand by region (OPEC MOMR)

OPEC anticipates that, with the major increase coming from the Americas, that non-OPEC oil production will increase by just under 1 mbd to reach an a level of 54.41 mbd in the fourth quarter of the year. The majority of that growth (some 0.59 mbd) will come from the United States, with the Permian, Bakken and Eagle Ford being cited as the anticipated source of these gains. OPEC, having looked at current rig counts, project that these numbers may be revised upwards over the course of the year. And yet it is worth noting this:
On a quarterly basis, US oil supply is seen to average 10.62 mb/d, 10.67 mb/d, 10.62 mb/d and 10.61 mb/d respectively.
The sustained gain in North American production comes about because:
On a quarterly basis, Canada’s production is anticipated to average 4.02mb/d, 3.97 mb/d, 4.02 mb/d and 4.12 mb/d respectively.
Russia is expected to continue to lead in oil production over the course of the year, although it is not longer expected to increase production above current levels.
On a quarterly basis, Russian oil supply is seen to average 10.45 mb/d, 10.43 mb/d, 10.43 mb/d and 10.43 mb/d respectively.
And this brings us back around to OPEC as they try and balance their production against the gap between global demand and non-OPEC supply. As has been the case for a while, OPEC produced two separate tables showing production, as reported by secondary sources, as well as those directly reported by the countries themselves.


Figure 3. OPEC member production as reported by secondary sources (OPEC MOMR)


Figure 4. OPEC member production as reported directly (OPEC MOMR)

It would appear, with Manifa coming on line, that Saudi Arabia is increasing production again, while Venezuela and Iran would have you believe they are producing more than they are, and Iraq, which is now producing above 3 mbd, is directly reporting less (though that could be because some of that production is coming from the north, and there are some communication problems between there and Baghdad).

As long as OPEC has available reserves it can continue this balance to keep enough oil available at an acceptable price to allow the world economy to continue at its present pace. And with that ongoing adjustment available, their projections for this year of a relatively stable price would seem fairly founded, absent some major change in one of the larger producing states.

Iraq overtook Iran as the second largest producer in OPEC last year (according to secondary sources) and expects that with production from Majnoon, it will increase production capability by upwards of 200 kbd by the end of the year. Ultimately the goal is to achieve a target production of 1.8 mbd. However, as overall production levels increase, Iraq may join with the Kingdom in controlling production to maintain price.

Yet even with those abilities OPEC is becoming cautious over predicting that their estimate of the demand:supply balance numbers for this year will be accurate over that time interval.

With these uncertainties in even short-term projections of future production whether it be corn, ethanol or crude it is perhaps wise to continue a somewhat cynical view of projections over a longer time period. Although the bounding bar of a decline in existing field production continues to exist and will continue to require an offset in increased production from new wells to offset. Perhaps that lady in the tent of my youth may prove as prescient as some of the more optimistic forecasts that we continue to see.

Wednesday, May 15, 2013

Waterjetting 9b - the effect of standoff distance.

One of the problems with relying on photographs is that they are sometimes not of the quality that one would wish. This has happened with today’s topic, where the pictures are old, smaller and in poorer condition than I had remembered. However, with your indulgence, I am going to step through them. I do apologize for their poor quality, however.

The topic is the way in which a waterjet first attacks a target. I have mentioned different parts of this process in the past. But in this post I want to show that it matters where the target is, relative to the nozzle, because the structure of the jet itself changes with that distance, which I call the standoff distance between the jet orifice and the initial target surface.


Figure 1. The break-up pattern of a waterjet (Yanaida K. “Flow Characteristics of Waterjets,” 2nd BHRA Conf. 1974, paper A2.)

As I mentioned last time when the target is close to the nozzle, then the erosion pattern can, in the first few seconds of contact, be seen to be like a butterfly in pattern. The central part of the target, under the jet, is not eroded, but there is severe erosion around the edges of the jet diameter, where a grain will see high differential pressures across its width, and will be subject to high lateral jet flows.


Figure 2. Damage pattern around the impact point of a 10,000 psi pressure, 0.04 inch diameter jet on aluminum, target close to the nozzle.

As the nozzle is moved away from the target surface, however, that pattern of erosion changes. As the jet structure picture shows, the central zone at the initial pressure reduces in radius, and there is an intermediate zone of rapidly diminishing pressure, with an outer shroud of fine droplets. The effect on the impacted target is that there continues to be a small zone with no erosion in the center, and that erosion is still concentrated around this zone, in that of high differential pressure, which now encroaches on that central sector.


Figure 3. Erosion of an aluminum target with the nozzle 2-inches above the surface, 10,000 psi jet through a 0.04 inch diameter orifice.

That central small plateau is reduced to a very small point by the 3-inch standoff, which is where the jet reaches the end of the distance where the pressure remains constant over the central section. Thus, by a 4-inch standoff the central section, though still present, is being eroded.


Figure 4. Erosion of an aluminum target with the nozzle 4-inches above the surface, 10,000 psi jet through a 0.04 inch diameter orifice.

As the nozzle is moved further back from the surface, that central promontory disappears at around a six-inch standoff. It is interesting to note that at this point the cavity is starting to get noticeably deeper.


Figure 5. Erosion of an aluminum target with the nozzle 6-inches above the surface, 10,000 psi jet through a 0.04 inch diameter orifice. (The lower of the two circular damage patterns was caused through experimental conditions and should be ignored). The presence of a central mound can barely be discerned.

By this time the central section of the jet is beginning to break down into, initially short strings, that very rapidly break into droplets. The damage pattern that results shows a cavity that is slightly increasing both in diameter and depth.


Figure 6. Erosion of an aluminum target with the nozzle 8-inches above the surface, 10,000 psi jet through a 0.04 inch diameter orifice.

By this time the jet is continuing as a series of relatively large droplets, still holding a central structure, though surrounded by a rapidly decelerating cloud of mist.


Figure 7. Erosion of an aluminum target with the nozzle 10-inches above the surface, 10,000 psi jet through a 0.04 inch diameter orifice.

It is one of the interesting oddities of the jet cutting business that the amount of material that is eroded from the target is a maximum at this distance.

However, and this was the subject of great debate back at the time that it was first presented, the ability to control the droplet size, and condition as a function of distance, and the reality that in most applications the target must be cut to depth meant that this has a very limited application. It can be used, if the droplets are generated properly, and used within the relatively narrow window that they exist, to improve surface erosion of material.

However, as Mike Rochester found when he studied this, back at Cambridge in the early 1970’s, the presence of a layer of water on the surface, and as the hole deepens this is almost always there, rapidly diminishes the effect.


Figure 8. The effect of a layer of water in diminishing the “droplet impact” effect in erosion of a surface. (After M.C. Rochester, J.H.Brunton “High Speed Impact of Liquid Jets on Solids” First BHRA Symp Jet Cutting Tech, April `972, Coventry UK, paper A1.)

There are ways of getting around this problem, but the presence of water in the cavity that the jet has produced can also lead to problems, and these will be the topic of the next two posts.

Saturday, May 11, 2013

More rumblings in Iceland

At the beginning of April there was a burst of earthquake activity just off the northern coast of Iceland, and while it occurred offshore there was no evident major disruption. Now there has been a similar flurry of activity down along the southwest corner. (Ed note This was corrected on May 13, h/t to Steve Golson for catching the error which had east and west mixed up). This contained a number of quakes that ran up to around 4, but it also now seems to be slowing down a little.


Figure 1. Earthquakes in the last 24 hours around Iceland (Icelandic Met Office )

Jón Frímann has written a post pointing out that the activity seems somewhat cyclic, and that the last significant events were in either the 18th or 19th centuries, with no indications of any imminent danger.

Both the current events and the ones at the top of the island lie on the Mid-Atlantic rift that runs through the island, and marks where two of the earth’s plates are slowly drifting apart.

NOTE: This post was updated on Sunday, May 12th.

Figure 2. Map of Iceland showing major volcanoes (The Times of London)

However, you may note on the earthquake map that there is also a little current activity around Katla, which is the volcano that I have been expecting to be the next to erupt, after the pattern of quakes that has occurred there over the past couple of years.

Over at Volcano Café the suggestion has been made that, instead of Katla, it will be the neighbor Hekla that will go next, since there was sufficient activity there to warrant a warning to the public in March. That has since been withdrawn, after the region returned to quiescence. Yet there continues to be some activity in the Katla caldera.

I must continue to remember that imminent in geologic terms does not necessarily mean this month.


Figure 3. Relative positions of Hekla and Katla (which is under Mydralsjokull) (Icelandic Met Office)

UPDATE (Sunday 12th May). While the overall intensity of the quakes it diminishing, I can't help note that they are now extending along the rift line, and taking a straight shot at Hekla.


Figure 4. Earthquakes in Iceland leading up to noon 12th May 2013 (Icelandic Met Office)

Thursday, May 9, 2013

Waterjetting 9a - the instant of contact

Plain high-pressure waterjets penetrate into material in a different way than that which occurs when abrasive is used to make cutting easier. And even with abrasive there are different ways in which the target will react depending on how brittle that it is. In this next segment I will write just about the stages that occur as water alone cuts into a target.

In its simplest form consider first a spherical drop of water, moving at very high speed, which suddenly strikes a flat surface.


Figure 1. Droplet striking a flat surface

As the droplet impacts the surface, but can’t penetrate it, so the water that comes into contact with the surface tries to flow away along the surface, to get out of the way of the volume of water striking the surface behind it.

But in the early stages of the impact (see inset) the edges of the droplet ahead of that lateral flow are coming down onto the surface faster than the water can move that is trying to escape. In this range of activity the distance that the edge of the droplet must travel, L, remains smaller than the distance, D, that the water must move to escape.

This instantly traps the water and with confinement comes a very rapid increase in pressure along the edge of the drop. This pressure also acts on the target surface, so that it is pushed down a little. This pressure was first measured by John Field at the Cavendish Lab in Cambridge, UK, who found that it could exceed three times the water hammer pressure that the water might otherwise exert.

For those not that familiar with the term, the water hammer pressure is also sometimes called the hydraulic shock pressure, and it can occur when a valve is suddenly closed in a feed line, and this sends a shock or pressure wave back up the line. (This is what can sometimes cause banging in feed pipes). Often there is a small air cushion built into water lines to act as a sponge, when such a shock occurs, since otherwise the repetitive shocks can cause parts to fail.

This becomes more of a problem with higher pressures because the equation for the pressure that is generated is given by the equation:

Pressure = fluid density x impact velocity x sound speed in the fluid

Compare this with the impact pressure when a shock is not generated:

Pressure = 0.5 x fluid density x (impact velocity)^2

As a very rough rule of thumb, the speed of sound in water is roughly 4,800 ft per second.

If a waterjet is driven out of a nozzle at a pressure of 40,000 psi then the speed at which it is moving can be roughly calculated as:

Jet velocity (ft/sec) = 12 x Square root (Pressure)

The jet velocity, to a first approximation, is thus 12 x 200 = 2,400 ft/sec.

The Water Hammer Pressure is thus 2 x (4,800/2,400) = 2 x 2 = 4 times the pressure exerted by the water more conventionally. Since that driving pressure was, in this case, 40,000 psi, then the water hammer pressure would be 160,000 psi. With the multiplier that Dr. Field found, this can take that pressure up to around 500,000 psi for that instant of contact.

It is, however, only applied to the target at that instant of impact, and where there is the spherical end of the drop to cause the pressure accumulation across the face.

It does, however, cause a very high lateral jet to shoot out of the jet, at about the point that the droplet curvature no longer provides confinement (at about 1/3 of the droplet diameter measured radially from the center of contact).

John Brunton, also at the Cavendish, has provided photographs of the damage done in that instant of contact.


Figure 2. Droplet impact damage on a sheet of Plexiglas (Brunton “High Speed Liquid Impact” Proc Royal Soc London, 1965. P 79 - 85.)

Part of the damage comes from the high lateral velocity of the released water running into the wall of material not compressed under the generated pressure. Mike Rochester found that the diameter of this ring crack closely followed the diameter of the nozzle from which the droplet was released.


Figure 3. Relative size of the ring crack to that of the originating nozzle (jet head) ( M.C. Rochester, J.H.Brunton “High Speed Impact of Liquid Jets on Solids” First BHRA symp Jet Cutting Tech, April `972, Coventry UK, paper A1.)

In our case, however, the jet is not a single droplet, but rather, at least close to the nozzle, a steady stream with the pressure constant across the diameter.

Thus, in the microseconds after the first impact, as the jet continues to flow down onto the target, so it is flowing out across the damaged zone created by that first impact. The resulting pattern of erosion, which we captured in aluminum, changes as the target moves away from the nozzle. Close to the nozzle the wear pattern looks like this:


Figure 4. Damage pattern around the impact point of a jet on aluminum, target close to the nozzle.

The pattern, close to the nozzle, shows that directly under the jet the pressure is relatively even on the surface of the metal. With no differential pressure across the grain boundaries in that region, the metal is uniformly compressed, and suffers no erosion. At the edges of the jet, however, there is not only the original ring crack damage created on the instant of impact, but also there is a differential pressure along the edges of the jet, which helps to dislodge those initial grains, and provide crack loci for the water to exploit and remove material as it moves away from the original contact surface. The greatest portion of the damage, at this point lies outside the edges of the impacting jet as the laterally flowing jet erodes material as the jet continues to flow.

As the target is moved further from the nozzle, the pressure profile changes from one with a constant pressure over the jet, to one where the central constant pressure region starts to decline in size. Rehbinder calculated the two components of the pressure in the target at the beginning of this erosion process at that point and provided the following mathematical plot.


Figure 5. Impact pressures calculated for the pressure into the target and that along it, during waterjet flow. (Rehbinder, G., "Erosion Resistance of Rock," paper E1, 4th International Symposium on Jet Cutting Technology, Canterbury, UK, April, 1978, pp. E1-1 - E1-10.)

The result of this change in the pressure profile of the jet as it moves away from the nozzle can be seen in the change in the erosion patterns of the jet as it strikes an aluminum target, and that will be the topic for the next post.

Wednesday, May 8, 2013

OGPSS - The dangers of complacency

Perceptions based, perhaps on too small a collection of information, can lead into opinions that, on investigation, turn out to be incorrect. Just recently a couple of friends had mentioned that charities that they are associated with were seeing a decline in donations. I built this into a picture of the general public being less able to afford earlier levels of giving, perhaps because of the continued impact of higher costs of fuel. The perception is, however, as a general statement wrong, and (Via the National Park Service from The Giving Institute I learn that:
Americans gave more than $298.42 billion in 2011 to their favorite causes despite the economic conditions. Total giving was up 4 percent from $286.91 in 2010. This slight increase is reflective of recovering economic confidence.

The greatest portion of charitable giving, $217.79 billion, was given by individuals or household donors. Gifts from individuals represented 73 percent of all contributed dollars, similar to figures for 2010.
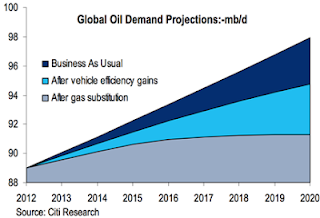
In the perception that is becoming increasingly prevalent on the future of energy supplies, and particularly crude oil, the current adequacy of supply is projected forward to anticipate no problems with supply in the future. Peak oil is now being suggested to occur, not because the supply is limited, but because, with the increasing use of renewable energy, demand will peak, and then decline. Bloomberg New Energy Finance founder Michael Liebreich is quoted as projecting that the growth in fossil fuel use will almost stop by 2030, while Citi Commodity Researchers are suggesting that the increases in prices will drive increases in efficiency that will bring a peak in oil demand “much sooner than the market expects.”


Figure 1. Projected changes in global oil demand from Citi Commodity Researchers)

This anticipation of future gains in efficiency of use is a common thread to pictures of the future from the three major oil companies that I recently reviewed. All three, ExxonMobil, Shell and BP expect that energy efficiency gains will have a major impact on demand. BP, for example, anticipates that through 2030 energy demand will increase 36%, but that without this improvement in efficiency global energy would have to double by 2030.

One of the problems in assessing the changes in efficiency over time is that, when looking at the past decade, one has to recognize the significant impact of the recession. For example, the Odyssee project looked at energy use in Europe and clearly showed the impact of the recession on demand.


Figure 2. Changes in electricity use in the countries of Europe following the start of the recession. (Odyssee)

What also caught my attention in looking where most of the energy savings were occurring was that it was in countries catching up to Western Europe, rather than in the more established West, and that when the overall savings are totaled these appear to have slowed significantly.


Figure 3. Overall energy savings in the EU relative to a 2000 baseline (Odyssee)

The second problem with the curve that Citi projects lies in the rate at which vehicles are switched from diesel and gasoline to natural gas power. There is currently an economic incentive in parts of the world to make this change, it currently sells at around the equivalent of $2.10/gallon in the USA. Yet it requires both infrastructure and an investment of capital to make the change at any level of significance. Nevertheless it remains a key ingredient of the Pickens Plan that Boone Pickens has been selling around the country for a number of years now.

The fact that Clean Energy Fuels can list all 22 stations that added natural gas pumps along the “Natural Gas Highway” in the November-January period, does not indicate a great rush to build that infrastructure. It is easier to change the local distributor networks, with companies such as Waste Management indicating that they will use CNG in 80% of their new trucks, than it is to see the rapid change of the longer distance haulers, and for passenger vehicles. A recent article in the Washington Post noted that only 20,381 vehicles ran on natural gas of the 14.5 million new cars and trucks sold last year. Further not only does a CNG vehicle cost more to purchase, it also has a lower range, although for some applications that may not be much of a handicap.


Figure 4. Average Annual Vehicle miles travelled by category (Alternate Fuels Data Center )

Yet, at the moment, it is the use of ethanol that is having the most impact on alternate fuel use. Other than that there has been little indication of much change in the market.


Figure 5. Alternate Fuel Vehicles in use from 1995 to 2010. (Alternate Fuels Data Center )

And in this regard Europe has also seen little movement toward the use of natural gas, in contrast with the use of biofuels, and neither has made large gains.


Figure 6. Comparative penetration of liquid fuels market in Europe by biofuels and natural gas (Odyssee)

The problem, of course, is that if these improvements in efficiency and switches to alternate fuels do not occur, then the demand will continue along the Business-As-Usual line, and, as BP forecasts, demand will double by 2030.

The question as to what will be available to meet that enhanced demand remains one of the great imponderables that folk seem, again, unwilling to face. Certainly with a steadily increasing demand, and the constraints on supply that these pages have continued to document over the years, it becomes very difficult to see how price stability can be maintained, where demand exceeds supply at a given price. The problems that this will bring, particularly those nations that now subsidize fuel, a policy that is unlikely to change in Asia, are likely to be major. Yet for countries such as India, which last year has spent the allocated fuel subsidy budget for the year by the end of July the political costs of change remain very high and could well remain in place until the financial burden becomes intolerable. Unfortunately, with the current complacency, at that point it will then be too late to start searching for alternate answers.