Thursday, October 31, 2013

Waterjetting 14e - Cavitation and Comminution

In the last post on this subject I discussed how, by adjusting the back pressure in the relatively stationary fluid surrounding a high-speed jet of water, it is possible to intensify cavitation damage. The simple way to find the optimal value for the back pressure for a given jet pressure and size was, we found, to listen to the sound of the cavitation collapse, and by adjusting the back pressure tweek both the sound and range of the cavitation cloud surrounding the jet.

The damage that the cavitation would induce on samples of rock is a function of the time that the cloud plays on the surface. By slowly moving the sample under the nozzle, in a confined cell, different levels of damage could be achieved, based on the speed at which the sample moved.


Figure 1. Traversing specimen cell, with the front cover removed to show the sample in the holder.

When the sample was moved under the nozzle at 2-inches a minute, the cavitation cloud attacked the surface relatively uniformly, with only localized increases in damage. In Figure 2 the red lines mark the width of the cavitation cloud on impact, it then spreads and collapses over the surface to give the wider erosion path.


Figure 2. Traverse over the surface of a dolomite sample at 2-inches a minute. The red lines define the width of the jet. Note the additional depth of removal under the sample ID (15) where the ink chemical had slightly weakened the rock making it more susceptible to erosion.

As the speed of the sample movement is slowed, however, the cavitation attack starts to find weakness planes in the rock and preferentially begins to erode these. As these channels are formed so the jet will flow into them to escape from the following flow of water in the consequent jet flow. As the cloud moves into these narrower spaces, so the pressure increases, inducing more of the bubbles to collapse and thus intensifying the erosion attack along that weakness plane (Figure 3).


Figure 3. Traverse of a cavitating jet over dolomite at a speed of 0.5-inches per minute. Note how the jet is now eating into zones of weakness which are beginning to define pieces of rock that are then liberated as cracks grow all around them.

As the traverse speed is further reduced to 0.4-inches per minute the erosion pattern which is developing in Figure 2 becomes consistent under the full width of the cavitation cloud, and the intersection of developing cracks means that the rock is now being removed in larger pieces and the erosion rate suddenly increases significantly.


Figure 4. Effects of moving the cavitating jet over the rock at 0.4-inches per minute. The cavitation is now developing cracks in the rock that join and break out larger pieces of rock, to a depth of around 0.5 inches over the cloud width.

This ability to focus the jet attack on weaknesses in the rock structure can be useful if, for example, the rock under attack is a mineral ore. Because the ore is defined with weakness planes around the individual constituent grains of the minerals and host rock, at a slow traverse speed the cavitation cloud will preferentially attack those boundaries, in the process liberating the individual grains, and separating the rock into its constituent materials. This liberation can be achieved as the rock is being mined (we have demonstrated this in the lab) so that the valuable mineral can be separated from the waste rock at the mining machine. This means that the waste can be left, in a larger size range than is conventionally left after separation, at the mining site, and does not have to be transported to the surface and ground to powder in order to separate out the valuable minerals. The energy savings that this achieves can be potentially as high as 75% of the total energy currently used at the mine.

Where the mining breaks out the rock without achieving complete liberation a secondary process can be used where the particles of material are fed into a secondary tube, where the particles pass through a second cavitation cloud. The attack of the very small bubbles on the mineral particles is such that the fragments of ore are rapidly broken (comminuted) into much smaller sizes in a process which, because there are so many events occurring sequentially , can appear almost instantaneous.

Tests at Missouri University of Science and Technology, for example, have shown that 0.5-inch sized pieces of coal can be reduced to 5-micron size in a single step. There is a video attached to this post of one of these tests. Figure 5 shows the equipment, with the coal in the inner metal tube, while the surrounding space is filled with water under slight pressure. 


Figure 5. Equipment to comminute coal to 5-microns (The size of the feed coal can be seen in the plastic box on the right).

Water to the cell does not have to be at any great pressure. The test has been successfully run with the water fed from a pressure washer obtained from the local hardware store for less than $100.


Figure 5a. Early in the test the water flowing out of the inner tube is filled with fine particles of coal as the cavitation breaks the pieces down to the required size.


B) A short while later and the outer tube begins to fill with the fine material.

One of the advantages of coal at 5-microns is that it can be mixed with water in about a 50% slurry and fed into a diesel engine, which will then run. GE has tested a locomotive and shown that it is possible to run the engine on the mixture, should conventional diesel no longer be economically available.

The process also works when a harder rock, such as dolomite (a host for galena and other minerals) is placed in the inner tube. The cloud color in this case is white.


Figure 6. Using cavitation to crush dolomite. The original particle sizes are in the box on the left, the cloud of particles is at around 5-microns.

Wednesday, October 30, 2013

Tech Talk - Wind and Water in Southwest Scotland

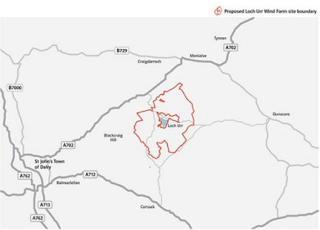
It was an unexpected encounter! Last Tuesday we had come back to my Mother’s childhood home at St. John’s Town of Dalry in South-West Scotland on family matters, when we heard that the Town Hall was hosting an informational visit by representatives of E-on. Their topic was the planned new wind farm at Loch Urr, itself part of the development of the South West of Scotland as an energy source. Not unexpectedly, there were also protest posters outside, and an earnest young lady inside with a handout to provide an opposing point of view.


Figure 1. Location of the planned new wind farm near Dalry (E-on)


Figure 2. Planned wind farms near Dalry (Save Loch Urr)

I had barely made it into the room when I found, to my surprise, that I was entangled in the debate. It was raining, which it does a lot in this part of the country, and a gentleman visitor was wondering why this “gift of nature” was not being used. None of the folk there (on either side of the argument) was willing, nor perhaps even knowledgeable enough, to comment. Sigh! As a child I was first aware of the turbines on the river Ken, which runs past the bottom of the village, when one afternoon while I was still under the age of five, the local power station turned them on, and as the water in the Ken downstream of Earlstoun dam started to rise, my pants got wet, as I sat along the bank.


Figure 3. Earlstoun Dam spilling water after heavy rains in October 1953 (I have similar photos from March 1955, courtesy of Nora Little)

There are six dam/hydro-electric power station combinations around St. John’s Town of Dalry, collectively forming the Galloway Hydros, a complex with an installed capacity of 104 MW that was built in the 1930’s.


Figure 4. Layout of the Galloway Hydros dams and power stations

They have been there all my life, as part of the national power grid since they were installed, and I don’t recall there ever being much controversy over their existence or use, apart from the question of manning levels and automation. Apart, that is, from the minor inconvenience that their use causes due to the rise of the river when the turbines are running. The increase in water flow floods the stepping stones across the river that were a part of the Southern Upland Way (but have been replaced by a small footbridge upstream) and raises the level of the water, at a slow but inexorable rate that can catch unwary children by surprise. (Fast enough to wet the pants of the inattentive, slow enough that they can easily move out of the way before there is a more significant problem). The claim is that the power can be on line to meet demand within 5 minutes.


Figure 4. Remnants of the stepping stones at Dalry

There is already a wind farm just east of Dalry, which, after some searching, we had found on an earlier visit. It is hard to know that it is even there, and has had very little impact on the surrounding scenery, which is an important part of the attraction to the tourists that bring an important support to the local economy. (There is not a huge global demand for Clydesdales, another village business).

The E-on representatives were quick to point to artist’s renditions of photos on the exhibit that were intended to show that the new additions would not bring much significant change to these important vistas – far away as they lie from Edinburgh in political miles. Scottish energy independence is a critical part of the platform of the Scottish National Party, who are running a campaign to persuade their countrymen to vote next year to renounce the Treaty of Union of 1707 a hundred years after events brought James 6th of Scotland down to London as the first King James of a United Kingdom.

Unfortunately there was not a whole lot of information at the Town Hall on what exactly was planned for the wind farm, nor what the contribution would be to the promise by the SNP leader that the country will become energy independent after a sufficiency of these turbines are installed. On our journey north we had seen how ubiquitous the installation of turbines has been in the past few years. They are part of the landscape from Sherwood Forest on north, and line the coast in Northumberland and Durham, around where the coal pits used to be.

This is the land of the golden eagle, where red kites have been successfully reintroduced after disappearing in an earlier time. Will the turbines impact that population? And is it an important enough question to influence a scheme that will bring potential sources of power that will be independent of foreign sources? The trials of underwater turbines seeking to harness tidal power are a lead in to possibly more ambitious plans in the near future. But they have also reminded engineers (as other columns at this site have shown) how aggressive the combination of sand and water can be in cutting apart structures introduced into their environment.

A greater percentage of the wind turbines were rotating than I had seen in the past, but this is the time of year when that might be expected. In the less windy days of summer and winter when the need will certainly be greater there is less assurance of their contribution. This is unfortunate since the local economy is not doing well, the housing market is almost non-existent since there are few jobs outside the struggling tourist trade. The roughly 70 long-term jobs that the turbines will bring to the region won’t compare with the numbers that might have come with a resurrection of the coal trade, nor will it replace the disappearing wealth that the declines in production from the oil and gas fields offshore are already imposing on the Scottish economy. Nevertheless the Scottish Government is committed to an energy policy that ambitiously anticipates producing all its electricity needs from renewable sources by 2020.

There is no doubt that the UK needs a better energy policy than any of the major political parties is espousing right now – but whether putting hundreds of turbines into a land of great scenic beauty (when visible through the rain) is the right step requires a more detailed answer than was available at the meeting.

Editorial Note - my apologies that the Tech Talk post was delayed this week, but the local inn in Dalry changed hands last week, and that meant that the internet was down for the time that we were there, and a series of unanticipated other problems stopped my being able to post until I returned home.

Sunday, October 27, 2013

Travel progress

Having wandered in the hills and vales of Burns' country for the past few days, we were then held on the trans-Pennine highway for four hours after a car about 30 vehicles ahead of us sideswiped a tractor. There are no local services at the peak of the road, and a helicopter had to be brought in, and then the accident team had to be called in and take their measurements and photos, and then the surface had to be treated before the road could re-open.

Now this sequence of disruptions to posting might now be considered over, since we have reached Heathrow. But the UK Met Office is now predicting the imminent arrival of a storm known as St. Jude. How much this will disrupt traffic in the morning remains a big question. I will report on progress, below the fold, tomorrow as it happens.

8:00 am. There were sounds of heavy winds at about 6:00 am, but planes are flying, and the traffic outside seems to be relatively normal.

10:45 am Talking to the taxi driver on the way to Terminal 5 he said that the storm was worst about 6:15 am and lasted about half-an-hour. A tree branch almost hit the cab then, and a small child was blown down the road, before her Dad could grab onto her. But now it is sunny and appears to be turning into a very nice day.

Waterjetting 14d - Traversing Cavitation

Within the normal range of everyday fluid flow cavitation is something to be guarded against. Because it occurs when water is put under conditions where, through geometric or working conditions, it is either pulled in tension or shear to create the small cavities of sensibly vacuum that lead to cavitation damage, there are many ways it can be formed. In an earlier post I mentioned the cases where moving water past a blunt-ended surface at high speed can cause the bubbles to form. In an alternate form, this cavitation can be generated when solid bodies are dragged through relatively stationary water at high speed.

The most common example of this is with propellers and underwater craft, where the relative flow paths over a moving, submerged body can cause bubbles to form and collapse. When the bubbles collapse, even though individually tiny, they can, because of their number, create a fair amount of noise. That noise, generated behind the spinning blades of a driving propeller, was one way in which submarines could be detected and located during the Second World War.


Figure 1. Cavitation forming as water flows around a probe.

Notice that, in Figure 1, the bubbles form and collapse over the length of the probe, which was, in this case, held stationary while water flowed over the surface within a tube. The relative motion is the same as though the probe, a potential submarine shape, was moving at speed through stationary water.

There have been a number of different flow chambers built at different research centers, each in their own way trying to build a device that would allow study of the ways in which cavitation damages surfaces, and to evaluate different materials for cavitation resistance. I have mentioned the ASTM test methods earlier.


Figure 2. German cavitation test apparatus

In one such design, (Figure 2) German investigators built a flow channel where the flow channel was narrowed, and then expanded to induce cavitation in the downstream flow. By then placing a test specimen at the point of maximum bubble collapse, a test could then evaluate the different material responses.

The concept of creating shear, as well as tension in the water around a flowing jet can similarly be imagined where the design above is modified so that the jet that issues into the downstream flow is pressurized to higher velocities. This was the basis for the cavitation cell developed by Andrej Lichtarowicz at the University of Nottingham. This can be applied in a number of ways, in the one below, for example, Canadian investigators had developed a portable version of the concept.


Figure 3. Early method for inducing cavitation around a submerged jet.

However, it was the Nottingham cell that provided the basis for a move forward in the technology as a number of us, around the world, collaborated with Dr Lichtarowicz in trying the new concept. Early on we noticed that if one listens to the noise made by such a jet, it is possible to hear a change in the pitch of the sound as the relative pressure in the surrounding water changes, relative to that of the driving jet. This relationship is defined by the definition of a value known as the Cavitation Number of the condition.


In this equation Pd is the pressure in the downstream fluid, Pv is the vapor pressure of the fluid, and Pu is the driving pressure behind the jet.

For higher pressure cavitation flows the vapor pressure is sufficiently small that the equation can be simplified to the ratio of the downstream pressure (say 50 psi) divided by the jet pressure (say 10,000 psi) which would give a close approximation to the cavitation number ( 0.005).

Dr. Lichtarowcz simplified the design of a cell in which a submerged jet could be directed at a target, with the back pressure in the cell adjusted to control both the intensity of the resulting cavitation, and also its position of maximum damage.


Figure 5. Early design of a Lichtarowcz Cavitation Cell

This design was of interest to us, since it allowed rock samples to be used and evaluated, and we built and tested several different models based on this design. The two windows allowed the jet and specimen to be lit and viewed during a test.


Figure 6. View of a cavitating jet, with the cavitation cloud of bubbles collapsing at the surface of the specimen on the right.

Dr. Hood, in Australia, has shown, with high-speed photographs, how changing the back pressure in the chamber changes the effective damage range of the jets.


Figure 8. Back-lit photographs of jet and cavitation cloud collapse as the ambient chamber pressure is increased.

The above pictures show why, in underwater applications, the range of a high-pressure waterjet becomes increasingly restricted as the pressure increases. This is of great importance where, for example, high-pressure jets are being sent to the bottom of an oilwell to clean the filter screens. The range of the jet is controlled, in part, by the jet diameter, as well as the pressure, but can also be expedient to add different chemicals to the flow in order to enhance the range, and I will write on that in a later piece.

However, it was through the control of the range, and the intensity of the cavitation that we discovered, in applying the cavitating stream to rock, that the damage was now occurring at a fast enough rate that the small samples, and longer test times of the conventional test were no longer viable. The small samples were being consumed in a very short time, and so the design was modified, so that a target block of rock could be moved under the jet, at a rate of around an inch a minute, while maintaining the cell pressure to intensify the damage.


Figure 8. Section of a 2-inch deep hole drilled (at 6,000 psi jet pressure) into a block of dolomite. The damage is caused by cavitation since, at that jet pressure, the fluid would otherwise not damage that particular rock. Note that in this test the sample was not moved relative to the nozzle, and the jet was impacting at the top of the rock, which is to the right end of the hole drilled.


Figure 9. Traversing specimen test cell – schematic view from the top showing the starting position of the jet. The jet is positioned on the end plates until the test starts, and the sample is moved under the jet until the second end plate is reached, when the test is concluded.

The sample had to be moved at a controlled speed since, as the jet cut down into the rock, so the target surface moved away from the jet, and the depth of focus for maximum cavitation damage is relatively narrow – depending on the test condition.

It is in this balance between the effective damage range of the jet, and the intensity of that damage, that is yet to defined in a way that will focus the intensity of damage to its greatest potential. However there are other ways of using that potential, and I will describe those next time.

Wednesday, October 23, 2013

Humble apologies

Having gleefully headed out into Southwest Scotland this past weekend, we have suddenly discovered that the place we usually stay at (and are) is changing management this week, and so is out of internet. Given the small size of the village the only recourse is to slide into the reception area of the competition (otherwise almost closed) to grab a few minutes of time to allow this message. New posts will therefore be restricted until we return to a less flooded part of the world at the end of the week. My apologies, this was totally unexpected. sorry again.

Monday, October 21, 2013

Tech Talk - ten years is a long time to wait for power

Today the British Government are announcing the construction of the first new nuclear-powered electricity generating station in 20-years. The new plant, which will replace plants that will close will go up at Hinkley Point, and will be constructed by a French firm, with significant Chinese investment, and with a promised subsidy from the Government. It won’t, however, start producing electricity until 2023, and even then only if everything goes well.

Euan Mearns has been pointing out some of the problems that the country faces as it closes existing power stations in order to meet environmental directives from the EU. The long-term supply of power at an affordable price is being increasingly challenged as the margin between demand and available supply shrinks. The leader of the Labor Party is promising that prices will be fixed by edict, an action that is unlikely to encourage investment at a time when it is clearly needed to help provide additional plants to replace the lost capacity.

The information on the new power station construction highlights the problems that the county will increasingly face. Although it is relatively quick and straightforward to close a plant (and then to demolish it), funding, permitting and constructing a new plant will, in this case, take ten years. In the interim it will likely prove increasingly challenging to find an adequately priced source of power for the 7% of the British market that will be supplied from the new facility.

Power generation requires both that a power station exists to transform fuel into electricity, and also that there is a steady supply of that fuel (or energy source in the case of the renewable generators that rely on wind, the sun or water). The ten-year time frame for construction of the new plant means that it will not appear in the energy equation until there has been a considerable change in the available supplies of the different power sources needed to keep the electricity flowing. In the meanwhile it would appear that the UK will increasingly rely on diesel generators to provide more than just back-up power.

It is a time-scale that will see a continued decline in domestically produced oil and natural gas in the UK, and with domestically produced coal-fired power still viewed negatively, the country will be forced to increasingly rely on imports from the rest of the world to provide the fuel needed. But in that time frame the evidence that oil supply is finite is going to become much more visible to the general public. A steady growth in demand of around 1 mbd for oil cannot be sustained over the next ten years, since there are an inadequate number of new prospective fields capable of providing that increment, especially when the need to replace an annual decline of around 4.5 to 5 mbd in existing production is also factored into the equation. (Remember, in that time-frame, that current fields such as the Bakken and the off-shore Brazilian fields now coming on line will have moved well into post-peak production).

Oil-fired power, whether through use of major power plants, or through the more widespread use of diesel generators, will become an increasingly impractical part of the answer. The anticipated solution is expected to be through the more widespread use of natural gas.

The advent of large volumes of shale gas, and easier access to some of the large fields in Asia continues to radically change the potential supply sources and prices that will be charged for a fuel that can arrive either through pipeline or by LNG tanker. Yet, as the large conventional fields such as those in Turkmenistan are tapped to feed the growing Chinese market, the supply to the rest of the world will have to come from the more expensive shale gas and from regions more expensive to develop. Well costs are now quoted routinely at around the $10 million mark, and can only be anticipated to continue to rise. As the global market for natural gas at a higher price provides an incentive for increasing levels of exports from the United States, the current glut in supply will disappear and prices will to more closely follow those on the global market. This could well stop the migration of industry from the more energy-expensive parts of Europe to the USA, but it is unlikely that US prices will reach those of Europe, and so although overall prices will rise the relative ratio of prices will not change and that drift will likely continue.

But putting too much expectation on natural gas to become the energy savior of the world is unwise, given the very rapid decline in yield from existing wells, and the consequent need to continually drill new ones to sustain supply. Further the potential supply from some anticipated reserves has been reduced, as exploration shows that limits to both what is there and what can be reasonably recovered. (The Polish experience is a good example of this). This is likely to become increasingly clear over the next decade, as global natural gas reserves are asked to carry a significantly greater portion of global energy demand. Natural gas-fired power plants are cheaper and faster to produce than nuclear plants, and coal-fired plants can be converted to gas use. (The power plant at Missouri S&T, for example, although fired by coal and wood, was fitted with gas burners that were, for most of its operational life not used).

But there are limits to the practical volumes of natural gas that can be supplied, at reasonable cost. As these bounds start to appear over the next decade the questions that will arise will start to focus on what can be used to replace it. To date renewable sources have not provided the panacea that was heralded to occur as they were eased into the market place. The economic subsidies used to encourage more widespread use of solar and wind have become less acceptable to Governments and their budgets, and it seems unlikely that the subsidies can continue to be used to foster future growth at greater levels of scale.

Domestically produced coal-fired power will likely continue to be a major part of energy production in the less well-developed nations, simply because it will provide a viable way of providing power at an acceptable financial cost. Whether the vehement denunciations of its use in more advanced countries, as a source of greenhouse gases, is still dominant in ten years, particularly if global temperatures continue to remain relatively stable, is more a political rather than an energy source debate. But the decisions on what to build post-Hinkley Point will have to be made soon, and the choice may be more limited than is yet to be recognized.

My apologies, this is being posted from Terminal 5 at Heathrow, where I am frantically charging my laptop, as I travel through the UK. Posting will be a bit spotty for this week until I return home.

Tuesday, October 15, 2013

Waterjetting 14c - Intensifying Cavitation

In this short section discussing cavitation, I have, to date, described what it is and the normal method for determining cavitation resistance, and some of the damage that can come from unexpected cavitation in civil construction. Most efforts are directed at suppressing cavitation, since it can do a lot of damage and cause machines to fail. However, for those of us who work in excavation and cutting, finding ways to exploit cavitation and enhance the damage it causes can be productive.

The initial paper, that I am aware of, written with this suggestion was presented at the First International Symposium on Jet Cutting Technology (ISJCT) by Johnson, Kohl, Thiruvengadam and Conn “Tunneling, Fracturing, Drilling and Mining with High-Speed Waterjets Utilizing Cavitation Damage.” The paper was given in 1972, and one of the demonstrations that came out of this was of a small jet, at relatively low pressure, drilling a hole through a brick. The penetration rates reported in that paper were relatively low in comparison with conventional tools, but with a jet pressure of 2,000 psi and diameters of up to 1/8th inch, the hole could not be made without cavitation assistance.

The early nozzle designs were designed to induce cavitation bubbles in the center of the jet stream.


Figure 1. Cavitation induction in a nozzle (Johnson et al ibid)

Cavitation is created by developing shear or tensile forces in the water. In the left-hand part of figure 1 the jet is spun so that a vortex is generated in the flow as it enters the narrowest part of the jet. This creates the bubbles that are then carried down-stream in the center of the jet flow, and hopefully collapse at the target surface.

Perhaps the most advanced versions of this concept were later used by PetroPhysics, a company based in the Bay area of California. The Dickinson brothers used the aggressive, but spreading, jet coming from the orifice to clean oilwells and to allow them to drill holes into rock, without needing to rotate the nozzle assembly. The nozzle was a little more advanced than the initial design, but the jet had to drill a larger diameter hole, if the nozzle assembly was to follow the jet into the rock.


Figure 2. A detail of the Petrophysics nozzle

The great advantage of this tool was that, because it did not rotate, it could be used to drill long-lateral wells from the bottom of an existing oilwell out into the oil-bearing rock. This will significantly improve the penetration rate in many wells. (On a word of caution - there are other companies that claim to be able to do this, but some of them have less credibility than others, since the use of hose as a feed pipe means that the hose can fold up in the main well, suggesting that the bit is drilling, when it is not – there should be lots of cuttings and fine rock in the hole (making it more difficult for the drill to advance) if the drill is actually working).


Figure 3. Schematic of the PetroPhysics drilling concept.

Part of the problem with this system lies in the difficulty in ensuring that the hole diameter is of consistent size. When, in other work, we used a waterjet to drill a long horizontal hole, several hundred yards long, we found that the jet tends to preferentially cut at the bottom of the hole. If this is not built into the design (by tilting the nozzle up an adjustable amount) then it becomes very difficult to ensure that the hole runs straight, instead of curving increasingly downwards (and thus out of the target rock). Yet (though I never saw it work) it was reported that the drill was able to drill quite successfully in granite in California.

This design gave a broad path for cutting, and we were looking to provide a highly focused cutting stream, so the design suggested in the right-side of figure 1 seemed more attractive, and perhaps easier to construct. One of the thoughts in choosing this was that, as the jet hits a target, the reverse flow on rebound will protect the surface from some of the bubbles, whereas if the bubbles are in the center of the jet, then that lateral flow will force collapse against the surface.


Figure 4. The rebounding jet can protect the target from the collapse of cavitation bubbles, or focus their collapse if they are in the center of the jet.

But if a small, flat-ended probe is placed in the right place within the nozzle, then the flow of water past it will induce cavitation in the center of the stream, which is the object.


Figure 5. Sketch showing the location of the centerbody within the nozzle.

Note that the centerbody has to be back from the front of the orifice. The reason for this is that if it is not, then the vacuum pulled on the tip will be sufficient to drag air through the jet, so that all the probe will do is break the jet into droplets. (And we can prove that isn’t the case otherwise, as I will describe next time).


Figure 6. Relative change in erosion power of the cavitation as a function of the distance from the front of the tip to the face of the nozzle.

Even without this central probe in the nozzle it is possible for cavitation to occur, and bubbles to collapse, within the nozzle body. Doug Wright of StoneAge has shown that this can be quite severe, degrading nozzle performance significantly.


Figure 7. Cavitation damage within the throat of two nozzle channels (Doug Wright)

The simple designs that we used, pins held the parts together for alignment, allowed us to cavitate a waterjet at pressures up to 20,000 psi, at which the resulting stream drilled through a piece of alumina held close to the nozzle, and was able to drill (at a pressure of 6,000 psi) out more than 18-inches from the nozzle into dolomite.


Figure 8. Titanium probes showing the flow passages and the probe itself. Note the progression of cavitation damage at points on the probe. These caused the tip to break off after runs of several minutes.

Although there is a great potential for further development, this area of development fell into disuse, partly because of the power that can be generated and used for other purposes, and I will discuss those, next time.

Sunday, October 13, 2013

Tech Talk - life gets more difficult at Gazprom

There was a time, not that long ago, when if I was short of a topic for a post, I could Google “Gazprom” and there was sure to be a story out there about another expansion, or take over of a national pipeline – or some other sign of the companies growth and power. But in the natural gas industry there has always been a certain volatility. In the United States Chesapeake, the second-largest natural gas producer in the US, is laying off 800 workers as it completes its plans to re-organize by the end of the month. The price for natural gas is around $3.79 per kcf which still falls below the price required to make many wells in tight shale adequately profitable. I have written about gas price problems a number of times in the past, dating back to at least 2009 and though the price is now up over $1 per kcf from those times, as the recent report in the OGJ noted, Chesapeake had, in estimating returns, anticipated it would be up around $7.21.

Gazprom’s problems however relate more than just to the price of natural gas, and the continuing difficulties in defining future price, although those too still exist. In the agreement that the company signed with China last month, for example, although it says:
All the major terms and conditions of future Russian natural gas supplies to the Chinese market via the eastern route were agreed on, namely, the export volume and starting date, the take-or-pay level, the period of supply buildup, the level of guaranteed payments, the gas delivery point on the border as well as other basic conditions of gas offtake. The price conditions will not be linked to the Henry Hub index.
It turns out that the price has yet to be determined. Gazprom is expected to sell its gas into Europe this winter at around $10.62 per kcf, which is down about 7.5% over last year. Nevertheless the Chinese are hoping to pay no more than $7.10 per kcf. And they have more than a little leverage.

Gazprom had been hoping to market the liquefied natural gas (LNG) from the ExxonMobil fields at Sakhalin Island as well as from their own wells, but that discussion has now fallen through so that this becomes a competitive rather than complimentary source of supply. Concurrently China has just confirmed the increase in purchases of natural gas from Turkmenistan.

Not that many years ago all the exported natural gas from Turkmenistan had to run through Gazprom pipes, and thus the company could charge a hefty premium in carrying the gas to Europe and elsewhere. With the opening of pipelines from Turkmenistan to China, that monopoly disappeared, and now the Chinese have agreed to take some 2.3 trillion cubic feet (Tcf) (65 billion cubic meters) of Turkmen natural gas per year, increasing their take by 882 bcf and requiring an additional pipeline to carry this new volume. Given that the country already supplies over half of Chinese natural gas imports, this will continue to squeeze Gazprom’s ability to control prices in Asia.

This new volume will come from a new field in Turkmenistan, the Galkynysh, which is expected to hold a reserve of 900 Tcf. China is investing $8 billion in the development of the field, and the new pipeline to China.


Figure 1. The location of the Galkynysh field within Turkmenistan (Trend)

And Gazprom’s problems don’t end in Asia. Part of the problem that they ran into at Sakhalin Island is that ExxonMobil is working with Rosneft to build an LNG plant through which to market their product by tanker. This circumvents the pipeline monopoly which has allowed Gazprom to dictate terms in the past. The plant is expected to handle 5 million tons of LNG per year, and is anticipated to come on line in 2018. Initial construction contracts have now been signed.

Roseneft, and Novatek have both now been given permission to export LNG, overturning the Gazprom monopoly, and Novatek has the deposits in the Yamal Peninsula that could be more conveniently marketed to Europe, but with LNG tankers that could also reach Asia and beyond. The natural gas will initially come from the South Tambeyskoye field, which has an anticipated reserve of 17 Tcf, with an expected production of around 1 Tcf per year.


Figure 2. Location of the South Tambeyskoye natural gas field, and the planned site of the LNG plant (Novatek )

The plant will operate three trains, each with a capacity of some 5 – 5.5 mmt. It is perhaps no surprise that China is backing the plan with a 20% investment, for which it anticipates being able to purchase at least 3 million tons of LNG pa. An additional 10% of the funding is likely to come from either Japanese or Indian investors. Total of France also has a 20% investment and presumably will gain a proportionate share of the shipments.

As if these challenges to Gazprom’s dominance were not enough trouble, Gazprom is seeking to have two German companies EON SE and BASF SE pony up another billion dollars because Gazprom has been able to increase the reserves at the Yuzhno-Russkoye field in Siberia.


Figure 3. The Yuzhno-Russkoye gas plant in Siberia that feeds into the Nord Stream pipeline (Nord Stream )

Figure 4. Location of the Yuzhno-Russkoye field (Wikipedia)

And just to rub it in, the European Union is planning on hitting the company with anti-trust charges. Given that the company has been able to dominate natural gas sales into Europe though pipelines, and thus has also been able, in the past, to control prices, this new step could prove expensive to the company, just as it faces greater competition in all its export markets. (This does not even consider the potential for LNG competition out of the United States).

The company is getting its supplies from increasingly expensive locations (hence the need for the cash from the German companies) and the income losses that it has seen in the market due to Turkmen competition are already hurting – but it needs more money if it is to be able to keep up its market share.

Before leaving there is an intriguing graph that Ron Patterson has posted at his site.


Figure 5. Process gain in refineries around the world and in the United States (Peak Oil Barrel )

The plot is at the end of a discussion on the difference between counting all the oil produced in a country and the break-down into crude and other sources that add into the total. One part of this is the gain in volume, process gain, that comes when crude is refined. It therefore acts as a marker of the volume of crude that is running through refineries, and as Ron notes, this has now plateaued for the past few years. Interesting!!!

Saturday, October 12, 2013

A Calendar for the Ages - the MS&T Stonehenge part 2

In the last post I discussed the historical background to the British Megalith Stonehenge, and briefly how it was decided to create a similar construction, albeit at half-scale, on the campus of what is now Missouri University of Science and Technology (MS&T). So we skip forward about 4,000 years from time of the last post and the new Chancellor of our campus wanders into the refreshment room at a Conference on Engineering Education in Oklahoma. There he saw one of his new faculty – and over a glass or two of the water of life (uisge beatha) mentioned that he had interest in a Stonehenge, while I mentioned that we had just developed a new method for cutting granite, and I had some idea of where to get the rock. Before I knew where we were, I was on a committee, and we were planning a monument.

The campus was already in process of building a new Mining Building, itself near the Computer Science building, and there was a nearby space beside the campus Observatory. And this became the site for the new megalith. (It consists of 55 stones). As with the early constructions, this was planned to be a working calendar, and Dr. Senne used computer models to predict the positions of the sun, and the North Star to ensure that the monument would be an accurate model for at least four millennia. But, because it was in a different location, and because of the limited space, we had to modify the Neolithic design. So this post will describe how the megalith acts as a calendar and then the next will describe how we made it. (It had to be half-scale because even at that size a single stone filled a rail car).


Figure 1. An ancient monument recreated (with modern power generation in the background)

The solar alignments were built around the center of the structure, and this can be found as a small metal disk, which has been surveyed into place by the National Geodetic Survey, and mounted in a cylinder of concrete.


Figure 2. The marker at the center, with the dot in the triangle being the focus.

The first and major alignments, as with the original, are those that mark the position of the sun at midsummer, and midwinter. The stones are aligned so that the sun can be seen as follows:

At midsummer the sun will rise over the Heel stone. This 35-ton block of granite at the far end of the approach walkway is not exactly aligned at present, since the church behind it conceals the very first seconds of the sunrise, but it is close. A tree that initially marred the alignment to the center of the stone has since died, and the alignment is now better than it was when built. The alignment should not change over the coming millennia. (Granite erodes at around one inch every thousand years, and the Heel Stone is set in a full truckload of cement, to guard against earthquake-induced movement).


Figure 3. View of the Heel Stone from the central marker (lower front right).

As the sun passes through the sky that day it will move relatively around the southern half, past the East and West markers, and at sunset will lie between the two legs of the North-West trilithon.


Figure 4. View of the North-West Trilithon, the midsummer sunset through these legs casts an orange beam that reaches to the central marker column, at its diameter. (lower front left).

For the midwinter sunrise, the current McNutt Hall, housing the Departments of Mining and Metallurgy, hides the first few minutes of the rising sun, yet the sun still first appears through the legs of the South-East trilithon. As time has passed the antenna on the building that, fortuitously, marked the point where the sun was first seen has been removed.


Figure 5. Looking through the South-East Trilithon to the point where the sun rises at midwinter.

During the course of that day the sun moves over its relatively shorter arc, and at sunset appears to go down between the legs of the South-West trilithon. As with other alignments the construction of the University residences has slightly displaced the true alignment to the sunset on the horizon. For the next few years I suspect that the tree that is now growing into that view will further block this alignment.

Figure 6. Looking through the South-West Trilithon, from the central marker, toward the midwinter sunset.

This gives us two days of the year, which really aren’t enough to define the seasons, but one can add two more, based on the two equinoxes in March and September. On those days the sun rises directly in the East, and sets directly in the West. Thus, by putting small notches on the East and West marker stones, the day the sun rises and sets in those places identifies two additional days.


Figure 7. The notches on the a) East and b) West marker Stones, with a notch on each to mark the sunrise and sunset at the two Equinoxes.

This still, however, only gives us four days, and the Chancellor was decidedly against adding the nineteen stones to give the ancient calendar. Dr. Senne suggested, and it was agreed, that the site should be “Americanized” and that the calendar should be based on the use of the sun position, as developed by the Anasazi Indians in Colorado.

However, instead of their complex curves, he suggested a simple analemma carved into two central stones that would mirror the position of the sun at midday as projected through a small hole set within the Southern Trilithon assembly.


Figure 8. Points showing the position of the sun at midday over the course of the year. (Stanford Solar Center)

The inverse of this curve (since it was projected through a small orifice) was therefore inscribed onto the two stones in the center. The faces carrying the inscription were the only two faces not cut with high-pressure water within the construction.


Figure 9. The central stones carrying the analemma markings.

For the winter half of the year, when the sun is lower in the sky, the sun’s image will fall on the vertical face, during the summer half the sun is higher and the image will fall on the horizontal face. At the equinoxes the sun image travels along the joint between the two stones.


Figure 10. A small brass plate is mounted just below the capstone of the Southern Trilithon. There is a small hole in this plate through which the sun’s image is projected onto the faces of the two central stones. (It takes about ten minutes or so, on either side of midday, for the image to cross to the line and then again to move off the stone.)

The analemma was scribed into the stone with a sand-blaster after Dr. Senne had laid a full-scale tracing on the rock, to show the required positions. To make it easier to identify the actual date the line has been marked at five-day intervals within each month, which are also identified.


Figure 11. The sun’s image centered on the line at midday on the ?th of ?. (You need to read the date from the analemma).

Unfortunately this marker is likely to erode away over the next 500 years, at which point, unless it is renewed, the calendar will cease to function. In his book Mike Parker Pearson noted that the lower surfaces at Stonehenge had been shaped, but it is hard to know, after this passage of time, whether there were superficial markings on the stones, such as we have created, that would give a different way of telling the days of the year.

There was one other thing that we added. Although the North direction is shown with its own marker stone, this might get displaced, or lost. Thus a window was created in the Northern Trilithon, so that a person of normal height, standing between the light wells beside the central marker, will see (on a clear night) the Pole Star within the window, for (Dr. Senne assured us) the next 4,000 years.


Figure 12. The Polaris Window on the Northern Trilithon.

I will complete this series with a short post on how we cut and installed it, next time.

Wednesday, October 9, 2013

A New view of an old Circle - Post one on Stonehenge

Back in 1983 I was asked to work on the construction of a Stonehenge monument to be built on the campus of what is now Missouri University of Science and Technology. The new Chancellor of the campus, Dr. Joseph Marchello, had helped establish the Center for ArcheoAstronomy at the University of Maryland. He had wanted to build a Stonehenge, and we had just developed a new way of cutting rock with high-pressure water, and had contacts with the Georgia Granite Association as a result. The monument, which ultimately consisted of 55 different stones, was designed by Dr. Joseph Senne, who was then Chair of the Civil Engineering Department on campus. But to understand why we built ours, one has to understand why the original was built, on Salisbury Plain in the UK, some 5,000 years ago. And this discussion has been helped by the new book “Stonehenge – A New Understanding” by Mike Parker Pearson, discussing the recent Stonehenge Riverside Project.


Figure 1. Location of the original Stonehenge (Google Earth)

Although there are legends that it was built by the Druids, they actually came after the circles had been built, and it should be remembered that, when the Romans came to the UK 2,000 years ago Stonehenge was already over 2,500 years old.


Figure 2. Romans versus Druids – the Roman version

In looking back on that period remember that the history was written by the Romans and that they had to justify their invasion. Thus the picture that they paint of British society at the time is colored by those needs, and their image of Druids as backward painted savages is unlikely to be close to reality.

But why was there a need for these circles? Well back some 50,000 years ago mankind had migrated out of Africa and slowly spread through Europe and Asia. But as they spread they originally retained their cultural structure as hunter-gatherers.


Figure 3. The migration of humanity from Africa into Europe and Asia (National Geographic DNA project)

They reached Spain and Portugal as Cro-Magnon man, but were still largely hunting and subsistence gathering at that time. Such groups are small, typically, as one sees with the Hatzabe in Africa today, they number around 20 individuals.


Figure 4. The Hatzabe a family group of about 20 individuals.

The group size is similar with the Sami in Scandinavia, families that still follow the herds of reindeer as they have done for millennia.


Figure 5. A Sami family group of reindeer herders from Northern Scandinavia

Such tribes (including the Bakhtiari of Iran that Bronowski documented in “The Ascent of Man”) are migrant, and do not have time for much other than staying alive. But, with time, the culture changed and people began to farm. This change began around 12,000 years ago, likely in the Middle East. It was not until 6,500 years ago (4,000 BC) that trees began to be cleared and farms established in Southern England.

One of the advantages of farming is that the tribe does not have to move continuously to sustain itself. Cronon, in Changes in the Land, notes that in non-agricultural Maine the population was sustained at around 41 persons per hundred square miles. With the beginning of agriculture further south in New England (pre-European arrival) the native peoples could sustain 287 people in a similar area. More intense development of crops and the domestication of animals followed, leading to larger and more closely knit communities.

But there is one problem with the switch to agriculture on an increasing scale, one needs to know when to plant the crops. And while initially this was likely imitative of nature, over time the tribes needed to develop a calendar.

Lying by the fire and staring up at the stars to work on the idea Neolithic Man was living in what we now call the end of the Stone Age. And they noticed that at different times of the year the moon lay at different points in the sky. And so they started to plot these positions, after a while they noticed that there were grooves on some of the local rocks, left from earlier glaciation, that aligned with the positions of the moon at mid-winter and mid-summer.


Figure 6. Grooves in the rock near Stonehenge (Dr. Parker Pearson ibid)

This led on to marking the positions of the moon (and possibly also some of the stars as was the practice in native tribes in America). These markings were made more permanent as they were more confident of their positioning, through the use of wooden poles. (Note that there is a similar though more primitive wooden circle at Cahokia in Illinois dating at around a thousand years ago).


Figure 7. Circle of wooden poles – the UK Woodhenge (Dr. Parker Pearson)

The village grew into the town of Durrington Walls, with wooden houses, which have been recently excavated to show the yellow-painted clay floors, and the location of beds, dressers and other wooden furniture.


Figure 8. Artist’s rendition of the town of Durrington Walls (Dr. Parker Pearson)

With confidence, and as the calendar became more reliably used, so the wooden poles were replaced with a more permanent set of bluestone columns that had been brought to the site up the river Avon.


Figure 9. An early stone circle – Bluestonehenge- on the banks of the Avon. (Dr. Parker Pearson)

There is a little controversy over what happened next, but it has been suggested that around this time a new set of folk, now known as the Beaker people, because they used clay pots with a spout (beaker) moved into the region. They had one critical difference to the earlier site inhabitants, in that they worshipped the sun, rather than the moon. Thus the old calendar would not work. But up where the grooves cut into the stone, they had set four stones (the Station Stones) into the ground in a rectangle to mark the position of mid-summer and midwinter moonrise. If you rotated around the stones ninety degrees, then these poles still marked the two days, but now they did it for the sun’s positions. This could not have been a co-incidence, and so the study of calendars proceeded, but at the new site, further up the hill at the current Stonehenge.


Figure 10. Alignment of the Station Stones (Dr. Parker Pearson)

And on a passing note, as I once mentioned in Nature, and Rodney Castelden noted in “The Making of Stonehenge” the rocks were likely hauled into place with oxen, which might be why the roads are so wide).


Figure 11. Oxen hauling the stones to the site (Rodney Castleden ibid)

The first major construction at the Stonehenge site was the surrounding ditch and mound of rock (which is a relatively soft chalk that can be excavated with antler picks) with a series of small pits (some of which have been found to contain human remains) set within the ring.

There has been discussion as to whether this was a ceremonial burial ground for high-ranking individuals. In much the same way as Bruce Bourque has noted in “The Swordfish Hunters” discussing the Red Paint People of Maine, the small number of burials, relative to the size of the local population and the length of time this existed, means that this could only be a special place and rite. So though it might be where high class folk were buried (as with Westminster Abbey) it had other uses, which was to develop the calendar.

Over the years a number of different circles, with a variety of pole positions, were tried. For a while the 28 and a half stones of the Sarsen Ring had favor, but the last stone circles they put in had nineteen stones (probably taken from the Bluestone ring at the bottom of the hill). Then they stopped. They had a calendar.

Figure 12. Part of the bluestone ring of smaller stones set within the Sarsen Ring at Stonehenge. The Heel Stone can be seen further back from the main circle. (Landscape Perception)

But why nineteen? Well nineteen times nineteen is 361. Add the four days when, in the Hyperborean calendar, “time stood still”, which have come down as the Celtic feast days Samhain, Imbolc, Beltane and Lughnasadh, and you have a remarkable resemblance to the 365 days of the year. The problem was solved for a couple of thousand years.

Until, of course, those pesky Romans showed up, and made us work with months of 28, and 30 and 31 days. Herumph!!

I’ll talk about the Building of the MS&T Stonehenge next time!.