Showing posts with label North Dakota. Show all posts

Wednesday, December 31, 2014

Tech Talk - Projections 2

It is the end of another year, or more optimistically the start of a new one. Last year I was tempted to make a couple of predictions for the future. And while I can make the case that they were not too wrong, they did not include the drop in oil prices, which has now taken the price of our local gas to below $1.85 a gallon. China has, in recent months, seemed less belligerent about claiming large sections of the China Seas. Whether this has anything to do with the relative success of rigs that have drilled in those waters is something that still remains an unknown.

But it is the changing price of gasoline, itself reflective of the drop in oil prices that is the big news. WTI closed at $53.56 today, and Brent at $57.50 a barrel. Predictions include some who would suggest that the price will continue to fall, until it reaches $20 a barrel, and there it may stay for some time. Well it certainly grabs a headline, but that is about all the value that particular forecast contains. The futures prices suggest that the price has yet to bottom out, though it may be getting close to that value.


Figure 1. Crude oil futures prices (EIA TWIP)

None of the recent news suggests that there will be a further increase in supply to sustain the current imbalance between available supply and demand. Libya is descending even further into a mess, with the oil facilities at the port of Es Sider now being destroyed. The likelihood of significant increases in production and the return to export levels achieved earlier this summer seems increasingly nonexistent. Neither Russia nor Saudi Arabia are likely to increase production, although the latter are continuing to produce the increased volume that they originally put on the market to replace Libyan losses. And so this leaves Iraq and the United States as the key producers who can significantly change the current supply:demand balance in any significant way.

It is probable that, with the agreement between the Kurds and the Central Government now having generated a second payment of $500 million to the KRG that the agreement may be sustained and grow. At present the Kurds are to supply about 550 kbd, of which 300 kbd will travel through the new pipeline to Turkey and thence onto the world market. The rest will be supplied to Baghdad. Meanwhile production in the south (which gets exported through Basra) has seen some increase.

Whether the Kurdish production can increase to over 1 mbd by the end of next year remains open to some doubt, given the ongoing conflict, and the target 6 mbd by the end of the decade for the entire country will likely require changes that the current conflict, which shows no signs of ending, will inhibit.

One of my responses, when the drop in price first started, was to note that the oil supply system has a certain inertia to it. And here I am not talking about the fluctuations in price that one sees in the stock market, and in the price of the crude, but rather in the time that it takes to stop current drilling, postpone future plans and to reduce the production from existing and new developments.

Thus the drop in investment in new production, whether in Russia, Iraq or the United States takes some time to have an impact. Unfortunately for those expecting the price to continue to fall, in the face of the overabundant supply, the situation has changed since historic times, where well production was relatively stable and the oversupply situation was corrected by shutting in production (mainly by Saudi Arabia). Even then it was the perception of the response that drove price rebounds, rather than the immediate reality of the changes.

The system this time is different. The increase in production in the United States has been sustained, and over the last two years has produced more than 2 mbd more than at the start of that period.


Figure 2. US crude oil production over the past two years. (EIA TWIP)

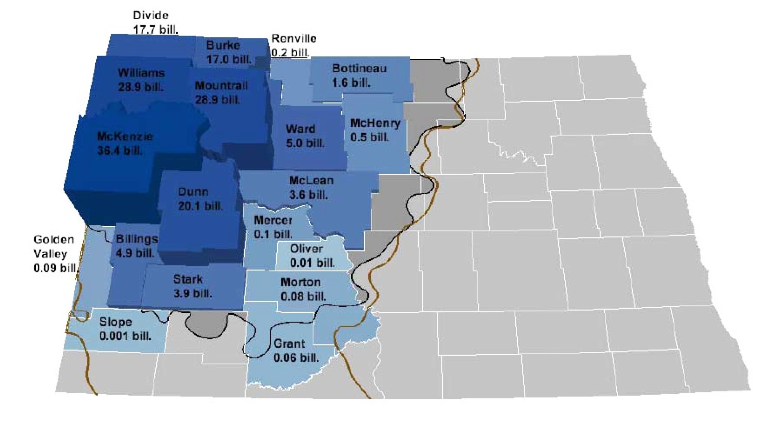
The rig count in North Dakota has already fallen to 170 rigs compared with 187 at this time last year. Concern about the oil price has led companies to cut their investment plans for next years, in some case by 20% so that the rig count is likely to continue to fall. And with the short life at high production values for most wells that will soon affect production. The North Dakota Oil and Gas Division of DMR shows the consequences of this:


Figure 3. Future production estimates from the ND DMR Oil and Gas Division.

The blue line requires about 225 rigs in continuous action, so that won’t happen. By the same token the black line is with no more drilling, and that won’t happen either. The result will be somewhere in between, probably moving the peak out beyond the current projection, but also lowering it as the existing baseline drops with less wells significantly contributing. (Bear in mind it is taking 11,892 wells to sustain current production levels.) But in the short term the line will likely dip down until the price rebounds.

The question now becomes how soon that drop in US production will become evident, and have some impact. I doubt that it will be before June of 2015.

On which note may I wish all readers a Happy, Healthy, Successful and Prosperous 2015.

Read more!

Saturday, December 13, 2014

Tech Talk - A Gentle Cough!

When I last wrote about the global supply of oil, it was back in October, as the fall in oil prices was developing. Since then the price has continued to fall, with prices now below $60 a barrel. I was doubtful back then that the price would fall as far as it has, and remain cynical that it will remain down for very long. Since this seems to go against much current wisdom, let me explain why I remain pessimistic that the boost to the global economy from access to cheaper fuel will continue for any great length of time.

It depends on whose data you believe credible as to how much more oil is available than that currently in demand. When looking at the numbers in the past I used a number of roughly 1 mbd, but this is hard to realistically quantify. Why – well the problem comes with the regions of the Middle East and North Africa (MENA) where there are current conflicts. The ones of particular concern are Libya and Iraq, although the fluctuating state of exports from Iran cannot be neglected. When the Libyan conflict first impacted the export of oil from that country Saudi Arabia began increasing its production to offset the loss in Libyan exports.

There came a time in September when Libyan exports, which had fallen to around 300 kbd from a high of over 1.6 mbd, shot back up to around 900 kbd. The EIA has recently shown an inverse correlation between Libyan production and oil price:


Figure 1. Brent Oil Price and Libyan oil production (EIA )

Thus, when an additional 600 kbd suddenly appeared back in the marketplace, it is not surprising that it had an impact on prices. However while there was already some surplus in the market (from increased production in the US etc, as I will comment on below) the volume of the addition had a more significant impact on prices, and when KSA decided not to reduce production this led the market to assume that we had returned to plentiful sufficiency, and prices have continued to fall since.

However, this perception is already unraveling. Libyan conflict has continued to embroil their oil fields. The Sharara field, which produces 300 kbd closed in November as conflict overwhelmed it. At the moment two of the oil export terminals are threatened, and with them another 300 kbd of oil. But it is not possible, at this point, to predict what is going to happen in either location. There is little sign that the conflict is any closer to resolution, meaning the production will continue to be threatened into the foreseeable future. Sadly it it more likely that this will have negative impact on oil production, so that it might be wiser to assume lower rather than higher volumes coming from the country.

The situation is a little clearer and more optimistic in Iraq, where the pipeline through Kurdish territory has lessened the impact of the Islamic State take-over of a large swath of the country. The recent agreement between the Iraqi Federal Government (IFG) and the Kurdistan Regional Government (KRG) approved early this month is already raising questions over the volumes that the KRG will put onto the market. The agreement calls for sales of around 550 kbd, but there is an additional 100 kbd that is available, the status of which is unclear. The country is exporting, overall, around 2.51 mbd and the pipeline to Turkey is currently carrying 280 kbd, but is being boosted to carry 400 kbd, with an ultimate throughput of 700 kbd. Part of the problem in assessing the market for this, however, in the short term is that the Iraqi crude is often heavier and of relatively lower quality than the market average. This is currently causing some marketing problems, leading the IFG to lower prices in order to find a market. In neither case, however, is the current conflict likely to impact the production for export, and while it is difficult to anticipate much production above 3.5 mbd. (The December OPEC MOMR suggests that they are producing 3.36 mbd at the moment) we are unlikely to se any significant reduction in production going forward. The significant growth in global production to meet a still predicted rise in demand next year (albeit down slightly from previous estimates) will, therefore, not come from OPEC, who still anticipate that they will produce, on average 400 kbd less than they have this year. It is still expected that American production will continue to rise to meet expectations of increased global demand.

The problem, unfortunately, with that view, is that increases in US production are tied to output from fracked horizontal wells that are expensive to drill, and have a relatively short production life, with the majority of production coming in the first year of operation. Thus, in order to sustain production, more wells must be drilled each month to cover the loss in production from existing operations. The North Dakota Department of Mineral Resources projects that 225 or more drilling rigs are needed to sustain the growth of production from the state over the next three years (at which time it will plateau at around 1.5 mbd). Presently there are roughly 180 rigs operating, with the count falling by the week, as the rewards, at present, do not match the cost. The agency anticipates that the number will fall by an additional 40-50 rigs by the middle of next year. Well completions are also falling by the month, as the industry likely plans to wait out the current hiatus in prices. The impact of this on even short term production should not be discounted. There has already been a slight fall in production, rather than a gain, in October, and that will likely accelerate.

Without any gain in production, and in fact seeing the potential for a drop in US production over the next year, then the anticipated surplus between oil supply and demand will likely disappear. Remember that the MENA nations are seeing a growth in their internal demand for oil (in the KSA this has already passed 3 mbd) so that if they had no impetus to reduce production and exports in the face of falling prices, so they are unlikely to increase production when prices pick up. (They haven’t before).

When will this all happen? Well I got the size of the price fall wrong, so don’t hold me to the exact timing, but I would anticipate that when we see the start of the driving season next year, the oil market will tighten rather quickly. Following that (given the inertia in getting production back in the US) we will (as I have been expecting for a couple of years) see the global concern over supply start to be a significant factor in 2016.

Have a Happy Holiday!

Read more!

Wednesday, April 16, 2014

Tech Talk - Of production stability, peaks and the future

Jeffrey Brown (Westexas from TOD) is quoted extensively in Kurt Cobb’s recent piece that points out that global crude production has pretty reasonably stayed constant at between 64 and 67 mbd since 2005. (H/t Nate Hagens). While there has been a total increase in the total refined products side of the house (with the total number floating around 90 mbd) this includes a number of different sources that, within generally defined standards, are not considered crude. The four main culprits that he lists are biofuels, natural gas plant liquids (NGLs), lease condensate and refinery gains. He makes a good point.


Figure 1. Crude oil production alone over the past decade (Kurt Cobb)

I can remember that it was some years ago, when looking at the OPEC reports on production, that I suddenly realized that the projected increases in NGL production made a significant difference in the overall volumes that they were producing. (It is anticipated to average 5.95 mbd in 2014). Back in 2001 OPEC just defined the fluid as natural gas liquids, but went through significant revisions of numbers in 2002 and in March 2004 redefined the volume counted as “OPEC natural gas liquids and non-conventional oils”.


Figure 2. NGL and unconventional oil production by OPEC (OPEC MOMR )

Over the past decade volumes have almost doubled. In the United States, with the increased development of the shale gases, production has also increased.


Figure 3. Increase in production of NGL in the United States (EIA )

The price obtained for these fluids, however, falls below that of conventional gasoline. For example:


Figure 4. Relative prices of NGL fuels relative to crude and gasoline. (EIA)

The EIA is reporting a continued growth in US production:
Altogether, in the Bakken, Niobrara, Permian, and Eagle Ford, oil production is expected to increase by 70,000 bbl/d in May 2014. The monthly growth rate is 3,000 bbl/d more than in April 2014 due to solid gains in Permian rig count and continuous rig productivity gains across the regions. While the DPR does not forecast weather impact, the spring thaw season has officially started in the Bakken region and may disrupt some drilling activity between now and June.
These additional resources take on an increasing importance as world demand is anticipated to increase another 1.14 mbd this year, slightly up on this year’s figure. This gain in demand was largely offset by increased production from the Americas, though OPEC note that overall global suppliy decreased last month to average 90.63 mbd but is expected to reach peak demand in the fall, at 92.24 mbd.

Looking at the supply side for this year, and bearing in mind that gains must more than offset lost production if the total increase in supply OPEC are projecting an overall gain in supply of 1.34 mbd, largely to come from outside of OPEC. This is expected to come from the OECD Americas (the USA, Canada and Mexico) group, while the increased production from countries such as those of the Former Soviet Union is expected, to rise by 150 kbd or less.

There has been relatively little change in the estimates of where the increases in North American production are anticipated to come. By the end of the year US production is expected to reach 12.45 mbd by the last quarter of the year. As OPEC noted:
Based on the US Energy Information Administration (EIA)’s monthly oil production report for January, regular crude oil output registered at 4.93 mb/d, tight oil production increased to 3 mb/d, NGLs output reached 2.64 mb/d and biofuels and other non- conventional oils recorded the highest output at 1.22 mb/d. The use of energy from biomass resources in the United States grew by more than 60% over the decade between 2002 and 2013 — primarily through increased use of biofuels like ethanol and biodiesel which are produced from biomass. According to the EIA, biomass accounted for about half of all renewable energy consumed in 2013 and 5% of total US energy consumed.
This month the OPEC MOMR focused on increased production from the Gulf of Mexico, with anticipated gains from the Olympus project at Mars B.

The total gain in production from the Gulf is currently anticipated to increase, this year alone, to perhaps 1.55 mbd, and to pass the previous record Gulf production of 1.8 mbd by 2016. In addition the Cardamom project is expected to add 50 kbd to the Olympus figure, and the start of oil production from Phase 3 of the Na Kika field is expected to add an additional 40 kbd to the 130 kbd which Na Kika is currently producing. However Gulf wells have a habit of going south a little earlier than predicted and I have borrowed the following graph from Ron Patterson which illustrates the cumulative fate of the combined Atlantis, Thunder Horse, Tahiti and Blind Faith fields.


Figure 5. Changes in production from major Gulf of Mexico fields over time (Ron Patterson )

When this is combined with Dennis Coyle’s prediction that the Eagle Ford field will peak in 2015, at 1.4 mbd, with a declining rate of production increase as one reaches that peak. Similarly the number of wells that can continue to be drilled in North Dakota in the sweeter counties of the state are limited, and beyond that there is a concern (which I have expressed before, and which others have explained much better than I) that as the estimates of production fall in the less successful regions of the state that it will become harder to raise the capital for the new wells needed to sustain and increase production.

That being said, I am beginning to suspect that this may be the year that the OPEC estimates for US production may get a bit ahead of what actually is produced. And if that is the case, then that means that the following two years will become even more interesting as the nations of the world start to realize that yes, there is a peak. Which might mean that the coal resurrection might be greater than I currently anticipate, but perhaps I will have more on that next time.

Read more!

Monday, January 20, 2014

Tech Talk - Production, Profit and Projection

As we move steadily through the first month of this new year, US production of crude has continued to increase, with the EIA now showing levels of around 8.2 mbd production.


Figure 1. US Domestic Crude production through the end of 2013 (EIA TWIP)

Finished gasoline production has been floating around a level of 9.2 mbd.


Figure 2. U.S. Finished gasoline production at the end of 2013. (EIA TWIP)

At the same time ethanol production continues at around 0.9 mbd.


Figure 3. U.S. Ethanol production at the end of 2013 (EIA TWIP)

US gasoline demand, on the other hand, has fallen below 9 mbd, in the normal seasonal decline during the winter months.


Figure 4. US gasoline demand at the end of 2013. (EIA TWIP)

In the latest Director’s Cut of the news from the North Dakota Department of Mineral Resources the state reports that production averaged 973 kbd in November, up from 945 kbd in October). The rig count is running around 190 rigs (below the all time high of 218 – roughly 18-months ago) and the agency notes that companies are moving toward a higher density for horizontal wells as a means of enhancing oil recovery. They estimate that at the current rig count there will be enough work under this program to sustain the industry for more than 20-years. However production will decline as the richer spots are drained, and in the most favorable scenario production will rise for another 2 to 3 years before stabilizing and then declining. At present the rate of growth in production is in the range of 300 kbd per year.


Figure 5. North Dakota Oil Production – historical and projected (ND Dept of Mineral Resources )

This is roughly similar to the growth in production from the Eagle Ford Shale in Texas over the past year.


Figure 6. Changes in production from the Eagle Ford Shale in Texas (Texas Railroad Commission )

Growth in production from the deep waters of the Gulf are likely to be closer to 50 kbd. Even combined, and recognizing that there may be some additional production from developing shale prospects, it is difficult, as the above three regions hit production peaks in the near future, to anticipate that US production will increase by the 2 mbd that is projected by some forecasts.

Some of this doubt comes from North Dakota agency itself, which has some concerns over the continued ability of the industry to attract drilling capital, as well as the impact of additional regulations. This limit of available funds is something that Gail Tverberg has pointed out in a recent post. Shell is only one of the major companies recognizing that the increasing costs of development in more difficult parts of the world are not being offset by compensating increases in production, price and profit. As operations around the world continue to attest, (offshore Brazil being but one example) just because the money is invested does not mean that production will of a certainty arrive on the original date forecast, nor will it be at the original price estimated. In the case of Brazil, while new fields show the promise for the future with a steady increase in the reserves that the country projects, this has yet to be reflected in increased production.


Figure 7. Growth in projected reserves offshore Brazil over the past 30 years (Offshore )

The problems of development are being blamed on a lack of available drilling rigs as well as budget constraints. This may be a considerably simplified version of the realities which are likely to continue to see delays in production against target figures into the medium term future. This is unfortunate since there remain few places where global production can be expected to increase in the near future.

In the latest Monthly Oil Market Report (MOMR) OPEC notes that non-OPEC supply growth is anticipated to be 1.2 mbd this year, with the bulk of that growth coming from the United States, Canada, Brazil and the two Sudans. Oil production from the Canadian oil sands is anticipated to reach 3 mbd by 2015 on its way to a total production estimate of around 6 mbd by 2035, at an approximate growth rate of 100 kbd per year.


Figure 8. Anticipated growth in Canadian oil production (NEB )

Perhaps more than most the Canadian growth is likely to follow the projected path, although there, as in other parts of the world, the need to ensure future capital for the increasingly expensive operations, and the provision of sufficient infrastructure to handle the increased production are matters that will continue to provide caveats to the overall levels achieved.

And as regards the increase in production from Sudan and South Sudan, certainly the conditions in South Sudan are not encouraging to hopes for increased production at any time in the near future. Fighting in the regional capital of Malakal shows the increasingly tribal nature of the conflict and this may well indicate that fighting will not easily be stopped and order (let alone oil flow) restored. This is of concern to China, which imported some 14 million barrels of oil from the region in 2013 but is now faced with the problems of sustained investment in the face of lost production and facilities after seeing a similar collapse in production from Libya. And while these problems are considered relatively small at the moment, at this time when global production and supply are relatively closely tied, the continuation of problems will mean the China must look elsewhere for that production, with consequent impacts on overall prices.

The problem, as the very short list from OPEC illustrates, is that there are not that many places around the world where increased production is likely and where China can invest to achieve the levels that it anticipates that it will need as demand continues to grow. And as the market becomes more competitive, so prices are unlikely to decline much (apart from regional short term issues such as the recent desire in the US to produce more diesel from refineries). Yet while this will give some reassurance to those seeking to invest capital in the industry it comes at a time where there remain concerns over regulation in some countries, and conflicts in others both of which cause investors to hesitate in their commitment. The problem is that there aren’t that many alternative strategies that hold much hope for working.

Read more!

Sunday, August 18, 2013

Tech Talk - Where to look for more oil this year.

The news that Saudi Arabia is planning to employ 200 drilling rigs next year (up from 20 back in 2005) suggests that there is a recognition that future reserves may not measure up to the planned volumes needed. Plans now include exploration of the shale deposits in the country, looking primarily for natural gas. There are estimates that this resource could run as high as 600 trillion cubic ft. Current plans are to drill seven exploratory wells in the Red Sea, off Tabuk.


Figure 1. Location of Tabuk in the Kingdom of Saudi Arabia (WikiMedia )

This is across the country from the major oil fields currently in use, which lie more along the Persian Gulf coast, centered perhaps around Damman. It therefore suggests that they are looking for extensions of the Israeli and Egyptian fields into northern KSA. (Minister Al-Naimi said that they still “had to find them.”)

In discussing the venture Saudi Minister of Petroleum and Mineral Resources Ali Al-Naimi also noted that, choosing to look for – and presumably finding - natural gas, would take the pressure off the country to maintain its oil reserve.
Al-Naimi said that prospects for global production of shale gas and oil – including in China, Ukraine, Poland and Saudi Arabia – were so promising that the Kingdom might not need to continue with its decades-long policy of maintaining an oil-output cushion for use in global supply disruptions.
“It is not a question whether Saudi Arabia has spare (oil) capacity. It is a question of whether we need to spend billions maintaining it at all,” Al-Naimi said.


Now over the years KSA has lowered the volume it has projected that it can produce from 12.5 mbd to 12 mbd, and this is, perhaps, an early indication that they intend (whether by policy or natural reserve availability) to lower that maximum further.

This has to be of at least a little concern, since the number of places with significant flexibility to increase production are getting closer to zero every year. The gains in global production that are foreseen by OPEC in the next year, for example come in dribs and drabs.

OPEC notes that in May the 8,915 producing wells in North Dakota collectively produced over 800 kbd. (The Department of Mineral Resources reports 821 kbd in June, over the 811 kbd in May with well numbers of 8,932 in May and 9,071 in June. Production per well is thus running an average of 90 barrels a day, with a well cost of $9 million.) There are 187 rigs plus/minus working and this is still enough to keep production rising at a rate of 1.3% per month. One of the maps I find interesting is this, from the Department.


Figure 3. Location and production values for wells in North Dakota (Department of Mineral Resources )

It is this illustration of the relatively heavy drilling already in the “sweet spots” and the poorer performance in the less well drilled regions that gives me concern for the longer term prospects for the formations. And as an aside note that crude from Alaska is declining, July output was 498 kbd against the year-to-date average of 542 kbd. The EIA is noting that, since there aren’t any major oil pipelines running into California from the East, that there is an increase in rail traffic to make up the difference. The EIA is suggesting that the traffic is already at a level of around 100 kbd.

And this in happening in the most promising region to increase production (though it includes Canada, for which OPEC projects a growth over the year of around 40 kbd, which is set against Mexican production, for which OPEC sees a decline of around 60 kbd).

Malaysia is projected to increase production by 50 kbd, from the Gumusut field. This is a Deepwater project, and one can get some estimate of the shape of the field from the well pattern. The production gain is viewed by OPEC as likely being the highest in the region.


Figure 4. Planned Well pattern for the GUMUSUT KAKAP project in Malaysia (Rawingbadi)

In Latin America Colombia is expected to increase production by 80 kbd, though the country is having some issues with pipe damage from terrorism. There have been more than 30 attacks this year. OPEC also looks for an increase in Brazilian production of 10 kbd over the year, this gain coming after some 14 months of decline, which drop hopefully will be recovered before the end of the year.

Oman will grow production by 20 kbd, but it is in Sudan and Southern Sudan that OPEC anticipates the greatest growth, of 90 kbd. However the two countries are not the best of friends, with oil from Southern Sudan having to ship by pipeline to Sudan, for shipment onwards. At present oil, at an average rate of 75 kbd is continuing to flow up the pipe, but Sudan continues to threaten to halt shipments, leading Southern Sudan, in turn, to plan to shut-in the wells. The OPEC projection seems to be best defined therefore as “iffy.”

OPEC expect Russia to increase production by 80 kbd in 2013, yet there is some caution in that estimate, with other numbers suggesting that Russia is reaching a modern peak in production. Kazakhstan is projected to increase production by 50 kbd (coming from the startup of Kashagan, now expected at the end of September). The 100 kbd production will more than offset declines in the rest of the country. And China may increase production over the year by 60 kbd.

I have listed the countries that OPEC anticipates will grow production by more than 10 kbd, and have not listed the many countries that will see production decline by more than that amount. It is remarkable that listing the increases in production outside of OPEC can be done with just a few paragraphs. And it is a little disturbing that the threats to pipeline security throw questions over the reliability of some of the numbers. And yet this only addresses the possible growth in production, declining producers would require a much longer list. Combined it becomes a little more difficult, as turmoil in MENA continues to grow, to remain optimistic over the OPEC projections.

Read more!

Thursday, February 7, 2013

OGPSS - Future Bakken production and hydrofracking

Before there were refrigerators folks kept drinks cool by putting them into clay jars that had been soaked in water. The evaporation of the water from the clay cooled the container and its contents, which today includes wine bottles. On the other hand, for many years artisans have taken clay in a slightly different form, shaped it and baked it and provided the teacups which keep the liquid inside until we drink it.

Two different forms of the same basic geological material, with two different behaviors and uses. Why bring this up? Well there is a growing series of articles which continue to laud the volumes of oil and natural gas that the world can expect from the artificial fracturing of the layers of shale in which these hydrocarbons have been trapped for the past few million years. It has been suggested that there is no difference between this “unconventional” oil and the “conventional” oil that has been produced over the past century to power the global economy. And yet, despite the scientific detail which some of these critics discuss other issues, they seem unable to grasp the relatively simple geologic and temporal facts that make the reserves in such locations as the Marcellus Shale of Pennsylvania and the Bakken of North Dakota both unconventional and temporally transient. Let me therefore try again to explain why, despite the fact that the oil itself may be relatively similar, the recovery and economics of that oil are quite different from those involved in extracting conventional deposits.

But, before getting to that, let’s first look at the current situation in North Dakota, using the information from the Department of Mineral Resources (DMR). According to the January Director’s Cut the rig count in the state has varied from 188 in October, through 186 in November, and 184 in December, to 181 at the time of the report. Why is this number important? Well, as I will explain in more detail later, the decline rate of an individual well in the region is very high, and thus the industry has to continue to drill wells at a rapid rate, just to replace the decline. (This is the “Red Queen” scenario that Rune Likvern has explained so well.) The DMR recognize this by showing the effect of several different scenarios as the number of rigs changes.

For example they project that 170 rigs will be able to drill around 2,000 wells a year. At that level, and with some assumptions about the productivity of individual wells that I am not going to address here, but which Rune discussed. I would, however, suggest that it is irrational to expect that new wells will continue to sustain existing first year levels as the wells move away from formation sweet spots. Yet, accepting their assumptions for now, DMR project that the 170 rigs will generate the following production from the state:


Figure 1. Achieved and projected North Dakota production when 170 rigs are used to continue to develop the field into the foreseeable future. (ND DMR).

The DMR plot also assumes that the wells are developed and brought into production in a timely manner. In October the state produced an average of 749 kbd of oil, which was through mid-January the current peak level of production. Currently it is estimated to cost $2 million to frack a well, and in January there were 410 wells waiting on that service.

In order to reach a higher level of production (and bear in mind that OPEC has been projecting significant further increases in production to make their anticipated supply and demand levels balance) the DMR looked at estimates of production if there were 225-250 rigs, and contrasted that with what would happen if the rig count fell almost immediately to 60.

Figure 2. North Dakota oil production with either 225-250 rigs, or with 60. (ND DMR)

Note that at 60 rigs the state production goes into an immediate decline. Somewhere in between those two extremes lies the likely future, but with the Director noting a December price of $77.09 that future may be at the lower, rather than higher end of the scale. (Though in January it popped back up to $87.25).

To illustrate the sensitivity of these numbers consider that if the rig count fell from 170 to 100, then production would decline to 800 kbd but would still fall into decline in 2020, while at 200 rigs the production would rise to a peak of 1 mbd, although the peak interval might only be four years from the 2,400 new wells added each year.

The ferocity of the decline rates of these wells is part of the reason that they are called unconventional, since they do not behave in the same manner as a conventional well, nor can they be developed in a similar way.

To return to the geology of the deposits (and shale is a consolidated clay) the middle Bakken formation is made up of a combination of layers of shale, sandstone, siltstone and limestone. These are, in general, rocks that have a very low permeability, and that property was explained in more detail in an earlier post. Simplistically it is a measure of how easy it is for fluid to flow through the rock, and for most of the Bakken rock it is not easy at all. If it were then there would be no need to put in the crack paths that the oil uses to reach the well. Let me repeat a figure from that post:


Figure 3. Block of sandstone with a crack in it (shown by the arrows).

I have been on a site where my hosts (a federal agency) had injected fluid that they were hoping would penetrate a layer of ground so that it would form an impermeable barrier. It had not, even though the ground was relatively easy for the fluid to penetrate. Instead it had all flowed into a crack no bigger than the one shown in the picture above, and the attempt was a failure.

Put that into reverse where you are trying to pull fluid out of the ground. There are two places where the fluid (oil or gas) is located, in the natural cracks and joints of the rock – which the hydrofrack is designed to cut across. And in the much lower permeability of the blocks of rock that are edged by these fractures, bedding planes and joints.


Figure 4. Representation of a horizontal well drilled in the Marcellus, shown against the natural fracture pattern (Source AAPG )

Over the millennia the oil/gas has migrated to those bedding planes and natural joints and fractures in the rock. When the well is first put in place it is that fluid that is more easily available to flow through the intersecting crack pattern to the well. But as those interstices empty out it is much more difficult to move the oil from the rock surrounding the natural cracks into that crack and thence to the well.

Most illustrations of hydraulic fracturing show a network of artificially induced cracks getting more numerous as they move away from the well. That, actually, is not the way it normally happens. The majority of the cracks that open are already there, and these are much easier to develop – as my unfortunate hosts learned – that it is to try and generate a multiplicity of new fractures, as I have previously explained here and here. The production, to go back to my initial metaphor, begins to move, over that first year of production, and dramatic fall in yield, from relying on the permeability of the wine cooler part of the rock, to that of the teacup.

Read more!

Thursday, August 11, 2011

OGPSS - North Dakota and the Bakken shale

Nick has pointed out that the chart I used last time, in writing of the production in the deep waters of the Gulf is out of date. North Dakota is heading for second place behind Texas, having passed Oklahoma, and has the ability to pass Alaska in a few years. In May the state was averaging a production of 361 kbd of oil, and 361 bcf of natural gas, from a total of 5,570 wells (all three figures being all-time highs). Gas flaring, at the moment, is at around 29%. The current rig count is at 183 and also an all-time high. So where is all the excitement? It is not in shallow gas given that, as the Director of the Department of Mineral Resources has noted::
North Dakota Shallow gas exploration is not economic at the current price.
The answer lies in the Bakken and Three Forks with rigs that can drill more than 20,000 ft being the most actively employed. The Bakken has already been discussed in an earlier post at The Oil Drum and I don’t really want to repeat much of that information, and so this presentation will, perhaps, rely a little more on visuals. The Bakken and Three Forks partially lie in Western North Dakota, and the Department of Mineral Resources (DMR) for the state, has shown how the total Original Oil In Place (OOIP) estimates vary from county to county within that region.

OOIP estimates by county (North Dakota DMR)

The state has also produced some three-dimensional models of the formations in the region around Williston, which is where some of the most productive wells are found.

Region of North Dakota that is modeled. (ND DMR ) The sides of the square cover 135 miles.

By developing the model it is possible to look both at the section showing the location of the productive beds in the region. Since the Department covers other valuable minerals beside oil and gas, they are also shown in the section:

Section through the ND geology (ND DMR )

The Bakken lies at a depth of around 11,500 ft with the additional need for rigs to drill 20,000 ft coming from the use of horizontal drilling along the formation, which is typically only around 150 ft thick. One of the advantage of the model is that it can be used to generate a view of the Bakken itself, with the overlying ground removed. This also helps show that, while the above section shows the beds lying in a syncline, where oil might be expected to migrate out and up the sides away from the central dip, there is a central anticline where oil could be trapped, and the structure is not smooth. (Bear in mind also the scale of the model, so that small traps in the field are not picked up at this level. ) The structure of the shale beds themselves also make it less sensitive to geological modifications which drive oil migration, though obviously not completely or else there would be little oil flow to the well.

Model of the Bakken formation around Williston (ND DMR )

The dominant feature that runs relatively North-South through the center helps then explain the location of many wells drilling into the reservoir.

L:ocation of wells in the modeled region of North Dakota (ND DMR )

While the formations have been known for some time it was only with the development of horizontal wells, and fracking capabilities, that the opportunities to extract the oil became viable. To borrow a picture from that earlier post by Piccolo (H/t Gail)

Change in Bakken production with the introduction of horizontal wells and Fracing (TOD)

As the number of horizontal wells has grown one finds, as I noted above, that 20,000 ft of drilling will include perhaps 9,000 ft of horizontal well in the formation itself. Such a well, as for example the Credo Petroleum well that is cited, may initially produce 1,267 bd of oil and 1.24 mcf/day of natural gas.

However one of the concerns that has been expressed, both by Art Berman, and later myself, has to do with the long-term production rate from long horizontal, frac’ed wells in shale, and it is therefore instructive to see the information that is now available on a typical well, which has been compiled by the ND DMR.

Typical Bakken well production (ND DMR )

At the time of the presentation (last year) there was still a large proportion of the gas being flared.

Gas flared as a percentage in ND (ND DMR )

Since then, as I noted at the start of the piece, the amount flared in May of this year has risen to 29%.

There is a more than adequate array of pipelines to handle the fuel that is being produced, at the moment it is the oil that is the critical, and valuable component. But even with a projection that the state will see about 2,000 wells a year being drilled over the next few years, with the expectation that the field will last some 20 years, the overall production is not expected to increase much beyond the levels that it is now attaining. This is because of the relatively rapid drop in well production, for which there is now a considerable data base. That doesn’t stop some from projecting, however, that the field can increase in production to levels as high as 1 mbd or so. That would, of course, include production from Montana and Canadian parts of the Bakken, which I have not discussed here.

One point that should be noted is that the lease rates for Bakken in North Dakota are quoted as being around $7,000 to $8,000 per acre, while those in Montana are reported to be considerably less. To date there has not been that much activity in Montana, though with time this will change. Already permit numbers are rising, and there has been some success to equal that in North Dakota.
Brigham Exploration, one of the most aggressive in Montana, recently unveiled five wells there ranging from 909 boe/d to 2,962 boe/d, the latter volume a "record for the state," Pritchard said. The five wells averaged 1,579 boe/d.

At present, however, most of the rigs (170 to 10) remain on the North Dakota side of the border. That too will change, with time.

Overall the Bakken is likely to see further increases in production as the areas being drilled expand, but with the relatively short life of the well at significant levels of production, it is harder to see the higher levels of production overall that others have cited, and one also has to remember that is often the sweetest spots that get drilled first.

Read more!

Saturday, January 29, 2011

North Dakota combined temperatures

Wow! If those folk that were putting in the weather stations in Wyoming didn’t want to get too far from a decent highway, that situation is even more the case in North Dakota. It is not exactly a symmetrical spread across the state.

Location of the USHCN stations in North Dakota.

As well as the 24 USHCN stations, there are 3 GISS stations in ND, according to Chiefio, and they are at Fargo, Williston and Bismark. Which of these, I wonder, will turn out to be only from 1948? (answer below the fold).

Well Bismark has a full set of data.

Bismark ND GISS temperature record

And Fargo has a full set of data:


Well, minor surprise, we also have a full set of data for Williston. So I am wrong in North Dakota.


So having got all that information tabulated, we need to go and get the population data. Moffit was too small for citi-data, but exists in Fizber. Other than that all the populations were available, and, as has become evident in other states, the GISS stations are in the places with the largest populations relative to the USHCN stations. The average of the USHCN stations is a population of 5,313, though there are only four above 10,000. The GISS stations are in cities that average ten times that size.

Comparing the GISS average to that of the USHCN stations (using the homogenized data) the average difference is some 1.2 degrees.

Difference between the average GISS station temperature and that of the average USHCN station in N Dakota.

Looking at the overall trend of the temperature in the state, the temperature has been relatively steadily increasing since temperatures were first recorded.


Interestingly the TOBS data suggests that the rise is some 2.7 deg per century, the homogenized data suggests that the rise is only 2.4 degrees.

Time to take a look at the geographical information for the state, which is 340 miles long and 211 miles wide. It runs from 97 deg to 104 deg W, and sensibly 46 deg to 49 deg N. North Dakota has an average elevation of 579 m, with the lowest point being at 228 m, and the highest 1,068 m. The average of both the the USHCN stations is 503 m, that of the GISS stations 455 m.

So moving on to the effect of changing geography on the temperature in North Dakota:

Change in temperature in North Dakota as a function of Latitude

Change in temperature in North Dakota as a function of Longitude

As I have discussed before, this correlation is potentially an artifact of change in elevation, though when I look at this correlation for North Dakota . . . .

Change in temperature with elevation in North Dakota.

Now that is interesting – it gets warmer as the elevation rises – which is counter intuitive and counter to most of the rest of the states. And there is a reasonable correlation coefficient – most strange.

Looking at the effect of population:


With most of the stations in towns of about the same size, but scattered around the state, there is not a correlation with population for this state;

And, as with Wyoming, the difference between the homogenized and TOBS data is getting less in this state, over time. It has however been increasing since the 1970’s.


Read more!

Saturday, April 11, 2009

Carbon Credits - or Farming in North Dakota

Courtesy of Anthony Watts I am posting this story from his Web Page (Watts Up With That) today, since it relates to the ongoing Carbon Credit discussion.

Simply put the National Farmers Union Carbon Credit Program sells the “credit” that farmers in, say North Dakota, create when they carry out various different farming practices that don’t generate as much carbon dioxide. For example if you practice “no-till” farming of corn and soybeans, then you don’t, obviously, use a tractor to till and thus don’t generate as much carbon dioxide. (By leaving the untilled soil and remaining material in the soil undisturbed so that it does not emit carbon dioxide, and methane and additional carbon dioxide are not emitted - coincidentally it is usually good farming practice since it reduces soil erosion and helps hold nutrients in the soil). Thus, for example, as Bloomberg points out, a farmer who does not till 800 acres can save 470 tons of carbon (dioxide). This then becomes a credit that can be sold, and is apparently currently worth about $3,000 a year.

Thus a site that generates a large quantity of carbon can buy these “offsets” from the farmers saving carbon, and set that against their own production. The North Dakota Farmers Union of some 3,900 members, apparently shared some $9 million last year, up from $2.6 million in 2007. However, if the farmers are doing this already, and for other reasons, that does not stop them selling the credit and taking the money. Except that Anthony gives the story of one farmer that has changed his mind. It is reproduced with his permission.


I have changed my mind about participating in the carbon credit program. And have resolved to give the money I received to St Jude’s Children’s Hospital.

Here is why.

Recently I sat in the fire hall with a few dozen farmers. We had been invited to hear how we can get paid for carbon credits.
The speaker explained how their satellites can measure the carbon in our land individually and how much money we could get. Then asked for questions.

I asked “what is the source of this money”?

The presenter said it comes from big companies that pollute.

I asked “where do they get this money”? He had no answer.

So I answered for him, asking, “won’t it come from everyone who pays their power bill”? He then agreed and said “that could be”.

I then said isn’t this about the theory of man made global warming? he said “we are not going to talk about that”. Here they are on the prairie soliciting land for carbon credits tempting us with free money.

I believe that agreeing to take their money means you agree with taxing cattle gas also, because methane is a greenhouse gas 20 times more powerful than carbon. I believe taking this money without considering its source makes us no better than the bankers who lent money to people, knowing they could not pay it back. Collecting their fees then selling the bad loans in bundles to someone else. They did not care where the money came from either.

Let’s be clear.

Carbon is not a new commodity! No new wealth is being created here! Is this the way we want to make a living? Let me ask you, what if their satellites determine that your land has lost carbon? You will get a bill, not a check, right? If you make a tillage pass you will get a bill for emitting carbon, is this not correct?

It is also a fact that this income will, in short order, get built into your land cost. You will keep very little and be left with the burden of another bureaucratic program.

Let’s be honest, we feel compelled to take this money because of the need to be competitive, however we also need to hold true to our values and lead by example that means placing our principals ahead of money.

No good citizen is opposed to using the earth’s resources wisely, however, wisdom means a person who has both intelligence and humility. In my view many of the proponents of man made global warming have the first and lack the second. We are able to exercise our freedom in this country because we have abundant, reliable and affordable power. It is ironic that we sat in front of the flag in that fire hall and considered trading our liberty for money.

I’ll leave you with a quote from Roy Disney:

“Decision making becomes easier when your values are clear to you”

Read more!

Monday, March 9, 2009

P51. Pick Points

Half-a-dozen or so stories of interest:

The energy lobby is not thrilled about the latest plans to increase taxes on the industry and is now forming a group to speak up for the industry. As an alternative North Dakota is thinking about putting 25% of the oil generated income into a trust fund. While Ecuador is going after some unpaid taxes that it claims Perenco, a French oil company, owes due to the “extraordinary profits” the company has made. Michigan’s Governor is asking for a gas tax to fix the crumbling roads in the state. The intent is to shift the rate from a per gallon, to a percentage of the price. Because state and federal revenues from existing taxes are no longer enough the Congress is also looking at ways to restructure the system to raise more revenue, one of the thoughts being considered is a mileage charge. Massachusetts has a similar problem, and are considering a 25% increase in the state gas tax (which would bring in about $650 million), as is Oregon.


Ugo Bardi has his post on “Fire and Ice” up on the main TOD board, (it was on TOD Europe before) and just for the historical record, it was I (not some guy from the USGS) who disagreed with Dave Rutledge down at ASPO 2007 – which did not stop the pair of us, with a group of others, adjourning to the bar to discuss the topic thereafter.

Speaking of conferences the MIT student Energy Club just held their conference at which the Swedish company Vattenfall said that they would be carbon neutral by 2050. Sweden has previously said that it will wean itself from oil within the next fifteen years . Sweden gets most of its electricity from nuclear and from hydro, so that the major use of fossil fuels is in transportation. I should be in Sweden this weekend (there will be a slight hiatus since it is a long flight and I am going to work) so I will post on what I hear.

At the start of an Energy Conference in Qatar the Exxon CEO has used their success with Qatar (they will have doubled the LNG production to 62 million tonnes this year, leading to the establishment of fourth and fifth LNG trains). Half the vessels for the 4th train are now delivered, and 5 of the 6 for the 5th train. The LNG is coming into a market that is currently seeing (outside of South Asia) a surplus of natural gas (hence all the rig closures in the US) and the LNG entry is likely to soften the market further. However if the predictions of a drop in US well production hold up, then the LNG will be coming on market just as it would otherwise tighten. China, which currently uses 13 million tonnes of LNG , with imports from Russia and Kazakhstan, is also aiming for a target of 60 million tonnes a year by 2020, with some of that to come from Qatar. A local shortage of natural gas is also causing Saudi Arabia to fast-track the development of two off-shore gas fields.
Development of the Arabiyah and Hisbah gas fields, which are not associated with oil production, would supply around 1.8 billion cubic feet per day, MEES reported. The projects were included in Aramco's expansion plan through 2014, it said.

"Bringing these fields on line would make sense," one industry source in the kingdom told Reuters yesterday. "They really need the gas."
Success offshore has not been matched with equivalent searches for natural gas on land, and particularly in the Empty Quarter.

Utility operators in the United States continue to be concerned over the future of coal, and are scrapping even more plans for expansion, part of the problem lies in the uncertainty over future regulation. Just this past week a utility in Montana has given up on the fight with local environmentalists and will now be installing a gas-fired plant, even though the costs may be higher. There are still, however, some 28 coal-fired plants under construction. To prevent more ash dam failures, EPA is seeking the necessary information on the sites where such impoundments exist. There may be as many as 300. Idaho Power, having seen the writing on the wall, has also changed its mind, and instead of a coal-fired plant will be installing a 300 MW plant in Payette county. The site is close to an existing gas pipeline, and an existing 230-kV transmission line. Now all they need to worry about is the long-term availability of the fuel.

A small note, it appears that having not had them built for very long, China has already filled the current round of tanks for their Strategic Petroleum Reserve and is thinking of adding more storage using tankers. (Which suggests they don’t think prices will stay down much longer, either). They currently have 34 days of supply in storage., but this may not count the 100 million barrels in the reserve. China is actively chasing after oil, and trying to ensure supplies when the price is right. And there are still those who think that the floor of the market has not yet arrived and that prices can sink some more.

And Pakistan has decided to go ahead with a gas pipeline from Iran, without having Indian participation.

More stories can be found at The Energy Bulletin and Drumbeat at The Oil Drum.

Read more!