There are 49 USHCN stations in Texas, ranging from Albany to Weatherford, and they are spread not quite evenly over the state.
 Distribution of USHCN stations over Texas (USHCN )
Looking for the GISS station record for Austin I found that there are 3 different records in the GISS file the longest one, however, (1895 to 2009) is for an Austin at a different set of co-ordinates (39.5 N, 117.1 W) to the city which is the logical choice. Of course the currently used site (Austin/Robert 30.3 N 97.7 W) only has data from 1948, but then, so do the others I mentioned. Houston, for example, has four stations, but the one that GISS has chosen to keep maintaining records for has only been around since 1948. While it may be that I am more cynical than most it should be noted that, if one looks at the record for, for example, the GISS stations in Abilene and Amarillo, there are very clear higher temperature spikes in 1933 and 1934, above the most recent high temperatures.
 Abilene TX temperatures (GISS)
 Amarillo temperatures over the last century (GISS)
However if one only plots the temperatures since 1948 (as most GISS stations do) then there is no evidence that the temperatures were, in that record, higher than the recent past. For example consider the case of Lubbock as an example.
 Historic temperature record for Lubbock TX (GISS)
 Looking at the overall temperature differences between the GISS temperature average, and that of the homogenized USHCN temperatures, there is a clear trend, although heavily influenced by the changing number of stations in 1948.
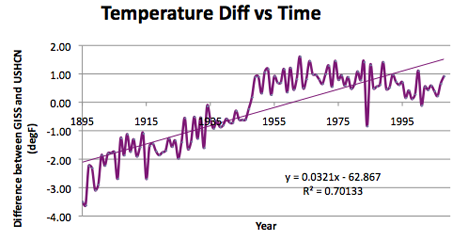 Difference between the average GISS station temperature and that of the homogenized data from the USHCN stations.
For Texas as a whole, of the average of the temperatures measured, adjusted for time of observation only (the TOBS temperatures) are used, then the state temperature appears to have declined slightly over the past 115 years.
 Average temperature in Texas from 1895.
Texas is 790 miles long and 660 miles wide, including the bit that sticks up almost to Kansas and down past parts of Mexico. Thus it extends from 93.5 deg W to 106.5 deg W, and from 25.2 degrees N to 36.5 degrees N. is the second largest state, behind only Alaska in size. The mean elevation of the state is 518 m, and it runs from sea-level up to 2,666 m (Guadalupe Park). The average USHCN station is at a height of 438 m, while the average GISS station is at a height of 375.9 m. The Center of the state by latitude is sensibly at 31.25 degrees N. (both GISS and USHCN stations center on 31.3 degrees).
Turning to the usual geographic parameters, first latitude:
 Correlation of temperature with latitude for Texas
 Temperature correlation with longitude for Texas
However as the land rises to the West, this is explained within the relation to elevation:
 Texas correlation with elevation
Using the 30-year temperature average for each station and plotting this against population, does not, for this state, give much of a correlation in this case
.
 Texas correlation of the last 30-year average temperature with population
And then there is the usual:
 Difference between the reported USHCN homogenized data for Texas and the raw data corrected for time of observation (TOBS).
Sorry this is a little rushed today but a little excitement in the hotel with a fire alarm bringing us all down to the lobby and slowing things related to leaving. Nothing relative to the disasters of the rest of the world, but taking time.


This comment has been removed by a blog administrator.
ReplyDeleteThis comment has been removed by a blog administrator.
ReplyDeleteThis comment has been removed by a blog administrator.
ReplyDeleteThis comment has been removed by a blog administrator.
ReplyDeleteThis comment has been removed by a blog administrator.
ReplyDeleteThe content is awesome that should be appreciated all around the globe.
ReplyDeletemarathitracks
Majhi Baay Go Lyrics