Sunday, October 18, 2009

Drilling Deviated oil wells and a couple of legal terms

This is part of the ongoing series of posts I make on Sundays about the technology behind some aspects of getting oil, natural gas and coal out of the ground. At the moment, as I noted recently, there are places where it costs more to get the fuel out of the ground, than folk are being paid for it, yet they are still pumping it out. There are a number of reasons for this, but I wanted to tie in a comment that goes back to the early days of oil production, when one could find pictures of oil derricks, built one right next to another. That density has been reproduced at Kilgore, TX where at one time they had 1,100 wells producing oil from the Great East Texas Oil field.

Reproduction of well density (from TexasEscapes )

When times got tough each well owner would still produce all the oil possible, why? (Apart, that is from paying the interest on all the money borrowed to drill the well in the first place).

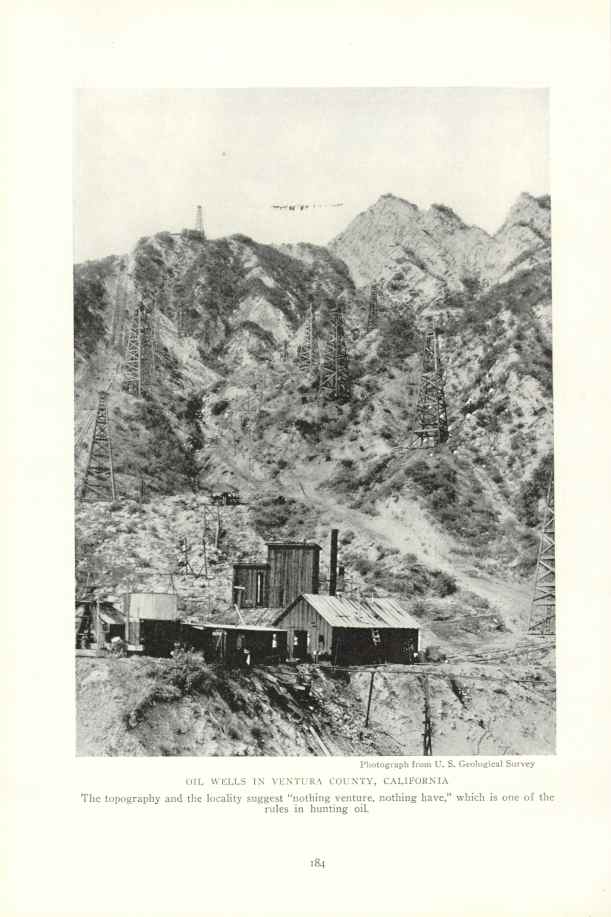
Wells drilled in Ventura County, CA. (US Geological Survey)

Early photos of the oilwells when the first boom first began, showed that they were drilled almost on top of one another and in some difficult country.

There was an interesting ruling that came about at that time, and which has persisted since. It is called "The rule of capture" (which also pertains to water rights, and essentially it says that whatever flows into your oilwell, regardless of where it came from, is yours. (`cos you "captured" it).


So let's say that you live in a nice neighborhood in downtown San Diego, for instance. And under your neighborhood someone discovers there is a rich pool of oil. Well if your next door neighbor is a fast mover, he might drill his well and suck all the oil out of your particular bit of that pool, before you can blink, and yup! It's his (or hers).

So what do you do to counter this and get what's yours before it is half-inched? The obvious answer is to drill your own well, and (rather like two siblings drinking a soda through straws into the same glass) whoever sucks hardest gets the most. Which does all sorts of nasty things to the idea of holding a resource until it's value goes up - but then, that's the oil and gas business.

Well over the last century that obsessive attitude has ameliorated a tad, and now when wells are drilled (particularly since they are a bit more expensive) we try and space them at intervals so that each gets to drain out to the point where it naturally runs out of ability to drain further. There are intricate mathematical equations for this (which I long ago deliberately forgot) but as a first rule of thumb the industry uses a baseline of 40 acres per well. Which means that if you were looking to drill a second well you might step out and drill the next well some 440 yds away from the first. (A quarter of a mile, for those of us who think that way).

Which way would you go? Well that depends very much on the information that you managed to get from the well that you just put in. And this will rely on logs that you ran after drilling, and the map that you were given of the underground geology before you drilled the first well. Some of that information will relate to the permeability of the rock, and the quality of the oil. The lighter the oil and the higher the permeability then the further apart you may want to space the wells (given that they are becoming just a tad expensive these days). Generally in more favorable fields you may space at greater intervals (gas wells tend to be about a mile apart for example).

On the other hand, in some cases, having drilled a very well spaced set of wells you may discover that the permeability isn't quite as good as you had thought, and then you might go in and put wells at closer intervals than originally drilled, infilling the well pattern.

But there are places where this is not an easy option. One such, of course, is the current spate of discoveries and development in Deep Water. But one of the earlier places where this came about was in Western Siberia. After all, here you are, finally established on a man-made island in the marsh, and producing oil, and to drill the next well you have to drive another road through the swamp, build an island, move the equipment, recreate the drill site, before you can start drilling. As Ivan Ivanovich might have said, "why don't you be a good Comrade and let me drill over to my patch, from your site?"

And thus we get into directional drilling (and the entirely "accidental" occasional happening of "subsurface trespass". Directional drilling as a term is quite often used now to refer to techniques for putting pipes under rivers.

Historically wells were drilled, to as great a degree as possible, vertically downwards. There was the occasional meander, and this had to be corrected, after running a borehole survey, to make sure that the drill eventually arrived at the intended target. But in making those corrections, so a technology evolved that allowed wells to be steered at deliberate angles, and then the light dawned, and deviated wells could be steered away, at designated angles from the initial well, and out to some additional nearby possible sources.

When directional drilling first was developed, the process occurred in a series of steps. Remember that the wells are usually cased with a steel liner. So the first thing that had to be done was to cut a window in that casing. There are several ways to do this, one of the more efficient of which is to use a high-pressure stream of mud from a jet nozzle, that has had a certain amount of sand added to the mud. This abrasive jet can eat through the steel and cut out a segment or window so that the drill bit can reach and attack the rock.

5,000 psi pressurized abrasive waterjet cut through steel, concrete and rock, as could be used to cut a window in a casing

Now we have to make the drill deflect, and the easy way to do this was to slide a wedge into the hole right at the point where the window had been cut. This wedge, known as a whipstock was very carefully aligned and set into the borehole with the inclined side set so that as a new drilling bit slid down the hole it would be kicked off into the window, and began to drill and penetrate the rock in the required direction.

The hole could be started with a smaller bit until the hole is well established (maybe several feet into the new well) and then this pilot bit was removed and a full-scale bit put on the bit to allow the drill to continue creating a new hole moving out from, and down from, the new start to reach the new target either by a straight shot, or by drilling over to the vicinity of the new end point, and then kicking back over to the vertical to drill down into the new oil reservoir. The process is not that complicated, and with practice one could then drill a number of different wells out in different directions from that original hole. And from one location, or platform, one can then collectively extract the oil from an increasingly large surrounding area of the reservoir.

More recently there are services available such as the Autotrak system where, just behind the drill bit (which is rotating – as are the main pipe segments – yellow in the picture below) a non-rotating piece of equipment is located (blue) that has three small rams that can push out against the well bore and direct the drilling head over in the direction required.

Autotrak assembly (Oil Museum in Stavanger) – you can see one of the pads pushed out as though it was pushing the head over.

And thus it is now possible, through computer sensing of the position of the head, and control of the rams, to steer the drilling head to where you want it to go.

I said "historically" just before talking about Autotrak because when they tried the older system in Western Siberia they ran into a problem. The quality of Soviet steel was not, at that time, that good at keeping the bit turning down and through the bend it had to follow to deviate the well. And so they had to come up with a different approach. And that I’ll leave perhaps for next week's chapter.

This is a series of highly informal posts that are aimed at giving some background to what goes into drilling and production from oilwells. To keep them simple and short I have sometimes simplified a little more than I should to make the description clear, so if it isn’t, please ask.

Read more!

Tuesday, October 13, 2009

An interesting, and worrying talk at ASPO

Unfortunately I have had to miss the ASPO Meeting in Denver this week, and so cannot provide the daily reports that I have written in the past. But I notice that at least one of the talks has already caught a significant amount of press, and that is the one by Arthur Berman on the gas production from shale deposits such as the Barnett, Haynesville and Marcellus.

There has been a considerable hype in the press about the value of the gas from these shales, and the ability that they provide to bring in an “Age of Natural Gas”. Commenting on the situation last year, the CEO of Chesapeake noted
"the U.S. today consumes about 63 billion cubic feet of natural gas per day - in energy BTU equivalency terms, that’s 10.5 million barrels of oil per day, or about half of the amount of oil that the U.S. consumes each day. Of that 63 bcf per day of natural gas consumption, we import about 1 bcf in the form of liquefied natural gas, or LNG, and we import about 8 bcf per day from Canada. This means that we are about 98.5% self-reliant on natural gas supply from North America and about 86% self-reliant on natural gas supply from the U.S. Contrast that with oil, where we are only about 41% North American self-reliant and only about 27% self-reliant from U.S. sources."
This picture of a large supply of natural gas has been strengthened by the increase in production from a number of the gas shale fields, at the same time that the recession hit, and as a result there has been more gas available than needed, and the price has dropped considerably as a result. This, in turn, has led to a considerable reduction in the number of rigs that have been drilling new wells.

Natural gas has been steadily increasing its share of electricity generation, rising to over 20% of the market, on its way to 25%. Natural gas is favored because of its reduced carbon footprint over coal, and it has historically been used since it is somewhat easier to start and stop gas turbines than it is coal-fired power. Thus natural gas is seen as a favored backup to the installation of wind farms, where the vagaries of the wind are backed by the ability to use natural gas when needed.

There are, however, considerable concerns about the ability of wells in the gas shale to produce to the targets that are being set up. I first noted Arthur Berman’s concern about this back in 2007 when I drew attention to a piece he had written in World Oil, where he noted the short life of most of the gas-producing wells; the very high costs for the wells and technology required to create them and, as a result, that only 28% of them return a reasonable profit. (Unfortunately the article itself is now behind a paywall).

Since then I returned to the topic at Bit Tooth showing, among other data, the very high decline rate (now 60%) of many of the gas wells in Texas (where the Barnett shale is) that Swindell has reported.

First year decline rates of Texas natural gas wells (after Swindell)

There is further disquieting news that is now coming out of the Barnett field. The Ft Worth Weekly has just reported that many of those who expected to make substantial amounts of bonus money from drilling companies using their leases have had the agreements withdrawn and lost their money.
In April 2008, the Southeast Arlington Communities of Texas (SEACTX) negotiated a deal with XTO Energy that would bring in bonus money of $26,517 per acre and a royalty rate of 26.5 percent - among the highest in the Barnett Shale play. When leaders of SEACTX, representing about 7,000 property owners with about 5,000 acres, did the math, they figured that more than $100 million in upfront bonuses would be coming into their community of mostly modest to middle-class neighborhoods. . . . . . . . . . Well, that was then and this is now, when natural gas prices have fallen to less than half what they were in early 2008. And as anyone who has been following the Barnett Shale saga knows, drilling companies pulled out of those deals and others in mid-October of last year. Some property owners, whose bonus checks were processed prior to the cancellation, got paid. Tolli Thomas, a spokeswoman for SWFA, estimated that 4,000 to 5,000 people in her area got the money promised to them - and the other 20,000 or so did not.
Prices for drilling these wells run on the order of $5 million apiece, and Chesapeake has, in the past, noted that it takes $4.00/kcf to bring in enough money to cover those costs – with a good well. (Note that this is the Henry Hub price, consumers should add about $3 to this to get the residential price). Those numbers are considerably higher than the ones that Mr Berman used with his calculation two years ago that only 28% of the wells will be financially remunerative.

He recently (April 2009) expressed similar concerns about the Haynesville wells – though his production decline numbers are stunningly higher – as much as 20-30% in a month, for an annual decline rate of 80-90%. The costs that he cites are up at the $7.5 to $9.5 million range for the wells, with a net final cost that the producer has to pay in the region of $7.25/kcf. He therefore concludes that the breakeven point for wells in the Haynesville lies at a price of around $9/kcf Henry Hub; with a minimum reserve of some 2.5 Bcf. He upgraded that opinion in June expressing a concern, that I echo, with the availability of natural gas from a variety of sources (including the Rocky Mountain Express and increased LNG shipments) which will make it difficult to sell gas from formations such as the Haynesville, at a profit.

In his most recent post on the subject some of the possible reasons for the rapid decline (which fall a little along the same explanation as I gave on chalk collapse) which are as follows:
An abnormally high-pressure gradient (0.7-0.9 psi/ft) distinguishes the Haynesville from other shale plays. It may also explain the extremely high decline rates, as pressure depletion transfers stress to the rock and allows proppant-filled and open fractures to compress, thereby reducing the effective reservoir permeability.
Unfortunately for the hopes of a new age for gas, in preparation for a meeting on the Haynesville production last week, he had calculated the numbers for some 67 wells in the Haynesville and was still coming up with decline rates of 25% a month.

He also noted
The average EUR in our study is 1.72 Bcf/well, compared to the 6.5-7.5 Bcf/well reported by many operators. Only two wells of the 67 evaluated have an EUR greater than 6.0 Bcf. At the same time, seven wells have already produced more than 2 Bcf and one has exceeded 4 Bcf.

Petrohawk has the best well performance with an average EUR of 3.4 Bcf/ well (19 wells evaluated). Chesapeake has the most wells on production (29 wells evaluated) but we project an average EUR of only 1.2 Bcf/well.
It sounds as though I missed a really interesting and valuable talk – just have to wait for the DVD’s to come out, I guess!! But in the meantime I have added his site to my recommended reading list, over on the right.

I'm also going to have to reorder some of the technical talks on Sundays so that I can more fully explain his concern about the Haynesville shale.

Read more!

Monday, October 12, 2009

The OFGEM Report - bad news which may be optimistic

As the year starts its move towards a close, there are an increasing reams of reports coming out that review aspects of the global energy supply. One of these came out in the UK last week. It is the report from the UK’s Office of Gas and Electricity Markets (OFGEM) on Project Discovery – which looks at four future energy scenarios for the UK.

The report recognizes that the UK has a growing problem. This is because there are two directives from the European Union, the Large Combustion Plant Directive and the Industrial Emissions Directive (pdf) that increasingly restrict the use of coal and oil-fired power plants, when, at the same time, some nuclear plants will also be closing which will lead to a reduced number of major power plants being available. New power plants take time to plan, permit and construct and the postponement of construction of the new power plant at Kingsnorth this past week merely underlines the coming problems.

And so OFGEM set out to see what the challenges and risks to the UK would be over the next twenty years. The report is the result of that investigation.

It looked at four scenarios based on two levels of economic recovery and two levels of investment in green technologies, which combine to the four scenarios examined.

The four scenarios OFGEM examined.

The scenarios had some underlying assumptions to allow dealing with the conditions that were imposed in the models. There is, for example, the assumption that investment for each scenario (which reaches 200 billion British Pounds (BP) for The Green Transition scenario) will be available and will allow the timely investment in power generating systems that meet the targets set. (As a source of reference the UK spent $8 billion BP in 2008 on utility capital investment for the green scenarios this will have to rise to 30 billion BP in 2019).

With an increased reliance on imported natural gas, where the domestic production falls short, there is also the assumption that this will be available – an area of concern in times of high demand in a severe winter. (And this winter may be one) This will, however, become more of an issue in the UK as it responds to the EU directives and loses a significant sector of its electricity generating power after 2015. The report notes that the market and the regulatory arrangements can well undergo severe testing as the nation moves out of the comfortable position it currently holds, with large gas reserve (by normal standards) and a robust gas infrastructure.

The investigation applied a number of stress tests, under the different scenarios, and evaluated their results. The results were summarized in the following figure:

OFGEM stress tests and their perceived results (Bacton is the UK gas import facility)

The designation 1 in 20 refers to the worst condition in the past 20-years with the peak day being the highest demand for energy on the coldest day; and the severe winter being a period of 60-days of exceptionally high natural gas (NG) demand.

While the rapid response and move to green energy both tighten the NG market, when there is not this initial high demand, then the evaluation is that the market will remain oversupplied, though tightening towards the end of the study period.

Perhaps the assumption that raises the greatest doubt is the one that crude oil prices rise to $130/bbl and then fall back, as upstream investments provide the additional supplies needed, to a price of $110/bbl. They cite the IEA and the EIA models as justification for these assumptions, which apply to the rapid growth scenarios. When there is a slower rebound of the economy, then oil prices are anticipated to stabilize at $90/bbl (and they point out that the EIA is predicting that it would actually fall to $50/bbl).

The peak price that they see for NG is 100p/therm under the rapid growth scenario, while carbon dioxide prices are set at 50 BP/ton by 2025 (assuming a global agreement at the meeting in Copenhagen this winter).

In assuming that adequate NG will be available it appears that they are assuming that all the gas pipelines projected will be funded and adequately supplied at full capacity (something that is currently quite questionable for Nabucco, as but one example – though Nabucco only becomes necessary under the rapid demand scenarios), though they also assume that LNG will be available to fill any shortfalls, and that NG will appear from the Yamal fields in the time and quantities predicted (either 2013 or 2014).

OFGEM assumed European supplies of natural gas

In all scenarios they recognize that there must be an increase in the amount of NG supplied from Russia, though, as noted, there is an assumption that there will be enough LNG to make up any shortfall. (Global demand is expected to double or treble by 2020 – to somewhere between 350 bcm and 700 bcm/year – and largely the USA takes care of itself).

As with many of the models of an energy future this one includes the caveat
provided the market participants respond adequately to market signals
but with those responses governed also by perceptions of future politics, and the potential limitations of future supply, that caveat may well cover a multitude of unpleasant outcomes. Yet this is recognized also realistically (but with no real current solution being available to provide an answer).
there are security of supply risks within each scenario, but as important is to consider the implications for security of supply resulting from the huge range of uncertainty that the scenarios cover. For example, by 2020 gas demand could be as low as 77 bcm/yr or as high as 113 bcm/yr depending on the scenario, low carbon generation could make up anywhere between 21% and 52% of the mix, the levels of investment required in the GB energy market (excluding upstream investment) could range between £96bn and £200bn depending on the extent of environmental actions. Together with more traditional risk factors such as commodity prices and project risks, this means that investors face difficult decisions before committing large sums of capital to new projects.
The way in which these events unfold in the UK is that report is now open to public comment with specific questions being identified that OFGEM is interested in getting answers to.

It will be interesting to see how this plays out, though I fear that some of the assumptions that have been made as the review progressed are a little optimistic about future supplies of oil and natural gas.

Although it has the highest investment cost, it appears that the Green Transition is perceived as giving the best outcome:

The Green Transition summary

While perhaps the dash for energy scenario projecting the worst outcome:

The Dash for Energy summary of outcomes

It will be interesting to follow the story, and see how Britain reacts, given that, as the report notes, while the time for decision is here, the conditions are still pleasant, and the urgency of the situation is not yet apparent.


Read more!

Sunday, October 11, 2009

Reserves and production - a simple example

So far in this series of technical talks I have tried to explain some of the pieces that have to be put together to get crude oil or natural gas out of the ground. I intend to go on with the series in the coming weeks, but thought that today I would put some of the different thoughts that I have talked about recently together. So I am going to talk a little about reserve calculations and production and will use an example to show how the numbers are derived. And again, let me stress that this is a very simplified example. It is also only somewhat fictionalized, as I shall comment at the end.

Let me start by assuming that I have a layer of rock that is 300 ft thick, five miles wide and thirty miles long. Let us then assume that this has been folded in the middle, so that it now has trapped oil within all the pores of the rock. And, for the sake of discussion let's assume that it has a porosity of 20%. Now having found this reservoir - which is, let's say some 6,500 ft below the current surface of the ground - back some years ago, the oil moguls of the time decided to drill into it and extract the oil.

So first let's do a bit of arithmetic - 300 x 5 x 5280 x 30 x 5280 = 1,254,528,000,000 cu.ft. At 20% porosity, this means that some 250,905,600,000 cu. ft. are not rock, and in this case are going to be full of oil. This is equivalent to 1,876,773,888,000 gallons or 44,685,092,571 barrels of oil. This is, roughly 45 billion barrels of oil. That's how much is there. (We're neglecting, for now any water that is also in the rock).

This is a relatively light oil and flows through the cracks in the rock quite easily, and there are a lot of these fractures, and it doesn't stick to the rock that tightly, so the assumption is made that production can get out some 50% of the original oil in place. So, at this point we can say that the ultimate resource recovery (URR) is going to be 22.5 billion barrels if they can get it all.

Now, this being some time ago, the first thing that our friends did was to drill some oil wells, and this being that long ago they drilled vertical wells one quarter of a mile apart. To make life easier I am now going to consider just a one-quarter-mile section of the reservoir, taken along the length. We assume that the wells are spaced quarter of a mile apart, and that they gave us this one slice. If the slice is 5 miles long, then it has 20 wells set along the section, so that each well will pull the oil out of a box that extends out one eighth of a mile laterally from the well, out toward the next. The total recoverable oil for each well is roughly 10 million barrels, or 30,000 barrels per foot of the oil well in the reservoir.

Showing location of wells quarter-mile apart and in a quarter-mile thick slice along the reservoir. The rock thickness is exaggerated and this is not to scale.

The rate at which the oil flows into the well is related to the difference in pressure between the oil in the rock, and the fluid in the well; the frictional resistance of the rock to the oil flow through it; and the length of the well that is exposed to the rock. Let us assume that the rock resistance remains the same and that production varies directly with changes in the pressure difference and the length of the exposure. And let us start by assuming that the well produces 3,000 barrels of oil a day. (i.e. 10 barrels per foot of well exposed to the rock). Then, in the course of a year the well will produce one million barrels of oil. Connect up the pipes, and away we go.

After five years we notice that the volume coming out of the well is not as much as it used to be, and when we check with the engineer he explains that, as we take the oil out of the ground, so the pressure in the oil reduces, and the flow slows down. Well, bless my bananas, and here we have just promised a new palace to one of the grandkids. So we have a chat with the lads and they tell us of this neat trick they have in Russia. If we pump water into the ground under the oil well, then the water will fill the holes left as the oil leaves, and we can keep the pressure in the oil up, and the oil flow will not drop as fast. So out we go to the site, and we drill secondary wells around the first set that had been put in, and now we pump water back into the ground around the well, and bring the pressure back up to the pressure that we started with. And from then on we are pumping water into the ground as fast, (and soon to tell faster) than we are taking the oil out.

Initial pattern of water flood, adjacent wells flood under the producing central well

Because now there is a little problem that we hadn't thought of when we started this exercise. Over the years we have taken out say 4 million barrels, now as we compress the oil back to the original pressure (we're neglecting the gas issue for now) it will only occupy 60% of the original space, or the top 180 ft of the reservoir. Now at the same pressure we will only get 60% of our original flow, because the length of the well exposed to the rock has been reduced (and flow is related to length and pressure). And this is going to get worse, each year the flow will decline as the length of exposed well in the rock gets smaller.
For example, the next year it will produce at 1,800 bd,(10 barrels/day/ft) but at the end of that year we will have removed (simplifying) 650,000 bd of oil, and so the volume of oil will be reduced by (roughly) 11% of the 6 million barrels we started with, and so the following year the production will come from only 160 ft of the reservoir, and, at the same reservoir pressure, the flow will be reduced because of the shorter exposed length. And the flow will be, accordingly also reduced by 11%, assuming that the overall area remains the same. (Some folks might call this depletion, it is the decline in production with time).

Yikes, and here that palace isn't finished yet. So what can we do. Well it turns out that there is another trick we can pull out of the hat. Apparently some folk in Italy have found a way to turn a drill so that it drills horizontally across the reservoir, rather than vertically down through it. At the same time someone else has come up with this idea, that if you just pump the water in around the edges of the reservoir then it makes a more even lift of the water:oil surface up the well, and there isn't as much chance of water stopping the well from producing while there is still oil available. Bingo, we'll have a couple of those.

We only need two because we can now drill the wells horizontally all the way from the middle to near the edge of the reservoir (one in each direction). So the holes are each two-and-a-quarter miles long and are equal in exposed length to the reservoir of forty of the original wells. Now the length stays the same, but the production drops to 1.5 barrels/ft/day. But, by pumping water into the surrounding wells, we keep the pressure up and hold that production. So now, out of these horizontal wells we get say 18,000 barrels of oil a day. And it keeps pumping. Call the grandkids and have them build an extension on the palace.

Water flood under horizontal wells, in this ideal case the water is fed from the outside of the reservoir and rises as a steady horizontal lift over time - until it reaches the wells.

But wait. When we started doing this, we had taken out of the ground about half of the recoverable oil. We had, in that slice of the reservoir some 200 million barrels of oil. We had produced half of it, and thus had 100 million barrels left. We are now producing it at the rate of 13 million barrels a year (2 wells). But it just keeps pumping, as long as we keep pumping that water in, until . . . . . .the day the water level reaches the horizontal well layer. And we're done, it's all over. Oh, there will be some indications before it happens, water cut will start to rise again, and production drops and this is really an idealized case and production will likely drop before then due to preferential water flow through the ground. But in either case, even if we get all that was there, and we won't, we didn't create any more oil by drilling horizontally, we just got it out faster.

As the technology improved, over the life of the field, we was found that oil also occurred in an additional mile of rock to either side of the zone that had been initially expected to hold it. It also turned out that the field extended about 7 miles longer than originally anticipated. However, with the new additions and as the field finally began to play out it turned out that the average thickness of the carbonate grainstone was only 240 ft. If you do the same calculation as before you will find that this changes the initial estimate of the original oil in place to be some 62 billion barrels. This change in reserves as the field is developed is not uncommon in oil fields and is one of the ways in which reserves grow, often quite significantly after the field has started to be developed.

And at this point those of you that have read “Twilight in the Desert”, or have worked in the oil patch may note that what I have used for my numbers bears a reasonable similarity to the oilfield known as Abqaiq in Saudi Arabia.

Google Earth image showing Abqaiq relative to the Saudi coastline (the blue dot where the roads meet)

(Although all the exemplary numbers other than the geometric size of the field, and its porosity and depth were made up by me as I went along to illustrate the developments of the technology that have been applied to that field). The oil has a 36deg API, with a gas/oil ratio of 860 cf/barrel. (It is also sour). The rock permeability is 400 millidarcies in the Arab D formation (this info is from "Twilight"). We can get some other information on this field from a number of other places. So, as a contrast between the myth and the reality you might want to read on.

The first well at Abqaiq was spudded in August 1940. It began production at 9,720 bd in October 1940, but had to be temporarily shut-in the following February because of the adjacent war. Early development was slow, but began to pick up as the conflict moved further away.
If the expansion of 1936 had struck some of them as a period of hectic confusion, this 1944 expansion struck them as bedlam. Their goal by the end of 1945, they were told from San Francisco, was 550,000 barrels a day, nearly 25 times what they were turning out now in their standby operation, and much more than the capacity of their existing wells. There would have to be a massive drilling program involving perhaps 20 strings of tools, and drilling that many oil wells meant developing adequate water supplies both at Abqaiq and at Qatif, where they had been instructed to put down a wildcat. . . . . . . . By June 13th, too, Phil McConnell had entirely shut down the Abqaiq field after completing No. 5, and had diverted his entire Drilling Department to Ras Tanura.
By 1962 only 72 wells had been drilled in the field. At the same time the gas was being extracted with the oil, and 50% of it was being used. Most of it was pumped back underground to maintain pressure and in some cases it was mixed with LPG (Liquefied petroleum gas) and this helped dilute and increase the flow of oil from the reservoir. (But sometimes it did not work). It was used in the Ain Dar part of the Ghawar field and right next door to Abqaiq. But in 1982 the gas was collected for sale abroad.

By 1972 Aramco was drilling a well at the rate of 1 every 2.1 days. Shortly thereafter Abqaiq peaked, at 1,094,062 bd. In the area of Abqaiq there were 4 drilling rigs and 5 workover drigs in the period around 1977, as the field fell back to a production of less than 800,000 bd. By 1981 production was down to 652,000 bd In the mid-80's it was partially shut-in, and flow was reduced to 200,000 bd as demand declined.

And while the rest of Saudi production continued to grow, in 1988 it had 550 wells in production by 1990 Abqaig had only 47 flowing wells, and by 2002 had dropped to 500,000 bd. It is currently 73% depleted, according to Aramco in 2004 and 74% according to the EIA .

Now beyond this point there are some conflicting numbers. Let me just list some of the information that is out there.

In the 50 years since discovery it yielded 7.5 billion barrels of oil.

Abqaiq production history from Saleri via Joules Burn

The EIA considers that Abqaiq has 17 billion barrels of proven reserves. This is in contrast with the recent "World Energy Outlook 2005", which projected (through 2004) that Abqaiq had 5.5 billion barrels remaining and had produced some 13 billion. (But it got the start date wrong as well). It uses IHS data for its projections.

From that data, quoted by Jean Laherrere, one can estimate the total oil contained in the field. Using their anticipated total of 19 billion barrels, and that this is considered to have a recovery factor of 60% indicates that the overall oil in place is about 31 billion barrels. This is about half of the theoretical prediction I had made, using total volume and porosity, but given the variations in geology over the region, that the field has about 50% of the oil that the general assumption predicted is not bad.

However using the Aramco statement that the field is 73% depleted implies that the total oil that can be recovered from the field is around 11 - 12 billion barrels, which is in line with the HL projection created by Laherrere.

Abqaiq production projection by Jean Laherrere

The field is variously currently reported as producing between 250,000 bd and 434,000 bd. The IEA consider the latter figure - which yields 158 million barrels a year, sustainable through 2010. (At 8% depletion, although Aramco are claiming that they are holding depletion below that - by continuing in-field drilling). However if the OIP is 31 billion and they are only able to recover 11.5 billion, then this gives a recovery factor of some 37%, which is a fair bit less than is derived by other approaches.

And, it was from this field that Dogru, Hamound and Barlow generated this image:


Joules Burn has provided a much more detailed discussion of Abqaiq in a post from May 2008.

This has been a bit longer than these usually are, but has still had to make a lot of simplifying assumptions to fit, so again I ask those who know more to either bear with me, or to post comments.

Read more!

Saturday, October 10, 2009

Climate Hypotheses and the falsification thereof

There is much discussion in climate related circles about this topic being a scientifically based set of events, conclusions and predictions. In scientific circles when new ideas come along they are generally accorded the title of hypotheses and they are then subject to review, with the potential that they will ultimately be discarded because they have been shown to be wrong, or falsified as the technical term would describe it.

Essentially – to use the examples from Wikipedia, if I say that some men are immortal it is not possible to falsify the statement, since I just might not have met one of the immortals yet, but if I say all men are immortal, then production of the first dead body proves the hypothesis wrong.

The question then arises as to how much error a hypothesis is allowed, before it is considered wrong.

For instance I was looking at the Real Climate website, and noted their arguments about the data that they believe falsify Svensmark’s theories on the impact of Galactic Cosmic Rays on global climate. I find this a bit amusing really, since while they are quite happy to argue about falsification when it comes to theories that differ from theirs, they appear remarkably insensitive to seeing the shoe put on the other foot, when it comes to discussions of climate warming. (And incidentally there is some evidence that what Svensmark said is correct. (Which might be why folk, not generally considered to be idiots, are funding him).

RC's previous post, for example discusses the possibility of a pause in the steady progress of global warming that their theories have projected is still going on.

Trends in Global Temperature (from Real Climate – and previously from GISS)

Now the thing is that there is obviously some natural phenomenon going on that would (were greenhouse gases the villain they proclaim) negate the increasing effect of those gases over the past decade. And that has an impact on an earlier study.

It should be remembered that when the whole issue of global warming was first brought to large-scale public attention, one of the arguments made for the influence of greenhouse gases on the climate was that the models of climate behavior without consideration of the influence of greenhouse gases, showed relatively little change over time.

Predicted global temperatures from 13 models run by James Hansen (from Dire Predictions)

You can see that from 1965 the graph set is pretty flat, with all models showing no significant change over the period. Thus, if one accepts that there is something natural that is precluding the global temperature following the theoretical prediction, then one must go back to one of the underlying hypotheses that Dr Hansen proposed - namely that there are no natural phenomena that will likely have any significant effect on global temperatures over the period of time that we are all concerned about. Given that RC is now saying that there are natural causes that are transiently diminishing the effects of carbon dioxide on global temperatures, it would seem that they are concurrently arguing that the initial premise upon which Dr Hansen built his case has now been falsified.

Now when we look at the predictions with greenhouse gas in them then the graphs show that temperatures match those predicted when greenhouse gases are included.

Predicted global temperatures from Hansen’s models (blue), against actual temperatures (red) (from Dire Predictions).

However if one then looks at what Dr Hansen projects from 2000 to 2010 and beyond, one gets a very distinctive upturn in the predicted temperatures:

Dr Hansen’s predicted global temperatures under 3 scenarios (A business as usual; B moderate gas emissions and a volcanic event of significant magnitude; C a volcanic event and reductions in the emission of carbon dioxide by 2000). (Again from Dire Predictions).

Looking at where we are actually at relative to those three scenarios – which have temperature anomalies of A – 1.1 degrees; B – about 1 degree; and C about 0.65 degrees, one can see that the actual temperatures from the top graph are actually closest to following line C at the moment with an increase of somewhere around 0.55 degrees, which is below even the increase that that model predicts, although it does predict a lowering value, suggesting that we have already reached the target for 2012. . However this result, given that carbon dioxide levels have not fallen as predicted, suggests that the model predictions, once outside the range of conditions that prevailed at the time they were written, are not correct. In fact one could conclude that if Dr Hansen’s predictions are summarized into the hypothesis that, without the control of greenhouse gases exemplified by those measures he calls for in scenario C, that global temperatures will increase unacceptably, then this hypothesis has been falsified.

Now Real Climate argues that global temperatures should actually be considered higher, since there is insufficient data from the Arctic, which is considered to be warming much faster than the rest of the globe, and were that considered, then the models and readings would be much closer. . (Interestingly, however, when the ocean temperatures from the North Atlantic are looked at, they now appear to be declining, perhaps falsifying that argument before long).

North Atlantic Heat content (after Tisdale )

The problem with the RC argument is that is that it was the available temperature readings, relative to the model predictions that were touted as being so close in performance (graph 2) during the global warming period of the last part of the last century. Changing the data base as one moves along a line of predictions is generally frowned upon.

There is some growing body of opinion that projects that – just as with curve C above – the global temperature may stabilize around current temperatures for a total of as much as 30-years, before beginning to rise again. That is inconsistent with the predictions of the models used in the above work. Thus it seems only rational to conclude that if there is no discernable increase in temperature, on a consistent basis, in the near future, that the climate change arguments that hang on these graphs for justification must themselves be considered to be falsified.

That would be the scientific conclusion, and were this really a scientific debate then this would be a subject of discussion. Since, however, this has long passed beyond the point where it has become an article of faith with many folk, and the weakness of the foundations on which the Climate Change debate is really built is not to be considered, then one is left wondering how many years of obfustication we must tolerate before the recognition that it is worthy of considerable debate actually occurs.

Read more!

Friday, October 9, 2009

Another thought on Algae

I occasionally write about the potential advantages that might come from growing algae as a source of biodiesel and other liquid fuels. However I have also tried to point out that it is not something that will allow you to drive your truck for ever on the green slime that is growing in your pond, starting tomorrow afternoon.

There is a long process of validation and scaling up that will be required to construct a viable productive industry, large enough to make a significant contribution to the nations supply. And by significant I mean in and around the million barrels a day mark. In an earlier post I tried to delineate some of the technical issues, and in another post the reasons why it will likely take between ten and twenty years before we see that level of success.

To get into that process will, of course, require some initial ideas with promise, and a significant amount of investment (for example General Atomics, Exxon, BP and Boeing - to name but four of the companies involves with very large investments in the potential of the technology). However it is often not clear how far along these developments are, relative to the hurdles that they have to overcome.

However, there has been an article by Emily Waltz in Mother Jones that recently pointed out to possible investors in the technology that they need to do at least the usual levels of due diligence before investing in the technology. It points out that there are something on the order of 200 companies worldwide that are working on the topic, but that it is not yet possible to purchase commercially available oil from any of them. It cites, in fact, the journey of one individual who visited apparently 40 of the companies in the United States, and concluded that he was better off starting up his own company than going to work for any of those that he had visited.


I remain convinced that there is a considerable potential for the process to become viable. However there are a considerable number of hurdles that have to be crossed before that point can be reached. An immediate rush to large scale trials can gloss over some of these problems with unfortunate results, not only for that individual project, but also for the reputation of the technology as a whole.

This is perhaps most recently demonstrated by the fate of Greenfuel Technologies about whom the above article does not stint its scorn:
The company insisted it could produce oil at the equivalent of more than 44,000 gallons per acre per year. Venture capitalists ponied up more than $33 million between 2005 and 2008, a sizable amount for an energy startup of its size.

GreenFuel's pilot project proved twice as expensive as projected, and the company folded in May. "They had no technology—nothing except PR for outrageous claims repeated often enough to sound believable to some poor souls who bought into their fibs," says John Benemann, a former researcher at the University of California-Berkeley who now works as an algae consultant.
Part of the problem that arises is that there is not always enough scrutiny given to the ideas that are proposed, where fancy computer created pictures of possible future plants hide the reality of the thinness of the ideas and the lack of comprehension of the scale of the difficulties that must be overcome in a number of different fields, if the technology is to come to fruition. The article continues:
Whether the algae charlatans will be exposed before the DOE sinks taxpayers' money into their companies is another question. Curtis Rich, a renewable energy attorney, says he believes the DOE's review teams will be "able to determine those projects based on press releases and those based on sound research." But Benemann is not so sure. The week GreenFuel folded, the DOE awarded an Arizona utility $70.6 million to scale up the firm's technology.
Outside of the major efforts that are being carried out, there are also a considerable number now of smaller programs that Universities such as ours are getting into, to further explore the technology. Algae have benefits not only from the oil that some varieties can form in sufficient volume to appear attractive, but also because they can adsorb significant quantities of carbon dioxide as a part of that photosynthetic process. Thus there is a potential for their use in reducing the carbon dioxide output from power plants and other gas producers. Often these experiments don’t get a lot of light, but occasionally even efforts such as ours catch a little attention.

There are some successes that have been reported on some of the subsidiary problems that have to be overcome on the way to generating a sufficient volume of oil to be realistically useful. These include ideas that relate to harvesting and separation of the different constituents of the mix. However, one of the difficulties in writing about a subject that is part of my day job, is that some of the more interesting current work cannot, at this stage, be published – for a variety of reasons – some obvious.

So let me stop before I get into too much trouble and merely note that the technology has already shown promise and some answers, but that I do not believe that it will provide the rapid response to the developing peak in oil production in sufficient time to have any impact on that situation.

Read more!

Wednesday, October 7, 2009

Reserves and Resources

In trying to estimate the size of the problem that will face the world as the available reserves of fossil fuel begin to decline, one has to make some assumptions about the size of the volumes that are available. It is a debate that can lead to people talking past one another if they make different assumptions about the size of those reserves. This holds true in discussions that dot the web sites of those that write about energy, whether writing about oil, natural gas, coal or uranium.

This current post was motivated by a couple of different stimuli, firstly there was an article on Seeking Alpha about the natural gas reserves of the USA and then I was asked a question about the coal reserve assumptions for Alaska.

The natural gas article illustrates, in some ways, the problem of discussing the remaining gas that the United States has available, and whether we have a problem in future supply. With a consumption of around 23 tcf per year, it questions whether the remaining gas reserve is 337 tcf or 1,747 tcf. It was followed, interestingly, by a second article on natural gas that points out the folly (as it turns out) of being in the natural gas market this past year, as an example of the “no free lunch” argument.
“Natural gas is probably the best demonstration of the ‘no free lunch’ law in commodity indexing, as evidenced by the S&P GSCI Natural Gas Index which commenced at 100 in January of 1994, ended September at 2.63. Over the same period, the natural gas future has increased about 125%. While 2008 served as a strong reminder ‘to know what you own,’ 2009 has reminded investors ‘to know how to be properly exposed to commodities.’”


This ties into estimating the size of the reserve, because, in raising money to develop reserves, you have to be confident that the money that you invest will give you a financial return on that investment. If the price of natural gas has tumbled to $3 or less (per kcf) then you may not make that return, and may even lose money. You will therefore look more cautiously at what are potential sources and be more selective on where you drill. Some of the more questionable areas will no longer be sites that justify the investment. And thus these areas move from being in the reserve account into that of being a resource that is available, but not justifiable as being exploitable AT THE PRESENT TIME.


Yes I know I was shouting, I did because it is that qualifying clause that gets overlooked time and again when discussions arise over what the fossil fuel base is for the world. The condition as to whether the volume has enough worth to justify being developed changes with conditions. Coal in the UK had a considerable future before the oil and gas reserves of the North Sea were developed. At that time the reserve was proven at over 45 billion tons and the coal was being mined at around 200 million tons a year - but times change, and the cheapness of the liquid fuels, relative to the cost of mining, meant that a lot of the coal, although still there, is currently too expensive to produce – relative to the alternative. It is thus no longer counted as being part of the reserve.

Now this gets into the climate change debate a little, since one of the arguments that are raised is that the users of coal do not pay the full price, since the price they do pay does not include some of the social and environmental costs associated with burning the product. Since the customer ultimately pays for the product, this seems in part to be an argument to justify raising the price of coal based energy to the point that other sources become cost effective. The problem is that in some locations it is hard to find current technologies, even at cost equality, that can provide a replacement for coal as oil and natural gas supplies run down.

Which gets us back to the question as to how much of a reserve of oil and gas we have, and how long will it last before we have to face the reality of a return to coal.

And this is where the price of the product controls, transiently, the volume of fuel available. In the short term natural gas prices are down and it becomes harder to justify continuing to drill new wells, if they aren’t going to make money. But as more folk stop drilling, then with the very transient life of the existing wells, the supply will shorten, and after the stored volumes begin to be used up, then prices will rise to the point that an effective market can be reestablished. How long will that take?

Probably until sometime next year is my current guess, though it depends in part on how hard a winter Europe and North America experience this year. (And since that is weather and not climate I’ll hold off on making that prediction today).

In the longer term there are so many power plants that now rely on natural gas that demand will sustain a higher price, and lead to an increase in the drilling rate, until price:supply and demand reach a more stable platform. At that time the reserve volumes that are currently moving into the resource category will start to move back and the projections for a longer “age of Natural Gas” will start to assume a little more reality.

However I would like to throw a small caveat into that debate, at the beginning of the year the SEC changed the rules for counting the validity of an oil or gas resource, loosing the requirement that the fuel be “proved” to be there. The ramifications of that decision are likely to have some impact on this debate.

Read more!