Showing posts with label CO2 Science. Show all posts
Showing posts with label CO2 Science. Show all posts
Thursday, November 29, 2012
OGPSS - The ARPA-E 2012 Awards
The Department of Energy has just announced the projects that have been selected for funding in the next round of the ARPA-E program. (This is the Advanced Research Projects Agency-Energy, first funded in 2009, to, inter alia, "focus on creative “out-of-the-box” transformational energy research that industry by itself cannot or will not support due to its high risk but where success would provide dramatic benefits for the nation".) There are some 66 projects on the list, which is broken down into eleven different focus areas. These are the technologies that the ARPA-E program is betting some $130 million on, as sources of future energy supply or savings. It is worth taking a quick glance through the topics to see what is considered important and likely of success.
The two largest areas of funding are Advanced Fuels and Grid Modernization, both of which get around $24 million or 18% of the pie. This is split among 13 fuel projects, and 9 grid-related projects. With the growing supply of natural gas that is coming from the developing shale gas reserves in the country, it is perhaps no surprise to see that methane conversion to liquid fuel captures the largest part of the fuel funding this year, being the theme of nine of the awards.
The largest of the fuel awards goes to Allylix a company that specializes in terpenes, and who is tasked with turning these into a viable aviation fuel. Specific genes needed for terpene production are extracted from a biosource, and then optimized for use in a yeast host. The optimization is an engineered change that can increase product yield several hundred fold (according to their website). From that point there is a fermentation process, and then a recovery and purification of the liquid fuel, which is stated to be already commercially viable.
There is only one algae award this year, to Cornell for $910 k, and they will look at using light fibers in a small reactor as a means of improving economics. After having looked into this process I am prone to disagree that smaller is better (if you are going to generate hundreds of thousands of barrels a day you need large systems, and anything on a smaller scale is hardly worthwhile). Further there are issues with engineered light paths, but they will no doubt find those out as they carry on with their work.
The “different” program in this effort is for $1.8 million which is being given to Plant Sensory Systems to develop a high-output, low-input beet plant for sugar production.
There are just two awards for Advanced Vehicles, one to Electron Energy Corp to produce better permanent magnets that don’t rely on rare-earths, and one to United Technologies to improve efficiency by using laser deposition of alternate layers of copper and insulation in a new electric motor design. This will also reduce rare-earth dependence. They roughly split $5.6 million.
The $5.3 million for improving building efficiency goes to California, and is split with two awards to Lawrence Berkeley and one to Stanford. Each has a project on using coatings to alter the thermal transfer to the buildings and cars, while Lawrence Berkeley also gets almost $2 million for modeling studies of building heat losses.
The $10 million for carbon capture is split four ways, with two awards (to Arizona State and Dioxide Materials) for electrochemical systems that will generate new fuels from the carbon dioxide output of power plants, while the University of Massachusetts at Lowell is developing (for $3 million) a catalyst that will also combine sunlight, CO2 and water into a fuel precursor.
The fourth award is to the University of Pittsburg (at $2.4 million) for a way to thicken liquid CO2 either as a way of improving EOR, or as a substitute for water in hydrofracking. I can’t quite see the advantage of a thicker fluid for use in EOR, since the hope, surely, is to have a very low viscocity fluid that can more easily penetrate into the formation and mix with the oil, but the application in fracking is intriguing.
The emphasis with the investments in Grid Modernization (the co-largest topic) is on improving switchgear (five awards). In addition there are two awards for modeling, one on improved instrumentation and one to Grid Logic ($3.8 million) for developing a new super-conducting wire for power transmission.
There are two awards, both for $2 million, in the “Other” category. One is to MIT for a water purification system, wile the other is to Harvard. This latter is for a “self-repairing” coating that can be applied to water and oil pipes to reduce friction and thus lower pumping costs. The old fall-back on this was Teflon, which could be very effective, but any particulate matter in the fluid will erode this over time, so the “self-healing” aspect could be worthwhile, since it might allow a much thinner liner.
The $18.76 million for Renewable Energy projects is distributed to wind, sun and water energies, with two projects in waves where Brown University will be building a new underwater wing to capture flowing water energy, and Sea Engineering, who will be developing a better buoy for acquiring data for tidal energy potential assessment. Wind is down to a two projects, one, which seems a bit regressive, is to GE who will develop fabric blades for wind turbines for $3.7 million. A similar amount is going to Georgia Tech to develop a vertical axis turbine. The remaining six projects deal with solar power of which the most interesting, perhaps, is that at Cal Tech which is going to look into splitting light into its different color bands (think prism) before using them to improve device efficiency. We have seen that converting white light electronically to the narrow optimal color band can have dramatic effects on improving algae growth rates, for example, but it requires a bit more refinement to achieve the narrow division than, I suspect, will be possible optically.
The section that will invest $12 million in Stationary Energy Storage is funding 8 projects looking at different battery technologies. The largest investment ($4 million) is going to Alveo Energy, which has an intriguing entry in Find the Company. It was apparently only founded this year. The technology that it is chasing involves using Prussian Blue dye as the active ingredient in the battery.
The other “out of the ordinary” award is to Tai Yang which is affiliated with Florida State University. Superconductivity Center. The $2.15 million award is to develop a method for storing energy in a high-power superconducting cable.
Pratt and Whitney get two of the three Stationary Generation awards, the first for $650k is to develop a continuous detonation gas turbine, while the second, for $600 k is for work on an ultra-high temperature gas turbine. The University of North Dakota gets the third award to look at developing air cooling for power plants.
The $9.5 million for Thermal Energy Storage is split five ways, with three awards for the development of power from the waste heat in existing systems, one to the NREL for a solar thermal electric generator, and one to Georgia Tech for a solar fuels reactor using liquid metals.
When it comes to finding answers to Transportation Energy Storage the Agency is committing $15.3 million to seven projects. Six of these deal with battery development. (A123 Systems who previously received a $249 million federal grant to develop electric car batteries recently went bankrupt.) Two of the awards, to Georgia Tech and to UC Santa Barbara will seek to combine super-capacitor design with battery capabilities, while the Palo Alto Research Center will use a printing process to construct batteries.
Ceramatec is being funded, at $2.1 million, to develop a solid-state fuel cell using low-cost materials.
There is a clear change in emphasis from earlier years reflecting, no doubt, the results from ongoing research, as well as the obvious change that the current natural gas availability is allowing in developing technical advances for the future. It should, however, be born in mind that while some of these will likely prove to be quite successful, it will still take perhaps a decade before any of them can be anticipated to have any significant impact on the market.
Read more!


Thursday, May 31, 2012
OGPSS - The potential for Saudi EOR
Without getting into the discussion of the other aspects of the site, it was interesting to read a post dealing with future oil production on “Watts Up with That” today, in which it is suggested that the forthcoming fall in Saudi oil production will presage the decline in overall global oil production. (The site has won the “Best Science” weblog award the past two years).
The relevant quote is

Figure 1, Euan’s production estimates from 2007.
One of the reasons that I am writing the current OGPSS series is to see how the earlier estimates that we made “back when” are playing out, and, for reasons I have explained both in earlier posts and below, Saudi Arabia is likely still a couple of years away from peaking. No, (to finish the opening thought) the major player who will tip over first is much more likely to be Russia (of which I have written earlier) than the Kingdom of Saudi Arabia (KSA). Very simply Russian producers will likely soon yield back global production leadership to the KSA, (though presently still slightly ahead) and further, since they run on maximizing current production, rather than overall field yield, they are not doing the necessary steps to sustain future production which is a growing characteristic of the KSA operations. There are a number of different examples to illustrate this, as I have documented earlier. In addition the KSA seems increasingly interested in developing the enhanced oil recovery (EOR) techniques that have helped other fields in the latter stages of their lives.

Figure 2. Enhanced Oil Recovery methods and production volumes (Saudi Aramco)

Figure 4. Traditional use of CO2 for EOR (DOE )
DOE notes
 Figure 7. Gains achieved by BP in changing salinity in recovery from different fields (Saudi Aramco ).

Figure 8. A core of tar-bearing carbonate rock under attack by hydrochloric acid (Aramco Journal of Technology)
The next big one to tip over into decline will be Saudi Arabia.And, if you have been following this series, then you will understand the basis on which I make the observation that this is, in fact, incorrect. The site uses a plot by Euan (without the link) from back in 2007, though it is credited to 2008.

One of the reasons that I am writing the current OGPSS series is to see how the earlier estimates that we made “back when” are playing out, and, for reasons I have explained both in earlier posts and below, Saudi Arabia is likely still a couple of years away from peaking. No, (to finish the opening thought) the major player who will tip over first is much more likely to be Russia (of which I have written earlier) than the Kingdom of Saudi Arabia (KSA). Very simply Russian producers will likely soon yield back global production leadership to the KSA, (though presently still slightly ahead) and further, since they run on maximizing current production, rather than overall field yield, they are not doing the necessary steps to sustain future production which is a growing characteristic of the KSA operations. There are a number of different examples to illustrate this, as I have documented earlier. In addition the KSA seems increasingly interested in developing the enhanced oil recovery (EOR) techniques that have helped other fields in the latter stages of their lives.

As Aramco note, as the price of oil has risen, so the economic viability of EOR technologies covers a greater range of options.

Traditional CO2 injection, for example, can enhance overall field production by perhaps 18% or more.

In WAG injection, water/CO2 injection ratios have ranged from 0.5 to 4.0 volumes of water per volume of CO2 at reservoir conditions. The sizes of the alternate slugs range from 0.1 percent to 2 percent of the reservoir pore volume. Cumulative injected CO2 volumes vary, but typically range between 15 and 30 percent of the hydrocarbon pore volume of the reservoir. Historically, the focus in CO2 enhanced oil recovery is to minimize the amount of CO2 that must be injected per incremental barrel of oil recovered, especially since CO2 injection is expensive. However, if carbon sequestration becomes a driver for CO2 EOR projects, the economics may begin to favor injecting larger volumes of CO2 per barrel of oil recovered, i.e., if the cost of the CO2 is low enough.And how effective can it be? Consider this plot of production gains in the Wasson field in West Texas.

Note that the DOE reported that in 2008 the industry was injecting 1.6 bcfd (billion cubic ft/day) into Permian Basin fields to produce 170 kbd of oil.

It is worth noting that the KSA initial site is being set up to inject 40 mcf/d (million cubic ft/day) some 2.5% of the US volume, into 7 wells in the initial pilot project, in Uthmaniyah so that the initial gain in KSA production may well be quite small, but there are additional CO2 sources in country which, should the pilot show to the gains potentially possible, can be tapped and which could significantly change the overall ultimate recovery of oil from Ghawar (and others). Further there is ongoing research into enhancing the performance of CO2 in EOR, that will likely pay off in the medium term.
In regard to the SmartWater flooding the first field injections have been successful, and a full scale demonstration is now planned. The advantages for this change are considered to be:
• It can achieve higher ultimate oil recovery with minimal investment in current operations (this assumes that a water- flooding infrastructure is already in place). The advantage lies in avoiding extensive capital investment associated with conventional EOR methods, such as expenditure on new infrastructure and plants needed for injectants, new injection facilities, production and monitoring wells, changes in tubing and casing, for example
• It can be applied during the early life cycle of the reservoir, unlike EOR.
• The payback is faster, even with small incremental oil recovery.A BP study (Lager, A., Webb, K.J. and Black, J.J.: “Impact of Brine Chemistry on Oil Recovery,” Paper A24, presented at the EAGE IOR Symposium, Cairo, Egypt, April 22-24, 2007. Also Strand, S., Austad, T., Puntervold, T., Høgnesen, E.J., Olsen. M. and Barstad, S.M.: “Smart Water for Oil Recovery from Fractured Limestone: A Preliminary Study,”) showed the following incremental gains over conventional water flooding.

The current areas of investigation have extended into dealing with the tar mats that are present in parts of Ghawar.

Current research is aimed at extending wormholes into the formation, through which it will be possible to pass different EOR treatments in order to further improve the extraction rate from the field.
When these current projects, in their various stages, are combined with the future production from Manifa, and enhanced production from Safaniyah, I expect that the Kingdom will continue to produce at around 10 mbd for at least a few years more, though I continue to doubt that it will be able to increase much beyond that. After all, even when field declines are held to 2% a year, after 50 years the arithmetic starts to take an increasing toll – Ghawar began production in 1951.
And so, with respect, I disagree with David Archibald, if only in the short term - but for those of you with a few minutes, the comments that follow his post at WUWT are quite entertaining.
Read more!
Monday, May 9, 2011
Louisiana USHCN state temperatures
I am beginning to think that the CDIAC had the same sort of budget cuts that affected the EIA, and that this took down the server that I have been using. (Since it is still not available). So to keep going with the foundation of the data base, until I can get the TOBS information into useful form, I am going to use the Surface Station USHCN site to get the preliminary data on the stations in Louisiana. I will then download the GISS information for the stations and proceed as I did for Arkansas. This at least will get the stations and populations established.
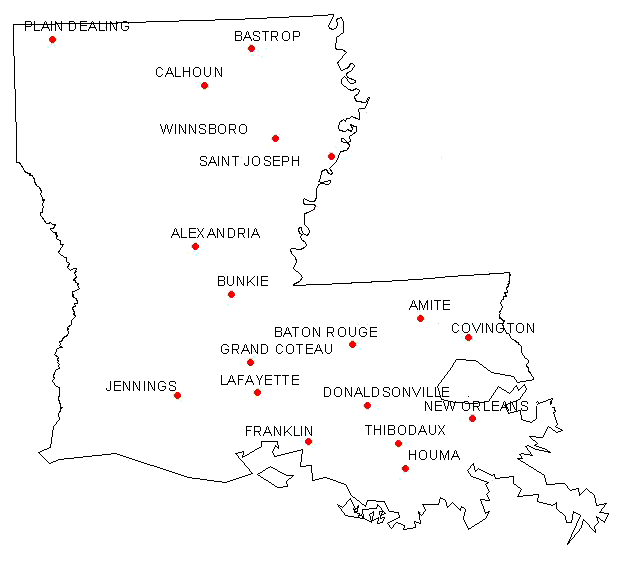
There are 18 USHCN stations in Louisiana, from Alexandria to Winnsboro, and there are two GISS stations, at Lake Charles and Shreveport, on the list. Looking for a source for the layout of the stations I find that I can get the Louisiana layout at the CO2 Science website.
 Location of the USHCN stations in Louisiana ( CO2 Science)
This site calculates a trend for the mean temperature data, but for the example I chose (Alexandria) it only goes up to 2006.
 Temperature trend for Alexandria LA (CO2 Science)
This is an interesting resource in that it saves me calculating the trends for the different stations. Since, at some time in the future, I had thought to move on from just the data to the trends, this will be a useful site to get that information. The question, however, is as to whether they are plotting the homogenized or raw data for the station?
 Alexandria LA GISS temperature plot (GISS )
This is clearly not the same set of values, which means that there are two different homogenizations being carried out. (Note that this is recognized at the top of the CO2 Science plot). So that gives another little puzzle to look into. However, for today, it is sufficient that I have found another site that shows where the USHCN stations are in the state, so that we can get a measure of how well they are distributed.
So now I go to the GISS site (which again gives me some foreign location when I click on Louisiana) and pick Grand Coteau as being somewhere close to the middle of the state. This allows me to find the rest of the sites in the state, using the (*) facility to locate adjacent stations.
So first I download and convert the data, and discover that the GISS station at Lake Charles has only been in operation since 1948, which no longer comes as a surprise.
 Lake Charles average temperatures (GISS )
On the other hand Shreveport has been reporting data since the 1880’s.
 Shreveport average temperatures (GISS)
And, in passing we note that Louisiana was warmer in the 1930’s than recently. So what does the data look like (bearing in mind that I am only working with the homogenized data at the moment) ?
The difference between the USHCN data set and the two GISS stations has been steadily increasing over the years:
 Difference between the average GISS station temperature and that of the average USHCN stations in Louisiana, over the past 115 years.
Looking at the actual average temperature change for the state:

Over the past 115 years the average state temperature has followed the pattern shown above for Alexandria, although the rate of temperature decrease is at a rate of around 0.05 degrees F per hundred years, which is sensibly saying that it has stayed the same. It is interesting that the visceral reaction of those who disagree is to suggest that this sample is too small, and thus meaningless – yet it is consistent with other states, and cumulatively these numbers start to gain importance.
Looking at the geographic information for Louisiana, it is a state that is 380 miles long and 180 miles wide. It runs from 89 deg W to 94 deg W, and from 29 deg N to 33 deg N. The center of the state is thus at 92.5 deg W and 31 deg N approx. The USHCN stations center on 91.6 deg W, 30.9 deg N. The GISS average is 93.5 deg W and 31.3 deg N. The average elevation of Louisiana is 30 m above sea-level, with the USHCN being at 24.4 m, and the GISS average being at 35.5 m. The highest point in the state is at 163 m.
So looking at how the temperatures are controlled by the geography, the correlation with Latitude is as expected.

And while there is a suggestion that the decline with change in longitude is significant, because of the changes in other states, I continue to consider that it, in reality, dependent to other factors.

The most likely is that of elevation, and, despite the relatively low-lying nature of the state, the correlation with elevation remains strong.

In regard to the population figures of the state, there was only Calhoun where I had to go to zip-codes to get a number. The rest had populations through the citi-data sites. And I decided, for now, to use the 5-year averages – by fixing on this before looking at future data it seems a little better than to look for a “best fit” each time.

And my apologies that these are running a little late – apart from some personal time demands, I took time this week to download all the state maps of the stations so that I will have those available for the rest of this initial series.
There are 18 USHCN stations in Louisiana, from Alexandria to Winnsboro, and there are two GISS stations, at Lake Charles and Shreveport, on the list. Looking for a source for the layout of the stations I find that I can get the Louisiana layout at the CO2 Science website.
 Location of the USHCN stations in Louisiana ( CO2 Science)
This site calculates a trend for the mean temperature data, but for the example I chose (Alexandria) it only goes up to 2006.
 Temperature trend for Alexandria LA (CO2 Science)
This is an interesting resource in that it saves me calculating the trends for the different stations. Since, at some time in the future, I had thought to move on from just the data to the trends, this will be a useful site to get that information. The question, however, is as to whether they are plotting the homogenized or raw data for the station?
 Alexandria LA GISS temperature plot (GISS )
 This is clearly not the same set of values, which means that there are two different homogenizations being carried out. (Note that this is recognized at the top of the CO2 Science plot). So that gives another little puzzle to look into. However, for today, it is sufficient that I have found another site that shows where the USHCN stations are in the state, so that we can get a measure of how well they are distributed.
So now I go to the GISS site (which again gives me some foreign location when I click on Louisiana) and pick Grand Coteau as being somewhere close to the middle of the state. This allows me to find the rest of the sites in the state, using the (*) facility to locate adjacent stations.
So first I download and convert the data, and discover that the GISS station at Lake Charles has only been in operation since 1948, which no longer comes as a surprise.
 Lake Charles average temperatures (GISS )
 On the other hand Shreveport has been reporting data since the 1880’s.
 Shreveport average temperatures (GISS)
And, in passing we note that Louisiana was warmer in the 1930’s than recently. So what does the data look like (bearing in mind that I am only working with the homogenized data at the moment) ?
The difference between the USHCN data set and the two GISS stations has been steadily increasing over the years:
 Difference between the average GISS station temperature and that of the average USHCN stations in Louisiana, over the past 115 years.
Looking at the actual average temperature change for the state:

Over the past 115 years the average state temperature has followed the pattern shown above for Alexandria, although the rate of temperature decrease is at a rate of around 0.05 degrees F per hundred years, which is sensibly saying that it has stayed the same. It is interesting that the visceral reaction of those who disagree is to suggest that this sample is too small, and thus meaningless – yet it is consistent with other states, and cumulatively these numbers start to gain importance.
Looking at the geographic information for Louisiana, it is a state that is 380 miles long and 180 miles wide. It runs from 89 deg W to 94 deg W, and from 29 deg N to 33 deg N. The center of the state is thus at 92.5 deg W and 31 deg N approx. The USHCN stations center on 91.6 deg W, 30.9 deg N. The GISS average is 93.5 deg W and 31.3 deg N. The average elevation of Louisiana is 30 m above sea-level, with the USHCN being at 24.4 m, and the GISS average being at 35.5 m. The highest point in the state is at 163 m.
So looking at how the temperatures are controlled by the geography, the correlation with Latitude is as expected.

And while there is a suggestion that the decline with change in longitude is significant, because of the changes in other states, I continue to consider that it, in reality, dependent to other factors.

The most likely is that of elevation, and, despite the relatively low-lying nature of the state, the correlation with elevation remains strong.

In regard to the population figures of the state, there was only Calhoun where I had to go to zip-codes to get a number. The rest had populations through the citi-data sites. And I decided, for now, to use the 5-year averages – by fixing on this before looking at future data it seems a little better than to look for a “best fit” each time.

And my apologies that these are running a little late – apart from some personal time demands, I took time this week to download all the state maps of the stations so that I will have those available for the rest of this initial series.
Read more!
Subscribe to:
Posts (Atom)

 Posts
Posts