It is difficult to see any positive interpretation of the changes and conflicts that are increasingly filling the headlines of the press. Fluctuating optimism over the return to credible export production from Libya, to take but one example, is no sooner reported when the news comes of increased fighting in Tripoli, including the international airport. At the same time violence is spreading towards Egypt. Without a strong central government it is likely that the conflicts in that country will continue into the foreseeable future, with continued negative impacts on the export of oil from the country.
Transient attempts to maintain a cease-fire and stabilize South Sudan have apparently failed again. The fighting has shut down local oil production, while overall production from South Sudan has been cut to 165 kbd.
Capital continues to leave Russia (h/t Nick) and that flight is only likely to accelerate as the tensions over the shooting down of the Malaysia Airlines plane continue to grow. Given that investment continues to be required to sustain Russian oil production against the current transition into decline, and that such cash is not being spent only magnifies the concern that Russian export decline will be faster and sooner than the world anticipates. (And given the critical value of Russian oil and gas exports to their economy – it provides about half the budget revenue - President Putin desperately needs a scapegoat to blame as the economic gains of the past, and future growth targets of over 5% become unrealistic dreams for that future).
With the emphasis on the daily events in all these countries (not forgetting Iraq) it is more difficult to discern the overall medium term impact that this is likely to have on oil availability, and consequently on oil and gas prices. Europe cannot function at current economic levels without the 30% of its energy that it gets from Russian natural gas, which has to be a big consideration as they discuss whether to impose more sanctions on Russia. While a recent Total study shows that, with Gazprom co-operation, Europe could cope if flows through Ukraine were stopped, without that co-operation the EU would not be able to adequately replace the lost fuel. And the conflict in Ukraine is unlikely to be resolved fairly soon, so the degree of co-operation that Western Europe can expect from Gazprom next winter is likely to lead to some fairly tense negotiations over the next few months.
One of the frustrations with watching TV pundits muse on this is that there seems to be an assumption that wells, pipelines and other necessary infrastructure will magically appear to provide immediate solutions should things start to get worse. One such today commented that President Putin is now in total control, since should the west decide not to take all of the Russian oil and natural gas that they currently consume, that he could immediately increase sales to China to replace the lost income.
That neglects the time that it is going to take to get the wells drilled in Siberia, the pipeline connections made and the receiving network in place to meet the current amount that has been sold. Even with the current agreement to increase Russian exports to China it is going to take some four years for the new gas to flow, and it took years for this agreement to be signed.
By the same token Europe can’t turn around and expect the US to be able to replace any significant amount of Russian natural gas for about a similar period of time. Facilities cannot be created overnight, and permitting and construction take finite amounts of time.
I would expect that, if anything, the price that is charged for Russian oil and gas is going to go up for the Europeans, even as the oil supply starts to decline. As Euan Mearns has noted all the significant producers of natural gas in Western Europe are seeing declines in production and while the fall last year was not that significant, overall the continued cumulative decline will make the need for Russian gas that more critical, given that the pipelines are in place to deliver it.
Unfortunately as oil and natural gas supplies continue to tighten, the natural consequence is going to be an increase in price. And this will, in turn, affect the economic growth of the different countries around the world. The current price has slowed economic growth, but as it continues to ratchet up then the impact on global growth will become rapidly obvious, although differentiated by country depending on how dependent they are on fuel imports.
Complacency within the United States, given the assumptions of indigenous supply availabilities, is likely to be shaken as internal oil supplies stop there unsustainable growth rates, while the current low prices for natural gas will disappear as the available funds for future wells reduce on the increasing evidence that most of these wells are unprofitable at current gas prices.
It is difficult – well, to be honest, impossible - for most of us to be able to see how almost any of the growing conflicts around the world can be resolved in any short-term period. The consequent impact on oil production in the countries of the Middle East and North Africa (MENA) is going to lead to a tightening of the surplus between available supply and demand, particularly at current levels. And, unfortunately, when economic circumstances grow colder political rhetoric gets hotter, and there is less chance for negotiation and diplomacy to resolve the situation.
The main surprise, at the moment, is how rapidly the situation is deteriorating in so many of the countries that supply oil and gas to the world. Sadly the headlines will only cover one or two of these at a time. As a result the overall trends are missed as headlines instead focus on the very small changes driven more by sentiment and political perspective than by the realities of the medium, and even short-term oil and gas supply situation.
Showing posts with label natural gas demand. Show all posts
Showing posts with label natural gas demand. Show all posts
Sunday, July 20, 2014
Friday, June 6, 2014
Tech Talk - what the EPA Plan neglects
One of the problems, I suspect, with predictions of future energy use and production is that physical reality can become entangled in the politics of the day. Thus news that tends to negate the optimistic views of future American oil and natural gas production is subsumed by the need to keep the level of those predictions hecause of other political needs.
President Obama has now announced his decisions on a new incentive to combat his perception of the future as it sits threatened by the increased carbon dioxide produced by the burning of fossil fuels, particularly coal. As announced by the EPA, the Clean Power Plan “will maintain an affordable, reliable energy system, while cutting pollution and protecting our health and environment.”
The proposed rule has the intent of lowering carbon dioxide emissions by 30% from the levels of 2005, by 2030. As with many energy-related plans this one will take some time to implement, particularly since individual states have some input to the final program that will be put in place. More to the point, it will influence the thinking of power generators and legislators over the next few years.
Beyond the actual implementation, the real impact will be in the planning departments of the utility companies around the country. There is at least an even chance that, at some time in the future, these will become the regulations that must be followed, and as future power plant construction is planned, so the options that will be considered will now be changed to accommodate these likely regulations.
Realistically the closure of coal-fired plants will likely be followed by the construction of more natural gas plants, since the overall electrical energy needs of the country are unlikely to fall significantly. In the short term this is unlikely to be a problem. However as one moves into the intermediate term (say more than 5 years out) the old plants will have gone, and the country will become increasingly dependent on natural gas, in the same way as Europe is at present. As the old coal plants are demolished, they, and the coal mines that supply them, cannot be resurrected within a five-year period given the amount of permitting, financing and overall planning that is now required for such construction.
Natural gas has advantages over coal, in that it can be supplied by pipeline that makes it less susceptible to weather. But by the same token it is rarely stored on site, but metered along the pipeline as demand rises and falls. As history has shown, this can lead to critical shortages when, at times of high demand, the pipeline cannot keep up with demand.
At present the likelihood of problems seems remote, wells continue to be sunk and production in increasing in fields around the country. But if one goes beyond the picture that is projected as reassurance to those concerned for energy supply in the future the numbers revealed are not that comforting.

Figure 1. The changing picture of natural gas demand (EIA)
One begins with the prediction that the US has about 100 years of natural gas supply with a total extractable volume in reserves and resources of over 2,718 Tcf. It is a reassuring number but, as with the total volumes of either oil or coal in the ground, it does not really give that much information on what will be available as demand continues to rise.
Consider that, increasingly, the volumes of natural gas that are being sought are in shales, where the well must turn and drill along the shale horizon, before being fracked to produce gas and oil within the rock.

Figure 2. Number of rigs defined by type of well (Baker Hughes via EIA and Penn Energy)
The increasing dominance of horizontal well completions brings with it a considerable increase in well costs. You can see this as the technique became of increasing importance after 2005.

Figure 3. Change in the average cost of natural gas wells (EIA )
Well construction prices have continued to rise since that time, with numbers now running up to and beyond $10 million. The rising costs makes it harder to achieve a reasonable return on that investment, particularly as there has been no great increase in the overall price of natural gas to reflect its increased popularity, in large part because of the rush to drill and produce the known reserves.

Figure 4. Recent changes in natural gas prices (EIA )
As a result the number of rigs working in the natural gas fields has fallen, to the lowest levels of the recent past.

Figure 5. Change in the natural gas rig count over the past year. (Baker Hughes )
If you can’t make a profit on the merchandise, then after a while you stop trying to produce it. Despite the optimism that leads folk to anticipate large volumes of low-priced natural gas being able to sustain us into the foreseeable future if the companies cannot make a profit, after a while they stop. Which means that prices will go up, re-opening the cycle, but on a higher step. In time this will bring natural gas prices back up to around $8.00 per tcf, which will make the industry more comfortable.
What it will not do, however, will be to favorably impact the economics of the electricity business, where doubling the cost of fuel has a quite negative effect on prices and overall economics. But concerns over the rising price to be paid has had little impact yet on political decisions on energy in Europe, and one has to presume that a similar blindness to energy price consequences will also prevail in the United States. After all there is lots of natural gas around, it just has to be perceived as remaining a cheap fuel to validate the political plans . . .right ??!!
Read more!
Wednesday, May 8, 2013
OGPSS - The dangers of complacency
Perceptions based, perhaps on too small a collection of information, can lead into opinions that, on investigation, turn out to be incorrect. Just recently a couple of friends had mentioned that charities that they are associated with were seeing a decline in donations. I built this into a picture of the general public being less able to afford earlier levels of giving, perhaps because of the continued impact of higher costs of fuel. The perception is, however, as a general statement wrong, and (Via the National Park Service from The Giving Institute I learn that:
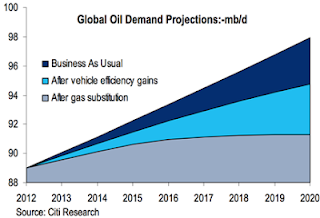
Figure 1. Projected changes in global oil demand from Citi Commodity Researchers)
This anticipation of future gains in efficiency of use is a common thread to pictures of the future from the three major oil companies that I recently reviewed. All three, ExxonMobil, Shell and BP expect that energy efficiency gains will have a major impact on demand. BP, for example, anticipates that through 2030 energy demand will increase 36%, but that without this improvement in efficiency global energy would have to double by 2030.
One of the problems in assessing the changes in efficiency over time is that, when looking at the past decade, one has to recognize the significant impact of the recession. For example, the Odyssee project looked at energy use in Europe and clearly showed the impact of the recession on demand.

Figure 2. Changes in electricity use in the countries of Europe following the start of the recession. (Odyssee)
What also caught my attention in looking where most of the energy savings were occurring was that it was in countries catching up to Western Europe, rather than in the more established West, and that when the overall savings are totaled these appear to have slowed significantly.

Figure 3. Overall energy savings in the EU relative to a 2000 baseline (Odyssee)
The second problem with the curve that Citi projects lies in the rate at which vehicles are switched from diesel and gasoline to natural gas power. There is currently an economic incentive in parts of the world to make this change, it currently sells at around the equivalent of $2.10/gallon in the USA. Yet it requires both infrastructure and an investment of capital to make the change at any level of significance. Nevertheless it remains a key ingredient of the Pickens Plan that Boone Pickens has been selling around the country for a number of years now.
The fact that Clean Energy Fuels can list all 22 stations that added natural gas pumps along the “Natural Gas Highway” in the November-January period, does not indicate a great rush to build that infrastructure. It is easier to change the local distributor networks, with companies such as Waste Management indicating that they will use CNG in 80% of their new trucks, than it is to see the rapid change of the longer distance haulers, and for passenger vehicles. A recent article in the Washington Post noted that only 20,381 vehicles ran on natural gas of the 14.5 million new cars and trucks sold last year. Further not only does a CNG vehicle cost more to purchase, it also has a lower range, although for some applications that may not be much of a handicap.

Figure 4. Average Annual Vehicle miles travelled by category (Alternate Fuels Data Center )
Yet, at the moment, it is the use of ethanol that is having the most impact on alternate fuel use. Other than that there has been little indication of much change in the market.

Figure 5. Alternate Fuel Vehicles in use from 1995 to 2010. (Alternate Fuels Data Center )
And in this regard Europe has also seen little movement toward the use of natural gas, in contrast with the use of biofuels, and neither has made large gains.

Figure 6. Comparative penetration of liquid fuels market in Europe by biofuels and natural gas (Odyssee)
The problem, of course, is that if these improvements in efficiency and switches to alternate fuels do not occur, then the demand will continue along the Business-As-Usual line, and, as BP forecasts, demand will double by 2030.
The question as to what will be available to meet that enhanced demand remains one of the great imponderables that folk seem, again, unwilling to face. Certainly with a steadily increasing demand, and the constraints on supply that these pages have continued to document over the years, it becomes very difficult to see how price stability can be maintained, where demand exceeds supply at a given price. The problems that this will bring, particularly those nations that now subsidize fuel, a policy that is unlikely to change in Asia, are likely to be major. Yet for countries such as India, which last year has spent the allocated fuel subsidy budget for the year by the end of July the political costs of change remain very high and could well remain in place until the financial burden becomes intolerable. Unfortunately, with the current complacency, at that point it will then be too late to start searching for alternate answers.
Americans gave more than $298.42 billion in 2011 to their favorite causes despite the economic conditions. Total giving was up 4 percent from $286.91 in 2010. This slight increase is reflective of recovering economic confidence.In the perception that is becoming increasingly prevalent on the future of energy supplies, and particularly crude oil, the current adequacy of supply is projected forward to anticipate no problems with supply in the future. Peak oil is now being suggested to occur, not because the supply is limited, but because, with the increasing use of renewable energy, demand will peak, and then decline. Bloomberg New Energy Finance founder Michael Liebreich is quoted as projecting that the growth in fossil fuel use will almost stop by 2030, while Citi Commodity Researchers are suggesting that the increases in prices will drive increases in efficiency that will bring a peak in oil demand “much sooner than the market expects.”
The greatest portion of charitable giving, $217.79 billion, was given by individuals or household donors. Gifts from individuals represented 73 percent of all contributed dollars, similar to figures for 2010.

Figure 1. Projected changes in global oil demand from Citi Commodity Researchers)
This anticipation of future gains in efficiency of use is a common thread to pictures of the future from the three major oil companies that I recently reviewed. All three, ExxonMobil, Shell and BP expect that energy efficiency gains will have a major impact on demand. BP, for example, anticipates that through 2030 energy demand will increase 36%, but that without this improvement in efficiency global energy would have to double by 2030.
One of the problems in assessing the changes in efficiency over time is that, when looking at the past decade, one has to recognize the significant impact of the recession. For example, the Odyssee project looked at energy use in Europe and clearly showed the impact of the recession on demand.

Figure 2. Changes in electricity use in the countries of Europe following the start of the recession. (Odyssee)
What also caught my attention in looking where most of the energy savings were occurring was that it was in countries catching up to Western Europe, rather than in the more established West, and that when the overall savings are totaled these appear to have slowed significantly.

Figure 3. Overall energy savings in the EU relative to a 2000 baseline (Odyssee)
The second problem with the curve that Citi projects lies in the rate at which vehicles are switched from diesel and gasoline to natural gas power. There is currently an economic incentive in parts of the world to make this change, it currently sells at around the equivalent of $2.10/gallon in the USA. Yet it requires both infrastructure and an investment of capital to make the change at any level of significance. Nevertheless it remains a key ingredient of the Pickens Plan that Boone Pickens has been selling around the country for a number of years now.
The fact that Clean Energy Fuels can list all 22 stations that added natural gas pumps along the “Natural Gas Highway” in the November-January period, does not indicate a great rush to build that infrastructure. It is easier to change the local distributor networks, with companies such as Waste Management indicating that they will use CNG in 80% of their new trucks, than it is to see the rapid change of the longer distance haulers, and for passenger vehicles. A recent article in the Washington Post noted that only 20,381 vehicles ran on natural gas of the 14.5 million new cars and trucks sold last year. Further not only does a CNG vehicle cost more to purchase, it also has a lower range, although for some applications that may not be much of a handicap.

Figure 4. Average Annual Vehicle miles travelled by category (Alternate Fuels Data Center )
Yet, at the moment, it is the use of ethanol that is having the most impact on alternate fuel use. Other than that there has been little indication of much change in the market.

Figure 5. Alternate Fuel Vehicles in use from 1995 to 2010. (Alternate Fuels Data Center )
And in this regard Europe has also seen little movement toward the use of natural gas, in contrast with the use of biofuels, and neither has made large gains.

Figure 6. Comparative penetration of liquid fuels market in Europe by biofuels and natural gas (Odyssee)
The problem, of course, is that if these improvements in efficiency and switches to alternate fuels do not occur, then the demand will continue along the Business-As-Usual line, and, as BP forecasts, demand will double by 2030.
The question as to what will be available to meet that enhanced demand remains one of the great imponderables that folk seem, again, unwilling to face. Certainly with a steadily increasing demand, and the constraints on supply that these pages have continued to document over the years, it becomes very difficult to see how price stability can be maintained, where demand exceeds supply at a given price. The problems that this will bring, particularly those nations that now subsidize fuel, a policy that is unlikely to change in Asia, are likely to be major. Yet for countries such as India, which last year has spent the allocated fuel subsidy budget for the year by the end of July the political costs of change remain very high and could well remain in place until the financial burden becomes intolerable. Unfortunately, with the current complacency, at that point it will then be too late to start searching for alternate answers.
Read more!
Monday, April 8, 2013
OGPSS - Shell looks to the future
Each year the larger oil production companies provide their views of the future, and I recently reviewed that for ExxonMobil. Shell has now produced their projections, though in a somewhat different format as the document “New Lens Scenarios” which deals with future projections as a set of differing options. That does not make these views less informative.
In reviewing where the world will go, Shell looks more to political impact as the future unrolls. They see the European Union stuck in a Trapped Transition” where:
The document is very much slanted as a Socio-political forecast, with considerable polemic in regard to the weaknesses that the company perceives to exist in the West.
Shell postulate two different scenarios for the future. There is the Mountain scenario, where business continues very much as usual, and then there is an Oceans scenario where the” powers that are” work toward a more accommodative approach to those in the developing world, and the less fortunate layers of society.
The document begins with the impact if the Mountain scenario is to prevail, driven through a top down control, largely through existing institutions. Shell is not enamoured of this:

Figure 1. Shell projection of future energy supply, through 2060 under the Mountain scenario. (Shell)
N.B. All the illustrations come from the Shell New Lens Scenarios document.
Shell anticipates that hydrogen, an up and comer just a few years ago, and now largely neglected, will undergo a “phoenix-like” resurrection and find a market both in industrial and transportation as an alliance of government and private industry push a hydrogen infrastructure post-2020. They anticipate that the use of liquid fuels for passenger road transport will peak in 2035, and that by 2070 the global passenger transportation network, using roads, could be nearly oil-free, as hydrogen and electric powered vehicles take over.

Figure 2. Shell future projection of vehicular fuel sources.
The energy burden will transfer from crude oil to natural gas, which will increasingly underpin the global economies, as China joins the top tier of natural gas producers.

Figure 3. Sources of liquid fuels through 2060 (Shell)
The increase in the volumes of natural gas that become available from tight shales and coalbed sources are sufficient that, by 2035 Shell anticipates that natural gas will not only displace crude oil as the primary transportation fuel, but that it will also encourage a robust pretrochemical industry based on methane. Shell sees the possibility of US energy self-sufficiency in the 2030’s as peak oil theories are abandoned.
The availability and broad use of natural gas will also allow time for credible carbon capture and sequestration technology to be developed and demonstrated, so that by the time that coal is needed as a fuel (around 2075) it will be usable while sustaining the zero-carbon dioxide levels for electricity generation that become widespread by 2060.
In the alternative Oceans scenario, the more accommodative approach, Shell looks to a willingness to share technology and compromise on issues of ownership and profit as a way of encouraging globalization and developing productivity. Societal interconnectivity is encouraged by greater use of the Web, and this leads to significant changes, with existing leaderships yielding to allow a broadening of governance and significant reform. The greater spread of information and connectivity makes for the more fluid nature of geopolitics that names the scenario, as increasing populism is both a source of innovation and a challenge to stability. Populism is seen as a challenge to US dominance, and is considered likely to cause “destructive and violent reactions” as globalization progresses.
This progress is seen as most likely to through technological interconnection between entities that creates a new class of Mandarin who is less accountable to traditional masters. In this scenario Shell see the world increasingly run by more flexible, and decentralized governments “that have embraced radical pathways to economic sustainability”. And this includes both the United States and China. In this regard they quote the work of Anne-Marie Slaughter of Princeton on a New World Order.
This change from the current business-as-usual (BAU) model has an impact on fuel availability and use. The encouragement of entrepreneurship is seen to significantly increase the penetration of solar power into the energy mix, while sustaining the era in which crude oil contributes beyond that of the Mountains scenario.

Figure 4. Energy Sources under the Oceans scenario projected by Shell.
In comparison with the projections under the BAU natural gas is less of a player, though Shell don’t explain either where the additional oil will come from, or why the rush to invest in natural gas is turned off. They anticipate that the reliance on hydrocarbons will cause a rise in price that will open the door to new resources and technologies, particularly with solar power.
In this future Shell sees the developing world taking more of the energy pie, yet transitioning rapidly into a lighter industrial society, with a large service component. (One wonders where the necessary heavy industry goes, as it also transitions to become 80% more efficient?) Heat pumps become a widespread domestic unit, with their benefits in energy efficiency. And, in order to sustain their market share, internal combustion engines become increasingly efficient and technically advanced. While crude oil use will increase until the 2040’s, beyond that time the increased use of biofuels will allow liquid fuel dominance to continue in vehicular use. There are two main sources for these biofuels, first generation fuels, mainly sugar based ethanol, which will contribute some 4 mbd by 2050, and second generation biofuels from non-food crops which come to dominate beyond that time. As this transition occurs so traditional biomass use will disappear by the end of the century.
The different consequences of the two scenarios, as they impact fuel sources, and the unconventional nature of the Shell answers to “where will the resource come from” is shown in two plots that summarize the two energy futures.

Figure 5. Energy sources of the future, as seen by Shell under two different scenarios – Mountains and Oceans.
Under the BAU Mountain view the additional required energy will come in the natural gas side of the house, with Methane Hydrates being the major new source of fuel. With the competing Oceans scenario the energy comes from the development of kerogen from the oil shales of Colorado, Wyoming and Utah. By the end of the century renewable energy will supply more than half the electricity demand around the world, with solar carrying the greatest share of this. However they do not see the electricity generating industry becoming carbon neutral until the 2090’s, as CCS penetrates the industry.

Figure 6. Shell’s view of electricity power sources by 2100.
Shell foresee that the problems of energy storage (80% of the solar power in many OECD countries is generated in the summer) will be overcome through the use of electrolysis and the storage of the resulting hydrogen.
There is much to debate over the basis on which Shell have derived the scenarios that form this report. It remains more optimistic about the oil and gas futures that I can find a basis for accepting, but nevertheless it is well worth reading as it provides two views of what might come about. The impact of societal pressures and drivers produce two different energy futures, and while I suspect that reality will be quite different, with “unknown unknowns” having great influence, the effort is worthwhile.
In reviewing where the world will go, Shell looks more to political impact as the future unrolls. They see the European Union stuck in a Trapped Transition” where:
the ‘can’ keeps being ‘kicked down the road’ while leaders struggle to create some political and social breathing space. so there is continuing drift, punctuated by a series of mini-crises, which will eventually culminate in either a reset involving the writing off of sign and political capital (through pooling for example) or the euro unravelling.On the other hand countries such as China and Brazil are resilient:
in their different ways, they had the financial, social, political, or resource ‘capital’ to respond and reform, following a room to Manoeuvre pathway.Within the next thirty years, as the population grows, so a greater percentage, up to 75%, will live in cities. And these will consume a greater fraction of the global energy supply, perhaps as high as 80%, up from the current 66%.
The document is very much slanted as a Socio-political forecast, with considerable polemic in regard to the weaknesses that the company perceives to exist in the West.
Shell postulate two different scenarios for the future. There is the Mountain scenario, where business continues very much as usual, and then there is an Oceans scenario where the” powers that are” work toward a more accommodative approach to those in the developing world, and the less fortunate layers of society.
The document begins with the impact if the Mountain scenario is to prevail, driven through a top down control, largely through existing institutions. Shell is not enamoured of this:
In the US, for example, income and wealth inequality continue to increase, with stagnating middle-class earnings, reduced social mobility, and an allegedly meritocratic higher education system, generously supported by tax exemptions, whose main beneficiaries are the children of the successful. superimposed on this class divide is an increasingly serious intergenerational divide, as commitments to the elderly via entitlement programmes crowd out discretionary expenditures that could rebuild economic and social infrastructure. Similarly, in Europe an ageing population and commitments to high levels of entitlement, which are frequently underfunded, create a mixture of social and political strains that deflect attention from the core structural economic issues facing the region.Driven by this gloomy picture of the future Shell anticipate that global GDP growth through the 2030’s will average under 2%. This will, in turn, moderate the growth in energy demand. Increasing urbanization, the growth of the service sector and the greater use of electricity in developing countries, Shell anticipate that the strong correlation between economic and energy demand growth will be broken.

Figure 1. Shell projection of future energy supply, through 2060 under the Mountain scenario. (Shell)
N.B. All the illustrations come from the Shell New Lens Scenarios document.
Shell anticipates that hydrogen, an up and comer just a few years ago, and now largely neglected, will undergo a “phoenix-like” resurrection and find a market both in industrial and transportation as an alliance of government and private industry push a hydrogen infrastructure post-2020. They anticipate that the use of liquid fuels for passenger road transport will peak in 2035, and that by 2070 the global passenger transportation network, using roads, could be nearly oil-free, as hydrogen and electric powered vehicles take over.

Figure 2. Shell future projection of vehicular fuel sources.
The energy burden will transfer from crude oil to natural gas, which will increasingly underpin the global economies, as China joins the top tier of natural gas producers.

Figure 3. Sources of liquid fuels through 2060 (Shell)
The increase in the volumes of natural gas that become available from tight shales and coalbed sources are sufficient that, by 2035 Shell anticipates that natural gas will not only displace crude oil as the primary transportation fuel, but that it will also encourage a robust pretrochemical industry based on methane. Shell sees the possibility of US energy self-sufficiency in the 2030’s as peak oil theories are abandoned.
The availability and broad use of natural gas will also allow time for credible carbon capture and sequestration technology to be developed and demonstrated, so that by the time that coal is needed as a fuel (around 2075) it will be usable while sustaining the zero-carbon dioxide levels for electricity generation that become widespread by 2060.
In the alternative Oceans scenario, the more accommodative approach, Shell looks to a willingness to share technology and compromise on issues of ownership and profit as a way of encouraging globalization and developing productivity. Societal interconnectivity is encouraged by greater use of the Web, and this leads to significant changes, with existing leaderships yielding to allow a broadening of governance and significant reform. The greater spread of information and connectivity makes for the more fluid nature of geopolitics that names the scenario, as increasing populism is both a source of innovation and a challenge to stability. Populism is seen as a challenge to US dominance, and is considered likely to cause “destructive and violent reactions” as globalization progresses.
This progress is seen as most likely to through technological interconnection between entities that creates a new class of Mandarin who is less accountable to traditional masters. In this scenario Shell see the world increasingly run by more flexible, and decentralized governments “that have embraced radical pathways to economic sustainability”. And this includes both the United States and China. In this regard they quote the work of Anne-Marie Slaughter of Princeton on a New World Order.
This change from the current business-as-usual (BAU) model has an impact on fuel availability and use. The encouragement of entrepreneurship is seen to significantly increase the penetration of solar power into the energy mix, while sustaining the era in which crude oil contributes beyond that of the Mountains scenario.

Figure 4. Energy Sources under the Oceans scenario projected by Shell.
In comparison with the projections under the BAU natural gas is less of a player, though Shell don’t explain either where the additional oil will come from, or why the rush to invest in natural gas is turned off. They anticipate that the reliance on hydrocarbons will cause a rise in price that will open the door to new resources and technologies, particularly with solar power.
In this future Shell sees the developing world taking more of the energy pie, yet transitioning rapidly into a lighter industrial society, with a large service component. (One wonders where the necessary heavy industry goes, as it also transitions to become 80% more efficient?) Heat pumps become a widespread domestic unit, with their benefits in energy efficiency. And, in order to sustain their market share, internal combustion engines become increasingly efficient and technically advanced. While crude oil use will increase until the 2040’s, beyond that time the increased use of biofuels will allow liquid fuel dominance to continue in vehicular use. There are two main sources for these biofuels, first generation fuels, mainly sugar based ethanol, which will contribute some 4 mbd by 2050, and second generation biofuels from non-food crops which come to dominate beyond that time. As this transition occurs so traditional biomass use will disappear by the end of the century.
The different consequences of the two scenarios, as they impact fuel sources, and the unconventional nature of the Shell answers to “where will the resource come from” is shown in two plots that summarize the two energy futures.

Figure 5. Energy sources of the future, as seen by Shell under two different scenarios – Mountains and Oceans.
Under the BAU Mountain view the additional required energy will come in the natural gas side of the house, with Methane Hydrates being the major new source of fuel. With the competing Oceans scenario the energy comes from the development of kerogen from the oil shales of Colorado, Wyoming and Utah. By the end of the century renewable energy will supply more than half the electricity demand around the world, with solar carrying the greatest share of this. However they do not see the electricity generating industry becoming carbon neutral until the 2090’s, as CCS penetrates the industry.

Figure 6. Shell’s view of electricity power sources by 2100.
Shell foresee that the problems of energy storage (80% of the solar power in many OECD countries is generated in the summer) will be overcome through the use of electrolysis and the storage of the resulting hydrogen.
There is much to debate over the basis on which Shell have derived the scenarios that form this report. It remains more optimistic about the oil and gas futures that I can find a basis for accepting, but nevertheless it is well worth reading as it provides two views of what might come about. The impact of societal pressures and drivers produce two different energy futures, and while I suspect that reality will be quite different, with “unknown unknowns” having great influence, the effort is worthwhile.
Read more!
Friday, March 22, 2013
OGPSS - The EXXonMobil future - a review
It is the time of year when the major oil companies issue their predictions for the future, and h/t Art Berman, ExxonMobil just released their view of the world, looking forward to 2040. And this is downloadable. If I remember correctly, I first viewed their future projections back in 2011, and with a 2-year step it might be more interesting to see how differences in their world view have evolved in that period.
By 2040 EM anticipates that the global population will be approaching 9 billion, up by around 25% from current numbers. Of that nearly 2 billion additional folk most are expected to be born in the developing countries such as India and in Africa, with the former gaining 300 million and the latter 800 million. Because the majority of the growth occurs in these countries, and the improvement in living standards and working conditions are more energy intensive, (whether air conditioning or iPhones) from a lower base and demand growth is concentrated more in electrical energy demand than that of transportation fuels.
EM continues to believe that, while the economies of the OECD nations will contribute significantly to global growth, with economic output increasing by 80% over the 27-year period, energy demand will remain stable. Growth in demand for power will come from the rest of the world, powering an average 2.8% growth in the global economy over that interval.
Perhaps the greatest change has been in the amount of energy that the company anticipates will not now be needed in that future, as improving energy efficiency cuts back the amount that must be supplied. If we look at the energy projections through 2030 that were made by BP and EM back in 2011, the total growth was expected to continue in an almost linear mode through 2030.

Figure 1. Projections of growth from BP and EM in 2011, looking to 2030.
If one now looks at the shape (the units differ) of the new EM curve there is a dramatic emphasis on a continued improvement in energy efficiency particularly as we get further into the out years. (Note the remaining illustrations all come from the EM document “The Outlook for Energy: A View to 2040”).

Figure 2. Current EM projections for global energy demand in the years to 2040.
The report breaks down the growth in demand into several sectors. And this, at first, is a little irritating. The reason is that, in describing, for example, the growth in residential/commercial energy demand, the track-back on the power sources stops at the point where electric current comes out of the wall. Given that it is the growth in electricity consumption, projected to grow overall by 85%, that is the greatest contributor over the period this is a little disingenuous. Now it is true that there is a whole section devoted to electricity generation, but the lack of the source fuel portrays a little bit of sleight of hand.

Figure 3. Projected residential/commercial energy growth through 2040, by power source.
There is a similar restriction in source categories for the suppliers of industrial power:

Figure 4. Projected residential/commercial energy growth through 2040, by power source.
However, as recognized, the document does have a chapter that deals with the generation of electrical power. EM anticipate that coal will continue to gain market until 2025, but from that point forward, its share will decline as the main competitors, renewables, nuclear and natural gas take an increasing part of the supply.

Figure 5. Change in the source of electrical power and its growth.

Figure 6. The breakdown of electric power fuel sources between OECD and non-OECD countries
One of the reasons for the change, particularly the change to natural gas from coal, comes with the increasing burden of carbon costs, as EM projects.

Figure 7. Anticipated fuel source costs for electricity in 2030.
The low price that is anticipated to continue for natural gas makes it therefore the growth fuel, as figure 5 suggests. When this is combined with the anticipated changes in liquid fuels for transportation, which will see a 40% growth overall, with heavy duty transportation showing the greatest growth, investors in oil and natural gas should be reassured. Cars are expected to achieve an average performance of 47 mpg, which is achieved with the anticipated mix being:

Figure 8. The anticipated growth in automobile performance through the years
Nevertheless the increasing growth of personal transportation in the developing countries is expected to continue to increase demand for oil. With the growth in power generation from natural gas, the two combine to paint a glowing picture of the future of the hydrocarbon industry.
EM project that overall the demand for liquid fuels will rise to 113 million barrels of oil equivalent (mboe) per day by 2040, a 30% growth over 2010 with most of the demand remaining with the transportation needs. The company seems comfortable with industry being able to achieve that level of supply, although the mix will change considerably from that which currently prevails.

Figure 9. Change in the liquid fuel sources that are anticipated over the coming years.
And it is here that I fear that the report becomes overly optimistic. By looking at the relative size of the remaining resource, relative to the production achieved to date, EM foresee no problem in providing the supply targets that are shown in the above figure. EM expect that technical innovation will continue to dramatically improve production from the United States and North America in total. Supply growth is anticipated from tight oil in places such as the Bakken, Deepwater from the Gulf and the tar sands. They project that these will combine to lift North American total liquids production by another 40%. When the production from the offshore Brazilian fields and the heavy oil sands of Venezuela are added, then this reinforces the view that they hold of an achievable target.

Figure 10. Growth in supply of liquid fuels in North America
Yet it is in the Middle East, a region they hardly discuss, that they see the largest growth.

Figure 11. Sources of future growth in liquid fuel supply.
EM don’t actually say where that great growth is likely to come from, but it is very likely heavily weighted towards the most optimistic of estimates for the future production of Iraq, with the ongoing turmoil of the “Arab Spring” being totally discounted.
Well it makes a nice pipe dream, as, I’m afraid, is their anticipation that industry will be able to produce and distribute the target volumes of natural gas that they anticipate will come to save us all from the increasingly higher costs of power. Dare one gently cough and mutter "decline rates"?
If I can put it another way. At the beginning of the report, after projecting a reasonable estimate of global growth over the next 25 years, EM put in a very optimistic level of improvement in energy efficiency in order to significantly lower energy demand. Then, to balance supply to that lower level of demand, they seem to have picked the most optimistic of assumptions about potential growths in that supply. I rather suspect that they are seeing the writing on the wall, but obfuscating it with optimism beyond the bounds of realistic expectation.
Read more!
Friday, July 8, 2011
Biofuel in the air and expensive gas on the ground
There are a couple of items in the news today this week that mark the face of a changing world of energy supply. Of the two the increasing problems that the United Kingdom are facing with maintaining a viable energy program into the future is being marked with an escalating cost and the need for politicians to begin walking back from some of their previous statements. The other is the decision by Lufthansa to use a biofuel mix as a regular fuel for scheduled flights. The latter decision is a little more complex than it first appears, since the logistics of supplying the fuel mean that the aircraft (which will fly the Hamburg to Frankfort route) will only be fueled at one airport, and – to facilitate the monitoring of maintenance and other possible impacts – only a single plane will initially be involved in the trials., which will go on for six months. The testing can now begin since the standards for the fuel have now been approved by ASTM.
In the United States there have been single plane flight trials, with the “Green Hornet” (flight video ) using a mix that included camelina oil .
Turning from the good to the rather more worrying topic, the British gas industry is in the process of raising natural gas prices by some 18%, which also feeds through into the price that they charge for the electricity generated by the gas, and also supplied to customers. This is occurring at the same time as a report from a British car insurance firm has concluded that the increased price of gasoline (petrol) in the UK has driven some 1.3 million people (out of 31 million registered drivers) off the road, with the cost of car operation reaching $4,800 a year. This is an increase of over 20% in a year, and when taken with the rising price of natural gas is an illustration of the costs that are being incurred as the UK moves more strongly from an exporting to a fuel importing nation.
The U.K. Government is beginning to realize that, without a sufficient domestic resource, they are constrained to pay what the rest of the global community decides is a proper price for their fuel. The UK Government is putting forward a plan that will increase the emphasis on nuclear power and renewable sources of power. The problem is that, to comply with EU rules, the UK is going to have to close a quarter of its generating capacity this decade. The eight nuclear power stations that it is now anticipating private industry will build (though there is some doubt) won’t come on line until perhaps 2025.
 Possible Nuclear Power Station locations in the UK (LSE )
In the interim the problems to the consumer of the rising price of natural gas is perhaps being reflected in the same way as it was for gasoline, namely a reduction in demand. In the first quarter of this year, while coal use rose (albeit with two-thirds of the supply imported) by 7%,, the demand for gas fell 20%. Renewable energy sources increased supply by 27% but this should be placed in the context that the overall contribution from renewables was only 3.3% in 2010. Demand has been met by coal
However the first large solar farms in the UK are now on line, although with a combined output of 2.4 MW they are not likely to have much impact on overall supply.
That lesson (of increasing prices costing politicians their popularity) has already been cited as one reason for the release of oil from the Strategic Oil Reserve in the United States. Unfortunately it would appear that this release, coming with the increase in demand that I have referred to earlier, has not had the hoped for impact on oil prices. And, equally unfortunately, that action is still some months before the elections of next year.
The British experience is beginning to show that demand can be curtailed by price, but that still requires that there be an adequate supply to meet such demand. The problems with finding reliable power sources by 2015 for the British electricity suppliers is beginning to become evident and will likely further influence political popularity there. But the UK does not have to hold a national election for some years. That is not the case in the United States, even though the prices of gasoline and natural gas are still well below that of Europe, but where the public is more sensitive to those numbers, and where the elections are a whole lot sooner.
After blending with conventional jet fuel, new lubricity, distillation and composition requirements in D7566 must also be met. As a result, the blended jet fuel used in the airplane is essentially identical to conventional jet fuel and does not differ in performance or operability.The biofuel will be supplied by Neste Oil, which has declared a target of 2 million tons (around 40,000 bd) of jet fuel by 2020. Given that this is a 50:50 fix of biofuel and kerosene to meet the above standard, lowers the volume of biofuel needed, with the source described as:
Produced by hydrotreating renewable raw materials, NExBTL aviation fuel is compatible with all aircraft engines currently in use. Production is based on Neste Oil's proprietary technology, which can make use of a flexible range of various types of vegetable oil and waste-based inputs, such as animal fat from the food industry. Neste Oil is committed to only using verifiably sustainable and fully traceable raw materials that can be tracked all the way back to the original source.
In the United States there have been single plane flight trials, with the “Green Hornet” (flight video ) using a mix that included camelina oil .
Turning from the good to the rather more worrying topic, the British gas industry is in the process of raising natural gas prices by some 18%, which also feeds through into the price that they charge for the electricity generated by the gas, and also supplied to customers. This is occurring at the same time as a report from a British car insurance firm has concluded that the increased price of gasoline (petrol) in the UK has driven some 1.3 million people (out of 31 million registered drivers) off the road, with the cost of car operation reaching $4,800 a year. This is an increase of over 20% in a year, and when taken with the rising price of natural gas is an illustration of the costs that are being incurred as the UK moves more strongly from an exporting to a fuel importing nation.
The U.K. Government is beginning to realize that, without a sufficient domestic resource, they are constrained to pay what the rest of the global community decides is a proper price for their fuel. The UK Government is putting forward a plan that will increase the emphasis on nuclear power and renewable sources of power. The problem is that, to comply with EU rules, the UK is going to have to close a quarter of its generating capacity this decade. The eight nuclear power stations that it is now anticipating private industry will build (though there is some doubt) won’t come on line until perhaps 2025.
 Possible Nuclear Power Station locations in the UK (LSE )
 In the interim the problems to the consumer of the rising price of natural gas is perhaps being reflected in the same way as it was for gasoline, namely a reduction in demand. In the first quarter of this year, while coal use rose (albeit with two-thirds of the supply imported) by 7%,, the demand for gas fell 20%. Renewable energy sources increased supply by 27% but this should be placed in the context that the overall contribution from renewables was only 3.3% in 2010. Demand has been met by coal
Power companies have been benefiting from local coal production, however, with the small but active number of British facilities recording a 31% increase in output in the first quarter. Deep-mined coal showed an 80% rise as stocks were depleted due to demand from the utilities.The problem, unfortunately, remains that the coal-fired power stations are going to be pulled off-line soon, and so the cheaper coal-fired power will not be available, and (providing that there are power stations available) the reliance on natural gas will continue to drive prices higher, which is likely to be increasingly unpopular with the British public.
However the first large solar farms in the UK are now on line, although with a combined output of 2.4 MW they are not likely to have much impact on overall supply.
That lesson (of increasing prices costing politicians their popularity) has already been cited as one reason for the release of oil from the Strategic Oil Reserve in the United States. Unfortunately it would appear that this release, coming with the increase in demand that I have referred to earlier, has not had the hoped for impact on oil prices. And, equally unfortunately, that action is still some months before the elections of next year.
The British experience is beginning to show that demand can be curtailed by price, but that still requires that there be an adequate supply to meet such demand. The problems with finding reliable power sources by 2015 for the British electricity suppliers is beginning to become evident and will likely further influence political popularity there. But the UK does not have to hold a national election for some years. That is not the case in the United States, even though the prices of gasoline and natural gas are still well below that of Europe, but where the public is more sensitive to those numbers, and where the elections are a whole lot sooner.
Read more!
Thursday, January 13, 2011
TWIP, STEO and the prediction of natural gas and oil numbers
A quick glance to see what is new with this week’s “This Week in Petroleum” (TWIP) reminds me that this is the time when the EIA put out a new Short Term Energy Outlook (STEO), which gives their forecast for the happenings the next couple of years. Most particularly it looks at the way supply and demand will play out.
The first thing that caught my eye was the projection that natural gas prices will be (Henry Hub) $4.02 per million Btu (which is as near as need be a thousand cubic feet, which I will use for ease of comparison). This is $0.37 lower than the 2010 average, though they expect it to rebound to $4.50 by 2012. With the bitter cold in parts of the country at the moment (including here) natural gas is currently at $4.55, with $4.53 reported for February futures. It should be remembered that this is not the spot price – which was $17.04 in Florida on Wednesday. Contrast this with the $3.40 price from the Kern River pipeline that goes from Utah to California.
The concern with this relatively low price, going forward, is that it underscores the fragility of the companies producing natural gas from the gas shales around the country. For while there is a constant barrage of optimism about the amount of natural gas that is present in those fields, companies have to make a significant profit over the cost of production if that gas is to reach the market. I don’t see that ability in this sustained price.
There is currently a bit of a row going on in the UK about the state of preparedness of the UK Government for this very cold winter. The lack of proper precautions is being blamed on a forecast of a mild winter by the British Met Office, which is now trying to scramble out from under that prediction. (And apparently they are still guessing at how much that energy cost will be.) This is relevant also to the USA, since I note, at the top of the Natural Gas section of the STEO, this prediction:
While the EIA also sees world demand for oil increasing by 1.5 mbd per year, for the next two, they only project that 0.1 mbd of this growth can be met by countries outside of OPEC. And it is interesting to note that the growth in overall fluids production by OPEC is split almost evenly between crude and other liquids. (The increasing role of NGLs is discussed in more detail at Crude Oil Peak) Most of that growth in demand will come from outside the OECD, with China, the Middle East and Brazil as leading consumer growth. And on the down-side a combination of declining production from Mexico and the North Sea will take more than 500 kbd out of global supply. Alaskan production will fall 50 kbd in 2011, and an additional 20 kbd in 2012 – further slowing the oil flow down the pipeline and increasing the risks from shutdowns. It also foresees a decline of 220 kbd in GOM production in 2011, and a further drop of 180 kbd in 2012. Thus although there is some increase in other domestic fields, by the end of 2012 the decline will total around 150 kbd. And in another Ouch! Russian production, which has been rising, is anticipated to fall slightly this year, and then drop by 230 kbd in 2012.
With those sorts of numbers the power of OPEC can only be expected to grow over these two years. And within OPEC the countries that can increase production are similarly limited in number. That is not to say that OPEC has not, already been somewhat responsive to increased demand. Production overall was raised by 170 kbd in December, according to Platts. Most of this (130 kbd) came from Saudi Arabia, which is now producing some 8.35 mbd. It will be interesting to see how the numbers look a year from now. But I would personally doubt that the prices that we will see will be as low as the EIA predict, while the volumes may not reach the levels forecast – but time will tell.
Looking at the TWIP itself, crude inputs to refineries continued to run about 1 mbd above this time last year, but are set to dip down as demand drops based on the season. In line with that expected fall, both gasoline and ethanol production have also declined a little.
The first thing that caught my eye was the projection that natural gas prices will be (Henry Hub) $4.02 per million Btu (which is as near as need be a thousand cubic feet, which I will use for ease of comparison). This is $0.37 lower than the 2010 average, though they expect it to rebound to $4.50 by 2012. With the bitter cold in parts of the country at the moment (including here) natural gas is currently at $4.55, with $4.53 reported for February futures. It should be remembered that this is not the spot price – which was $17.04 in Florida on Wednesday. Contrast this with the $3.40 price from the Kern River pipeline that goes from Utah to California.
The concern with this relatively low price, going forward, is that it underscores the fragility of the companies producing natural gas from the gas shales around the country. For while there is a constant barrage of optimism about the amount of natural gas that is present in those fields, companies have to make a significant profit over the cost of production if that gas is to reach the market. I don’t see that ability in this sustained price.
There is currently a bit of a row going on in the UK about the state of preparedness of the UK Government for this very cold winter. The lack of proper precautions is being blamed on a forecast of a mild winter by the British Met Office, which is now trying to scramble out from under that prediction. (And apparently they are still guessing at how much that energy cost will be.) This is relevant also to the USA, since I note, at the top of the Natural Gas section of the STEO, this prediction:
EIA expects total natural gas consumption to decline by 0.9 percent in 2011. Projected residential and commercial consumption fall by about 2.7 percent in 2011 partly because of the forecast of 1.3 percent fewer heating degree-days during the winter months this year compared with last year.Hmmm, temperatures in Tampa Bay are 15 -20 degrees below normal, as I write, and a cold spell, caused perhaps by the North Atlantic Oscillation, continues to make its presence felt across a lot of the country. The season is not, perhaps, turning out to be as warm as the EIA appears to have predicted. They are also projecting that next summer will be a normal one, rather than with the excessive warmth of last summer. As a result they foresee the quoted decline in natural gas use this year, although it will pick back up by 20102.
Total natural gas consumption grows by 1.6 percent in 2012 to 66.5 billion cubic feet per day (Bcf/d). While projected commercial and residential consumption decline by a slight 0.2 percent from 2011 to 2012, the electric power and industrial sectors drive growth with projected increases of 3.6 and 1.6 percent, respectively.The decline is predicated on the drop in rig count, itself a victim of the lower prices.
While the EIA also sees world demand for oil increasing by 1.5 mbd per year, for the next two, they only project that 0.1 mbd of this growth can be met by countries outside of OPEC. And it is interesting to note that the growth in overall fluids production by OPEC is split almost evenly between crude and other liquids. (The increasing role of NGLs is discussed in more detail at Crude Oil Peak) Most of that growth in demand will come from outside the OECD, with China, the Middle East and Brazil as leading consumer growth. And on the down-side a combination of declining production from Mexico and the North Sea will take more than 500 kbd out of global supply. Alaskan production will fall 50 kbd in 2011, and an additional 20 kbd in 2012 – further slowing the oil flow down the pipeline and increasing the risks from shutdowns. It also foresees a decline of 220 kbd in GOM production in 2011, and a further drop of 180 kbd in 2012. Thus although there is some increase in other domestic fields, by the end of 2012 the decline will total around 150 kbd. And in another Ouch! Russian production, which has been rising, is anticipated to fall slightly this year, and then drop by 230 kbd in 2012.
With those sorts of numbers the power of OPEC can only be expected to grow over these two years. And within OPEC the countries that can increase production are similarly limited in number. That is not to say that OPEC has not, already been somewhat responsive to increased demand. Production overall was raised by 170 kbd in December, according to Platts. Most of this (130 kbd) came from Saudi Arabia, which is now producing some 8.35 mbd. It will be interesting to see how the numbers look a year from now. But I would personally doubt that the prices that we will see will be as low as the EIA predict, while the volumes may not reach the levels forecast – but time will tell.
Looking at the TWIP itself, crude inputs to refineries continued to run about 1 mbd above this time last year, but are set to dip down as demand drops based on the season. In line with that expected fall, both gasoline and ethanol production have also declined a little.
Read more!
Subscribe to:
Posts (Atom)


