Monday, March 14, 2011

OGPSS - Oil producers just below 1 mbd, India, Argentina, Egypt and Oman

There were nine countries that, in 2008, produced between 500 kbd and 1 mbd , according to the EIA. Of these one, Azerbaijan, has been able to increase production to just over 1 mbd, and I wrote about it last week. Let me, therefore look at the first four of the remainder – India, Argentina, Egypt and Oman, in this post. The latter two are part of those countries where popular protests have in one case brought down the government, and in the other caused some changes to be made. How these will play out in terms of oil production, and oil exports remains one of the questions which are currently unanswerable.

India was producing 888 kbd of oil in 2008. It is a country with recognized growing demand for oil, to the point that Libya’s Gadaffi has offered it the chance (along with Russia and China) for them to replace Western companies who have shut down operations because of the turmoil. The growing internal demand for vehicular liquid fuel, remembering that India was the country that introduced the Tata Nano, is reaching record levels. Growth for different sectors of that market are rising at more than 10% a year.
Local car sales jumped 23% from a year earlier in February to 189,008 vehicles, showed data issued Wednesday by the Society of Indian Automobile Manufacturers, an industry lobby group. The figure is more than January's all-time monthly record sales of 184,332 cars.
Indian demand for oil is now more that 2 mbd above domestic production and it is increasingly dependent on imports. In 2009 the EIA showed where these came from:

Source EIA
As one looks at the coming global oil market, therefore, India is one of the BRICS nations (Brazil, Russia, India, China and South Africa) that will drive increased international trade, likely well above the levels of today. The EIA consider that Indian growth will be on the order of 100,000 bd per year, which will likely have to be met by additional imports.

The Indian situation in regard to natural gas is similar. Although production has started to increase signficicantly, demand continues to outstrip it.


In the global market India has often been overbid by China as both seek to guarantee fuel supplies into the future. India is currently seeking to add Russia to its suppliers. and there has been an ongoing effort to run a pipeline down from Turkmenistan into India, via Afghanistan and Pakistan, for a number of years. (The TAPI Pipeline) At the moment agreements are reported to be imminent, and these will be followed by natural gas purchases. It should be remembered, however, that the pipeline has to run through Afghanistan and over its thousand-mile length will pass through Kahdahar Province, and then through the troubled tribal areas of Pakistan.


Route of the planned TAPI pipeline to India.

The pipeline would deliver up to 2 bcf from the rich Turkmen fields, though some of the resulting flow would likely be tapped along the way to help both transmitting countries, before the remainder reaches India.

An alternative would be to run a pipeline from the natural gas fields of Iran down through Pakistan into India. This is the IPI pipeline, but (because of the sanctions on Iran) is less favored, at least by the US. And, unlike China, which has already created the pipelines into Turkmenistan, India is still not that far along in the discussion.

Planned route of the Iran, Pakistan India pipeline

Argentina does not attract a whole lot of attention on the hydrocarbon front page. Yet, the picture of how it illustrates the Export Land Model, can perhaps easily be seen from this plot from the Energy Export Databrowser.

The Argentine oil statistics (Export Energy Databrowser )

The situation in the Argentine is perhaps illustrated best by the actions of Repsol, Spain’s largest oil company.
“The sale of YPF shares is part of Repsol’s strategic goal to rebalance its portfolio of assets,” the company said.

Repsol is seeking to reduce business in maturing fields in Argentina while investing in exploration in Brazil’s offshore Santos Basin and elsewhere to increase output.
Thus, as production in the country falls, and demand rises, the amount that is available for export will likely continue to decline. The EIA, which listed Argentine production at 782 kbd in 2008, anticipates that it will be slightly down at 760 kbd this year continuing the trend shown above. Nevertheless, as Spain pulls out, China is moving in , buying out the Exxon Mobil interests in the country.

The natural gas picture is just a little further along, with production having peaked, domestic consumption which had followed right along, now requires that the country begin to import natural gas.

he Argentine natural gas statistics (Export Energy Databrowser )

It is expected that the natural gas fields in Argentina will collapse fairly quickly, with reports that the country will sensibly run out of the fuel within seven years. Within that time frame it is likely that only the current glut in supply will help. But (as with the UK) as more countries find themselves in this predicament, the supply excess will more rapidly attenuate.

Egypt was, of course, one of the two countries that led off the current popular protests against state leaders that had led too long. Producing 718 kbd in 2008, it was about that time that domestic consumption overtook production. Production in 2010 averaged 660 kbd, of which 540 kbd was crude oil.


Government plans to control demand as the country moves to import a larger percentage of that demand are likely now out of the window, at least in the short term. Because the country has about a million b/d refining capacity it will continue to both export and import hydrocarbons, but with the balance swinging toward the import need, within the frame of the current unrest, it is difficult to predict how this will evolve in the future.

Consider, in this regard, the natural gas exports to Israel and Jordan. Until five weeks ago a pipeline carried the gas across the Sinai . Following a terrorist attack on the pipeline flow has been restored to only a quarter of the previous level, and even that is now in question, as a leak just halted the flow again.
Egypt has been supplying 40% of Israel's natural gas since May 2008 – raw material for the production of 20% of the country's electricity – through the state-owned EMG company, businessmen Hussein Salem of Egypt, Yossi Maiman of Israel and Jewish American Sam Zell, and Thai energy company PTT.

The Egyptian opposition openly objects to the gas deal signed between the two countries in 2005. Since the Egyptian supply was halted, Israel Electric Corp. and the private power plants have been purchasing their gas from the Israeli Yam Tatis reservoir.

Gail has recently written on some of the back story to the Egyptian problems and with the rising population, and their increasing expectations from whatever new government finally evolves, it is likely that demand will continue to grow. However, with a relatively large reserve, Egypt can continue to export into the future, though the customers may be more politically screened.


Finally, for this session, I will refer again to Oman. I wrote about Oman just recently, as the protests in other countries had started to be repeated there. There has not been much of a change in the situation since then. Protests are continuing. Saudi Arabia is now responding more aggressively than earlier, troops having been sent into Bahrain And this, perhaps, implies that reactions will not be as peaceful as they have been to date. In that scenario it is not possible to predict whether even popular monarchies such as that of Oman will survive. That , in turn, calls into question the overall reliability of oil and natural gas supply from the Middle East and North Africa. Given the nervousness about nuclear power, it will be interesting to see how the governments of the world react. There are no easy answers

Read more!

Saturday, March 12, 2011

Texas combined temperatures

This is one of an evolving series in which I am looking at the temperatures over the past 115 years in the different states of America. I started in Missouri, and have gradually changed the format of the post as I have found different things in my exploration of the data. Last week in looking at Oklahoma I changed the plot which compares the population around the measuring station to compare it with only the average of the last 30-years of temperature data, rather than the entire 115 years. This does not mean that the last 115 years of data is not valuable, though once I started collecting the GISS records for the state, I found that longer term range does not appear to concern them as much. Of the thirteen GISS stations listed for Texas, there are only three with a temperature record over the full 115 years. The remaining ten stations only have records since 1948.

There are 49 USHCN stations in Texas, ranging from Albany to Weatherford, and they are spread not quite evenly over the state.

Distribution of USHCN stations over Texas (USHCN )

Looking for the GISS station record for Austin I found that there are 3 different records in the GISS file the longest one, however, (1895 to 2009) is for an Austin at a different set of co-ordinates (39.5 N, 117.1 W) to the city which is the logical choice. Of course the currently used site (Austin/Robert 30.3 N 97.7 W) only has data from 1948, but then, so do the others I mentioned. Houston, for example, has four stations, but the one that GISS has chosen to keep maintaining records for has only been around since 1948. While it may be that I am more cynical than most it should be noted that, if one looks at the record for, for example, the GISS stations in Abilene and Amarillo, there are very clear higher temperature spikes in 1933 and 1934, above the most recent high temperatures.

Abilene TX temperatures (GISS)

Amarillo temperatures over the last century (GISS)

However if one only plots the temperatures since 1948 (as most GISS stations do) then there is no evidence that the temperatures were, in that record, higher than the recent past. For example consider the case of Lubbock as an example.

Historic temperature record for Lubbock TX (GISS)

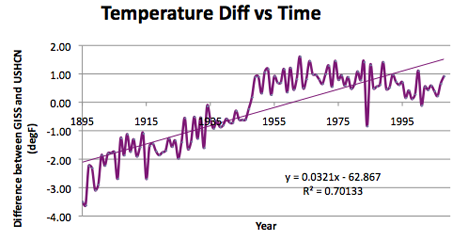
Looking at the overall temperature differences between the GISS temperature average, and that of the homogenized USHCN temperatures, there is a clear trend, although heavily influenced by the changing number of stations in 1948.

Difference between the average GISS station temperature and that of the homogenized data from the USHCN stations.

For Texas as a whole, of the average of the temperatures measured, adjusted for time of observation only (the TOBS temperatures) are used, then the state temperature appears to have declined slightly over the past 115 years.

Average temperature in Texas from 1895.

Texas is 790 miles long and 660 miles wide, including the bit that sticks up almost to Kansas and down past parts of Mexico. Thus it extends from 93.5 deg W to 106.5 deg W, and from 25.2 degrees N to 36.5 degrees N. is the second largest state, behind only Alaska in size. The mean elevation of the state is 518 m, and it runs from sea-level up to 2,666 m (Guadalupe Park). The average USHCN station is at a height of 438 m, while the average GISS station is at a height of 375.9 m. The Center of the state by latitude is sensibly at 31.25 degrees N. (both GISS and USHCN stations center on 31.3 degrees).

Turning to the usual geographic parameters, first latitude:

Correlation of temperature with latitude for Texas

Temperature correlation with longitude for Texas

However as the land rises to the West, this is explained within the relation to elevation:

Texas correlation with elevation

Using the 30-year temperature average for each station and plotting this against population, does not, for this state, give much of a correlation in this case

.Texas correlation of the last 30-year average temperature with population

And then there is the usual:

Difference between the reported USHCN homogenized data for Texas and the raw data corrected for time of observation (TOBS).

Sorry this is a little rushed today but a little excitement in the hotel with a fire alarm bringing us all down to the lobby and slowing things related to leaving. Nothing relative to the disasters of the rest of the world, but taking time.

Read more!

Tuesday, March 8, 2011

Is Nero playing the fiddle?

Or to put this in terms the current Administration might have heard of. While the responsible Administration official talks of energy solutions that will come from bacteria, and might make a significant contribution to energy supply in 20-years – in the world of energy Mrs O’Leary’s cow just kicked over the lantern *.

While the world moves more rapidly to a crisis in terms of the supply of liquid fuels this year, and most critically the gasoline/petrol that drives our vehicles, Western Governments are more excited about seizing the opportunity to talk about increasing renewable energy targets. The European Union (EU) with the help of the British Secretary for Energy and Climate Change, Chris Huhne, has just decided that it has become more critical to raise the target for cuts in carbon emissions, within the EU, to 25% by 2020 (the Hon Sec wanted 30%) than other concerns. The fact that this might, as the EU Energy Commissioner pointed out lead to a “de-industrialization of Europe”, is not considered persuasive.

It was just last week that the chief of the National Grid, Steve Holliday, was quoted in the British Telegraph on March 2nd
Mr Holliday told Radio 4’s Today programme that people would have to “change their behaviour.” “The grid is going to be a very different system in 2020, 2030,” he said. “We keep thinking that we want it to be there and provide power when we need it. It is going to be much smarter than that.”

“We are going to have to change our own behaviour a consume it when it is available, and available cheaply.”
So much for reliable and sustainable power, which used to be one of the things that Government was assumed responsible for providing.
(* The cause of the Great Chicago Fire).

Michael Klare has just pointed out that we have reached what others might call “A Tipping Point.” In similar vein to some of the earlier posts here, he notes
To put the matter baldly: The world economy requires an increasing supply of affordable petroleum. The Middle East alone can provide that supply. That’s why Western governments have long supported “stable” authoritarian regimes throughout the region, regularly supplying and training their security forces. Now, this stultifying, petrified order, whose greatest success was producing oil for the world economy, is disintegrating. Don’t count on any new order (or disorder) to deliver enough cheap oil to preserve the Petroleum Age.

This is an argument not just about the collapse of Libyan society into civil war and the loss of 1.6 mbd from the world market. Rather it seeks to point out that first, after revolutions such as those in Iran and Iraq it has taken years and they are still not back to pre-revolutionary production levels, despite all the rhetoric.

More critically the issue will, however, come back to the investment of resource. Many of those driving the popular protests across the Middle East and North Africa are young. Many of them are educated but un- or underemployed. Some of the blessings of the last century included the medical changes that allowed more children to survive into adulthood, and the MENA countries have seen up-surging populations. IN 1980 Saudi Arabia had a population of 9.3 million individuals, by 1990 it had reached 15 million last year it reached 26 million meaning that most of the population is under 30. (And this is typical of the countries of MENA).

Where will the jobs and other incentives not to riot come from? Dr Klare drew attention to the remarks of a Saudi bank governor
The average local consumption of gas and oil grew 5.9 percent in the past five years, the official news service reported, citing the kingdom’s central bank governor Muhammad al-Jasser. “Domestic consumption of oil and gas is posting continuing growth and at high rates,” the report said. “This requires looking into the reasons behind the increase in oil and gas consumption and working on rationing it.”

The Saudi economy, excluding oil, may expand 4.5 percent in 2010 according to the International Monetary Fund, compared with 3.3 percent in the previous year. . . . . . . .

Power demand in the holder of the world’s oil reserves is set to increase 8 percent a year as the government invests to spur economic growth and the population expands.

Saudi Arabia, lacking natural gas supplies to meet domestic demand, is burning oil in power plants as it expands industry. Demand for oil to generate power could account for as much as 10 percent of Saudi Arabia’s total oil production capacity by 2012, Lawrence Eagles, head of commodity strategy at JPMorgan Chase & Co. in New York, said earlier this year. . . . .

The kingdom’s energy demand will rise to 8.3 million barrels a day of oil equivalent in 2028 from 3.4 million barrels last year unless it becomes more efficient, Khalid Al-Falih, Saudi Aramco’s Chief Executive Officer, said in a speech posted on the website April 26.
This is the country that the world is relying on to keep it out of the hole when world oil demand surpasses otherwise bounded supply.

In many of these states the only major source of revenue has been from their energy exports, increasing percentages of that wealth is going to be turned to meet short-term public demands, it will not go into investments needed to sustain fuel production (see Iran and Iraq).

So there is a short-term increasingly-evident problem of coping with the obvious cut-backs from places such as Libya. But the more serious concerns, which Government seems to be ignoring while they still tilt with windmills (which have very little bearing on liquid fuel shortages), is that the rather bumpy plateau of oil production along which we have been bouncing for the past five years may very soon now tilt downwards, inexorably and without likely reversal.

Short term-measures such as releasing oil from a finite stockpile will not do anything significant to change that situation. But if it is not addressed soon then it is likely that the public opinion will switch from its current uneasy complacency into Panic – and that would not be good. For it is from such conditions that demagogues arise.

Read more!

Monday, March 7, 2011

The Iditarod is running

For those who need a reminder, the Iditarod has started this year, with very good conditions reported.

Read more!

Sunday, March 6, 2011

OGPSS - Oil producing countries around 1 mbd, Kazakhstan, Qatar, Indonesia and Azerbaijan

In this series of posts I have been taking a quick look at the current oil and natural gas production from the world’s top oil producers, using initially the table that the EIA developed for 2008. In just four posts (the top tier at above 3.1 mbd; the upper second tier, the lower second tier and those at about 2 mbd ) I have now reached the final few that produce above 1 mbd. As it is I have slightly re-arranged the order since back in 2008 India was producing more that Azerbaijan, but while Indian production stayed the same, Azerbaijan production has now risen above 1 mbd, so I made the switch.

This limited number of countries includes those whose production is waning, as well as those to whom we might look for improved output to meet the rising demand. That, I would remind you, has been predicted to be about 1.4 mbd more this year than last, providing of course that the recession continues to recede from the global markets, a question that rising prices for oil might throw in doubt. With civil war in Libya appearing more likely, there is a significant possibility that the 1.6 mbd that the country produces might disappear from the scene for a while. So where can the make-up to a total of an additional 3 mbd come from? Well let’s take a look at what these four countries are doing and see whether they are going to be able to help.

First let’s look at Kazakhstan, which was producing 1.43 mbd back in 2008. And to begin with, where is it? South of Russia, and North of China it lies on the Eastern shore of the Caspian Sea.

Kazakhstan (EIA)

In 2005 Kazakhstan began sending oil to China through a pipeline and while some of the oil is locally produced it also provides a conduit for Russian oil flowing to China. The pipeline was originally planned to carry 10 million tons of Kazakh oil, and, by now, the same amount of Russian oil. However it was only at the end of last year that it reached the first target, (200,000bd) with the second now reset to 2013 but now dependant on Kazakh oil from Kashagan, rather than from Russia.

The country depends on pipelines to export its oil. The EIA notes that as production has increased, now at around 1.6 mbd, it will depend both on pipelines and barges across the Caspian to connect to that market.


There is still considerable potential for the slope of the production curve to continue upwards. Chevron has announced that the Tengiz field, which is now at 567 kbd will, in the next phase, ramp that up to 780 kbd. That oil flow to Russia through the Caspian Pipeline Consortium pipe At Kashagan, which will in time produce up to 1 mbd, development is slowed as it faces Government resistance to the high costs of the next phase of the program. Given that the field, located offshore in the Eastern Caspian is the main bulwark for the planned expansion of Kazakh production through 2020, postponing that development may reduce export capacities. There is other news that is also not positive, production from Karachaganak, currently the second largest field dropped 4% last year . Smaller production gains are anticipated from other fields in the country, such as the Tethys Petroleum development, which is going to use a radial drilling method that I might post on in some future time. But it is questionable whether any dramatic gains in production will be available to meet increased global demand in the short term. The target of a 3 mbd export level by 2020, set by the Prime Minister will depend on ironing out some of the current contract difficulties.

Kazakhstan has also participated in the natural gas pipeline that runs from Turkmenistan to China and which was opened in December 2009. That pipeline has increased the marketability of the products, and while all natural gas used to flow to Russia which thus had a considerable say on volumes and prices, the existence of alternatives is causing the Kazakhs to rethink the relationships and distribution of profits.

Qatar (Middle East Political and Economic Institute)

Qatar lies in those Middle Eastern countries whose long-term production might be threatened by domestic unrest. Within the past decade an increasing portion of the country's resource is being devoted to internal consumption:

Qatar is more widely written of in terms of its vast gas fields and potential, rather than for its oil, even though, in 2008, it averaged 1.2 mbd of production. In January of this year OPEC reported that Qatar produced 813 kbd of oil. However, with the large natural gas production the country also produced around 380 kbd of non-crude liquids to provide the overall 2008 volume. It is through an increase in the latter volume to 590 kbd that has raised overall 2010 production to 1.4 mbd.

Source Energy Export Databrowser

It had been viewed as one of the more stable countries of the region, back in 2006. That ranking puts it just ahead of Oman, and Oman has now seen some disturbance and death. (And receiving support from the UAE to meet those threats, suggesting that they are perceived as deeper than reported.) Qatar has the second highest per capita income (at $95k) but it should be remembered
The royal family, the Al-Thani, has a history of internal conflict and competition over political power. The last three leadership transitions—in 1949, 1960 and 1995—came about as a result of forced abdications, due to in-fighting within the ruling family. However, this ruling family has maintained social peace in Qatar for decades.

Qatari political stability is baffling.

The production of natural gas from the country is increasingly going into liquefied natural gas (LNG ) and the significance of the production can be seen from the EIA report
RasGas and Qatargas have 13 LNG trains currently online, with a total LNG liquefaction capacity of 3,400 Bcf/y (69.2 MMt/y). Five of these trains were added in 2009 and 2010. RasGas III, Train 7, with a liquefaction capacity of 380 Bcf/y (7.8 MMt) of LNG began operations in February of 2010. Qatargas III, Train 6, came online in November of 2010 with the same liquefaction capacity. The 7.8 MMt train is considered a mega-train, and is currently the largest operating size in the world.

In March of 2011, Qatar will complete its monumental cycle of LNG infrastructure expansion with the inauguration Qatargas IV, Train 7 (80 Bcf/y (7.8 MMt)), which will bring the total capacity to 3,750 Bcf/y (77MMt/y). Qatari government officials have noted that they do not anticipate building any more LNG facilities in the near-term future.


Qatar growth in LNG production (EIA )

Whether those decisions will affect the slope of the increasing levels of production will have to await the test of time, but with 70% of production going into the LNG market, that still leaves room for growth elsewhere.

Source Energy Export Databrowser )

Indonesia left OPEC in May 2008, since it had become an oil importing country. (This also saved them the $3 million annual membership) Recent production has been down around 1 mbd (similar to that of 2008) but a recent dispute over cabotage may cut this dramatically. Cabotage is the requirement that fuels be transported in domestically-owned vessels, and Indonesia proposes to ban the use of foreign-owned vessels next May. This will affect both oil and gas production with cuts that threaten to be about 157 kbd of oil, and 2.5 bcf of natural gas.

At present the country is third in LNG exports after Qatar and Malaysia. The world’s largest buyer of LNG is the Korea Gas Corp (KOGAS) and they have agreed, with Mitsubishi to build a new processing plant in Indonesia to help supply the Japanese and Korean markets. With an estimated reserve of 112 Tcf , the country has the potential to grow this export, though it is quite likely that this increased production may end up in China, which is looking at increasing imports to over 9 Tcf over the next 5 years.


Domestic demand for energy continues to grow, and Indonesia plans to build a second LNG receiving terminal on Java, using domestically produced gas to meet the demand.


And that brings us to Azerbaijan, on the other side of the Caspian from Kazakhstan. Baku, the capital, has hosted oil development since the late 19th Century . In 2008 the country produced 876 kbd of crude, at the time just below India. However ,with the increased development of the Chirag, Azeri and Guneshli oilfields the country is hoping to exceed (if only slightly) the 1 mbd mark this year. However it did fall a little short of predicted volumes in this past year. Current plans are for production to continue to increase, with a target of 1.25 mbd in 2014. The difference between those numbers and that of the EIA figure for the country comes from the inclusion of other non-crude liquids.


The majority of the oil is shipped through the Baku-Tbilisi-Ceyhan pipeline with smaller amounts being sent to Georgia.

Natural gas production is expected to continue to grow with the development of the Shah Deniz field., to the point that additional pipeline capacity is being planned. The plans call to treble capacity, but may require some $3 billion of additional investment. The pipeline carries a flow, at present, averaging 770 mcf/day. One of the issues as Shah Deniz increases total production (it is considered the 9th largest gas field in the world) concerns how the natural gas produced will get to its customers. One of the ongoing options is the Nabucco pipeline. The planned increase of 565 bcf by 2017 can be shipped by possibly three pipelines, but the Nabucco needs a volume of about twice this, and so is currently looking for an additional supplier to make up the numbers. That search has been going on for a while.

Looking at the numbers that I have just gone through, it is clear that the world is going to see an abundance of natural gas likely continuing through the decade. In the shorter term, however, there does not seem to be that much capacity for an increase in oil production. For while countries such as Kazakhstan and Azerbaijan can increase volumes over the present, the increases are not that great, when compared with the need. (The slopes look good, but the vertical scale less so).

But on the other hand the aggregation of a hundred thousand here, and a hundred thousand there can add up to a significant volume in the end. So I will continue this set of posts, looking next at those countries which just can’t quite make that 1 mbd.

Read more!

Saturday, March 5, 2011

Oklahoma combined temperatures

At present I am studying the temperatures, as reported by GISS, the homogenized USHCN temperatures and the Time of Observation corrected, otherwise raw, data for a strip of states in the Midwest. I have reviewed the temperatures for the more Western states (list on the right side) and have now reached Oklahoma, after revisiting Kansas last time. As I go through the states it is possible to draw some conclusions from the data, and so, over time, these posts have changed in structure as I find things that are interesting to note. This post is no different, in that I have realized that using average temperatures over 115 years to plot against current population might not be really useful. Thus, at the end of the post I lhave compared that plot with one that just uses the last 30-years of station temperatures. Since I get an r-squared correlation of 0.25 for the log-normal relation I will be using the 30-year information for the temperature:population plot in the future, and will be adding that graph to the previous state reports as I get time.

Oklahoma has 44 stations in the USHCN network from Ada to Webbers Falls, and they are spread relatively evenly over the state.

Location of the USHCN stations in Oklahoma (USHCN)

There are two GISS stations in the state (according to Chiefio’s list) and these are in Tulsa and Oklahoma City. Well guess what? There is a full record for Oklahoma City, but as for Tulsa . . . .(see below the fold).


It is perhaps now no surprise, sadly, that the record for Tulsa only goes back to 1948.


Filling out the population data, Kenton does not appear in the citi-data set, and so I used zip-codes.com to get 77. Otherwise the population data was all obtained using citi-data information.

Looking at the difference between the GISS data, which is again taken from the largest two cities, and comparing it with the USHCN homogenized averages, one gets:

Difference between the average GISS station data, and that of the homogenized USHCN station numbers.

The average difference between the two is 0.65 degrees F. Looking at the trend in the state temperature, over the past 115 years,


The temperature rise for the state has averaged some 0.48 degrees F per century, whereas if the homogenized USHCN data is used, then the rise has been 0.94 degrees F per century.

Looking at the geography of the state, Oklahoma is 478 miles long (E-W) and 231 miles wide. It runs roughly from 94.5 deg W to 103 deg W, and from 33.5 to 37 degrees N. It rises from 88 m to 1,515 m above sea level, with an average elevation of 396.2 m. (The average USHCN station elevation is 415 m, and that of the GISS stations is 300.2 m).

Looking at the effect of geography on temperature for the state:

There is a strong correlation with latitude over the state.

The correlation with longitude is confounded by the rise in elevation as one moves west.


Thus the correlation with elevation is more important.


Turning to the effect of population, the data that I have is for most recent population and until now I have been plotting overall average temperature against this value, but more properly I should only be using more recent temperatures. Out of curiosity, therefore here is the plot using the overall average temperature relative to the station current population, and then the average of the last 30 years, temperatures used instead.

First here is plot using the overall average temp for each station.


And then here is the plot using only the last 30-years of data for each station.


Given that the population number used more accurately reflects the temperature over the period, it is perhaps no surprise that the correlation is better, and so I will use that time interval in the future posts on this theme. (And in time will go back and adjust the plots in the earlier posts – UPDATING the lead in to show that I have done so, as I do).

Oh, and finally, there is this:


Read more!

Tuesday, March 1, 2011

OGPSS - At around 2 mbd - Nigeria, Angola, Libya and the UK oil production

The growing concerns about the stability of the countries of the Middle East and North Africa (MENA) because they make significant contributions to world oil supply adds additional meaning to these weekly posts on the world’s major oil producers. To briefly recap I looked at the top tier oil producers (as listed by the EIA (i.e. those who produce more than 3.1 mbd in 2008) in the first post of the series. (These were Russia, Saudi Arabia, the United States, Iran, China and Canada. ) In the second I looked at the next four countries on the list, namely Mexico, the United Arab Emirates (UAE) Kuwait and referred to Venezuela – subject of a series of posts earlier in the year. The third post covered Norway, Brazil, Iraq, and Algeria. And so now we move on to look at Nigeria (2.35 mbd), Angola (2.0 mbd) Libya (1.87 mbd) and the United Kingdom (1.58 mbd). The numbers in parentheses are the production numbers cited by the EIA for 2008. To further put these countries in context, these take us down to number 18 on the list, and with one more post I will have covered all the countries that produced more than 1 mbd on average in 2008.

I will start with Nigeria, which now is cited as producing 2.4 mbd of crude and condensate in January 2011. The country has been having considerable trouble with sabotage and internal unrest, which has had a negative impact on production. However the country signed an Amnesty Program with militants in 2009 which has reduced disruption. As a result in February Nigeria was able to raise production to 2.6 mbd. If this can be sustained it will bring production back over the peak level that was achieved back in 2005.


Note that, for crude oil production alone, Nigeria is listed as producing 2.17 mbd in January, according to the February OPEC MOMR. (Which is also a gain from the above chart). In light of some of my recent comments on who might be hurt if oil production in some of the MENA countries drops off, it is perhaps interesting to note which countries got oil from Nigeria in 2009.

Nigerian oil customers in 2009 (Source EIA )

Historically Nigeria flared much of the gas that was associated with the oil, particularly in the Niger River Delta, where much of the oil is found. That practice led to some of the more dramatic stories that came from the region, before the amnesty. There is, however, a concerted effort now to capture and market this natural gas, as well as that which comes from gas wells in the country. This has led to some optimism by the Government over future sources of revenue.
The Minister also disclosed that the establishment of two new Liquefied Natural Gas, LNG plants, in Olokola in Ogun/Ondo States and Brass LNG in Bayelsa state, will create over 7,000 jobs and inject over $1billion into the host communities.

There are a total of 6 LNG trains at Finima, on Bonny Island, first coming into production in September 1999, and supplying a variety of customers. While the capacity is at 1.1 Tcf, recent figures have been at about half that volume. (And this is about the same volume that continues to be flared in the country.)

With Nigeria having increased overall production since 2008, though potentially having limited potential for much greater increase, the next country down the list is Angola which, since 2007, is also in OPEC, and OPEC list the January Angolan production of crude at 1.62 mbd. This is significantly below the overall 3.8 mbdoe that BP has reported for total energy production in 2010. Because of some technical problems with water injection, being used to help move oil from the reservoirs, moves to address the problem might overall, reduce the average for 2011 to 3.4 mbdoe. Angola exports about 1. 7 mbd of oil, but is responsive to OPEC requests to control production in order to keep prices at the OPEC comfort level. (Which has risen from around $75 to over $100/bbl in the last few months). Thus the declines shown in the EIA plot below, which only shows through 2009, are more politically induced than due to geological conditions. The EIA, for example, lists project for this year alone that are expected to add 650 kbd to production, and likely export. Unfortunately we are now far enough down the list that while these numbers are significant in their own right, and for the country they may not give that much help to the overall shortages that may evolve over the next year.


Angola currently is building an LNG project at Soyo, expected on stream in 2012 which will handle around 1 bcf/day. Apart from the LNG, which will be exported, the plant will send some 125 mcf/day of natural gas into a distribution network for domestic consumption. Until the plant comes on line most of the almost 1 bcf of natural gas that is produced every day is either flared or reinjected to help with oil production.

Trying to project Libyan future production is rapidly becoming meaningless, I fear as the initial moves to remove the current Leader have not met with sufficient success to eliminate the possibility of civil war. It was only a few weeks ago that Libya was producing at around 1.6 mbd of oil, and Luis de Sousa has reposted an earlier review of the past history of their production. He presciently notes in that post that the rising population of the country is going to demand more of the resource be spent at home. The topic of Libyan production will likely continue to appear in other posts – as it just has – but at the moment it appears, for a variety of reasons, that the system is effectively shut down.
Little if any oil can be shipped out of Libya because most ports were closed. Meanwhile, storage tanks were filling up rapidly. Oil traders said one major oil company cargo ship was supposed to berth this week, but no one was at the port to deliver an oil shipment, and shipping companies were reluctant to send ships into the Libyan ports.
I have also discussed elsewhere the likelihood of sufficient increase in production in other countries to make up the shortfall. Gazprom has been helping Italy, for example, and Saudi Arabia increasing production, but how long this will last, and how much will ultimately be needed remains an unknown. It really depends on how many dominoes fall, and how long they remain on the table.

Which brings us to the United Kingdom. Back in the troubled days of the first oil shocks some thirty to forty years ago, it was the combination of new production from the fields in the North Sea and the North Slope that helped bring oil prices down to the low level which allowed the years of growth until now. But we have reached a point where those resources are beginning to disappear, and the UK has turned from an energy exporter to a growing importer. Euan Mearns has documented this progression in a much more detailed and better way than I illuminating, for example, back in 2008, the coming seriousness of their problem.

Euan’s plot of the UK Predicament, from 2008

If we look at the situation today, the reports for last year note
In 2010, the UK produced 850 million barrels of oil and gas equivalent (boe) or 2.3 million boe per day. Current plans now target reserves of 11.6 billion boe, 1.3 billion boe more than was anticipated a year ago, reflecting the outcome of increased exploration and appraisal activity across the UKCS and particularly West of Shetland. Oil & Gas UK believes there could be up to 24 billion barrels of oil and gas still to recover from the UKCS.
This was about 60% of the UK energy need. Production of crude for last November was 1.047 mbd from offshore, and 9,344 bbl from land wells. The natural gas numbers were 2.7 Bcf from offshore oil wells (as associated gas) and 2.8 Bcf from offshore gas wells. In addition there was some 12 kbd of condensate from the offshore gas fields.

Whether one uses Euan’s plot, or that from the Energy Export Databrowser:

UK Oil statistics (Energy Export Databrowser)

The UK is clearly entering a more expensive future as it must find more oil from overseas, just as that supply is tightening.

On the other hand, while the situation is getting somewhat worse more rapidly with natural gas, as the EIA plot below shows ( and it contributes to Euan’s total figures) there is a sufficient glut on the world market at the moment that there will not be that immediate a problem in the short-term.

United Kingdom trends in gas statistics (EIA )

UPDATE The energy situation in the UK is becoming recognizably more dire, and the Secretary of Climate and Energy, Chris Huhne has just pointed out that the price of $100 a barrel for oil justifies a greater investment in green technology
Drawing on research conducted for the previous government by Lord Stern, Huhne argued that a $100 a barrel price is the exact point at which the economics of climate change pivot so that it becomes cheaper for British consumers and businesses to invest in green technology than remain with the status quo.

He said that if oil only reaches $108 a barrel by 2020 as predicted by the US Department of Energy, which would also lead to higher gas prices, then "the UK consumer will win hands down". He said the UK consumer would be "paying less through low-carbon policies than they would pay for fossil fuel policies".
This does not recognize that most renewable energy technology currently focuses on generating electricity, while the crisis is in liquid fuels for transportation, and it also ignores the likely over supply of natural gas which is separate that price from the rising price of oil over the coming years. Tsk!

The current situation in the MENA countries is in such a state of flux, and the impacts barely recognized as yet, that it is becoming even more difficult to have any confidence that the predictions of performance that were being used only a couple of months ago will continue to have much validity in predicting what is likely to occur even in the relatively short term future.

Read more!