Thursday, March 24, 2011

OGPSS - Countries producing over 500 kbd - Malaysia, Australia, Colombia and Ecuador

Over the past few weeks I have been briefly discussing the amount of oil that the major producers of the world generate each year. Starting at the top, with Russia and Saudi Arabia, I have now arrived at the bottom end of the list of countries producing more than 500,000 bd. I am concluding with Malaysia (727 kbd), Australia (586 kbd), Colombia (602 kbd) and Equador (504 kbd). For those interested the list (the EIA top producers in 2008) would have continued with Sudan (480 kbd), Syria (401 kbd), Equatorial Guinea (359 kbd), Vietnam (337 kbd), and Thailand (328 kbd) to cover the countries that produce more than 300 kbd.

But my interest in these countries stems for the need that the world has for significant increased production, and the further that one moves down the list the harder it is to see any country being able to produce an extra 200 kbd say, to provide the additional power that Japan might need to replace the destroyed nuclear reactors, not to mention the 1.4 mbd that has been projected for the growth in demand of the world economy this year, nor the 1.6 mbd that the loss of Libyan production will impose on global supply.

So let us begin by looking at the production from Malaysia, which seems to have hit a plateau in production of crude oil in recent years. Production levels are projected to stay about current levels, slightly below 700 kbd through 2020, with some of that coming from enhanced oil recovery techniques. Malaysia is also the second largest producer of palm oil, at around 300 kbd though a lot of the latter is used in cooking.

Malaysia lies north of Indonesia (covered earlier in the series)

Malaysia (EIA map )
While production is holding relatively steady, consumption within the country is steadily increasing so that, before too long, it is likely that the country will cease to export oil, in a similar fate to that of Indonesia. This despite plans to further develop offshore fields.


Extrapolation of the above lines suggests that Malaysia has hardly any time left until it stops being able to export oil.

Natural gas, however, is another story, with steadily increasing production, to date, being able to out-perform increasing domestic consumption. Thus exports, which ran around 1 TCF in 2009, have continued to grow.


The country exports around 1 TCF of LNG, two-thirds of which went to Japan. With only one of the re-gassifying plants in Japan out of operation, LNG provides a way of meeting some of the current energy shortfall in Japan, and Malaysia is willing to help. Malaysia is also now supplying China with LNG, with flows into Shanghai anticipated to rise to 3 million tons/year next year.

Australia is next on the list and it appears to have passed peak oil production, and as a result exports have dropped from over 500 kbd in 2007, to just above 300 kbd today. The declines in production are expected to continue
"The recent start-up of BHP Billiton's Pyrenees oil field and Apache's Van Gogh field - both situated off Western Australia's north-west coast - will provide a boost in the short-term, however the long-term trend is for production to keep falling," EnergyQuest Chief Executive Officer, Dr Graeme Bethune, said today.
(this from April 2010). Current production is at around 540 kbd, having fallen 40 kbd in 2010.

The decline with a projected drop of 85% in 10 years can be seen from this graph:

Anticipated future Australian production (Geoscience Australia )

At the same time Australian consumption has been steadily rising, and is hovering just below 1 mbd.

Australian oil consumption (Index mundi )

In contrast Australian natural gas reserves are significant. As with Malaysia it has supplied LNG to Japan, starting in 1989 and has just signed a $41 billion contract for a 20-year supply of LNG from the Gorgon field, taking 2.25 million tons of the anticipated 15 million tons (0.75 Tcf) of annual production anticipated from the field, as overall gas production continues to rise.

Current estimates of Australian natural gas reserves are of over 108 Tcf


Colombia (Source EIA )

Colombia sits next to Venezuela, and I referred to some of the interplay between the two countries in an earlier post on Venezuela. Production of oil has fluctuated but has recently been increasing, so that it is now running at 800 kbd, and this is anticipated to increase to 1.2 mbd by 2012. It is thus one of the few countries that might be able to increase supply to the United States as some of the more traditional sources lose production.

Colombia oil statistics (Energy Export Databrowser )

The problems that currently exist relate to the need for additional pipeline capacity to carry the newly developed reserves to a point where they can be exported. Investments in the country from China, among others, support a prediction of further growth to 1.4 mbd by 2014.

As I referred to in the Venezuelan post, some of Colombia’s natural gas has been exported to Venezuela, with the intent that in 2012, as the Colombian reserves start to decline the flow can reverse. Much of the natural gas has been used for improving oil production in the past with the country consuming some 265 Bcf while producing 318 Bcf.

Ecuador (EIA )

And the final country producing more than 500 kbd is Ecuador, although that was in 2008, and by last year production had fallen to 485 kbd. The country shows the more standard shape illustrating the Export Land model with an accelerated decline in exports as consumption rises, even as overall production now falls.

Ecuador oil statistics (Energy Export Databrowser )

It would seem, since Ecuador exports to the United States, that the increase in Colombian production is timely.

In regard to natural gas, perhaps the EIA says it best
Ecuador has relatively small proven natural gas reserves and a limited natural gas market.
The supply that it has is used internally, mainly for electricity generation, while much of that associated with oil is either flared or reinjected to help with production.

Read more!

Wednesday, March 23, 2011

Minnesota combined temperatures

Minnesota has 33 USHCN stations, from Ada to Zumbrota and has three GISS stations listed, at Rochester, Duluth, and International Falls.

USHCN weather stations in Minnesota

The historic record for the three GISS stations is, yet again, not complete over the time interval (1895 – 2010) of the USHCN record. For example the temperature record for Duluth starts in 1904, while the other two only go back to the 1948 date that seems common to many GISS selections.

GISS temperature record for Duluth MN

International Falls has a temperature record that starts in 1948:

GISS temperature record for International Falls Minnesota

And the record for Rochester, MN also starts in 1948.

GISS temperature record for Rochester MN

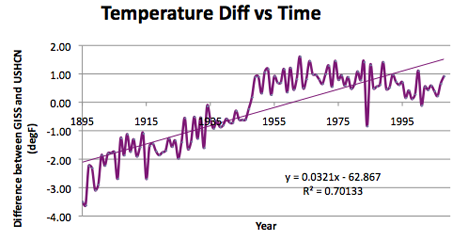
When the difference between the GISS station average and that of the homogenized USHCN data is plotted over the period it must be truncated since, for Minnesota, the GISS stations chosen do not record data pre-1904.

Difference between the average GISS station temperature for Minnesota and the homogenized USHCN temperatures

Looking at the average temperature for the state over the 115 years, and using the Time of Observation corrected raw data (TOBS)

Average temperature for Minnesota in the period 1895 to 2009, using Time of Observation corrected temperatures.

The rate of temperature increase for the state shows a 1.3 degree per century rise in temperature. This is less than the 2.2 degree per century value obtained when the homogenized USHCN data is used.

Minnesota measures 360 miles by 407 miles running from roughly 89.5 deg to 97.2 deg W, and 43.57 deg to 49.38 deg N. The highest point is at 701 m and the lowest at 183 m, with an average elevation of 366 m. The average USHCN station is at 349 m, and the average GISS station at 295 m.

Looking at the effects of geography, there is a strong correlation with latitude:


In regard to Longitude, there is sensibly none.


Turning to elevation, the correlation is not as good as it has been in other states, though evident.


And then there is the correlation with population. I am just using the average of the last 30-years temperatures to correlate with the population value – though should check I suppose to see which range of years gives the best correlation. Certainly using only the shorter period (rather than the whole record) improves the regression coefficient from 0.03 to 0.12.


And yes, sadly, there is also this plot.


Read more!

Sunday, March 20, 2011

Unscheduled interruption

The schedule will be off for a couple of days, and my apologies to those expecting the temperature and OGPSS posts this weekend. I hope to be able to get them up in the near future and be back on schedule.

Read more!

Saturday, March 19, 2011

The Japanese fuel crisis

One consequence of the Japanese earthquake and tsunami that is not receiving as much press as the ongoing struggle to cool the damaged reactors, but which continues to influence more people is the lack of fuel. Nine of the Japanese refineries were damaged and put out of action, and this dropped the amount of fuel being refined from 4,500,000 bd down to 3,100,000 bd. (Note that the Guardian report I quoted earlier was off by a factor of ten.) The lack of fuel for transportation affects not only those in the disaster area, but also those away from it, since food and fuel itself depend on transport to move it to customers around the country.
"What we urgently need now is fuel, heavy and light oil, water and food. More than anything else, we need fuel because we can't do anything without it. We can't stay warm or work the water pumps," said Masao Hara, the mayor of Koriyama city, in Fukushima prefecture.
.
The refineries that remain in production are responding to the need. Idemitsi Kosan has raised production at its four refineries by 83,200 bd (from 87% to 100% production) and Cosmo Oil has raised production at its two operating refineries by an additional 80,000 bd but this does not match the size of the problem.

There are several different aspects to the problem, first the oil has to come ashore. With ports closed and unable to re-open for possibly months, shipments from the Middle East, which supplies 80% of Japan’s need, have now been curtailed until the situation becomes clearer. Within the country the Japanese Government has released around 8 million barrels of oil from their strategic reserve. It is also shipping 250,000 barrels of refined product to the area affected by sea (though this runs into the issue of how to get into the ports and distribution network). At Chiba some of the port has been able to re-open ) but not the terminal that fed to the Cosmo refinery (since that had burned).

Then the oil must be refined, there are 29 refineries in Japan, and Wikipedia lists them as follows. (I have modified the list to show which ones have had a status change).

▪ Chiba Refinery (Cosmo Oil) (Cosmo Oil), 240,000 bbl/d (38,000 m3/d) CLOSED BY EARTHQUAKE & BURNING
▪ Yokkaichi Refinery (Cosmo Oil), 175,000 bbl/d (27,800 m3/d) INCREASING PRODUCTION
▪ Sakai Refinery (Cosmo Oil) (Cosmo Oil), 80,000 bbl/d (13,000 m3/d)
▪ Sakaide Refinery (Cosmo Oil), 140,000 bbl/d (22,000 m3/d) INCREASING PRODCTION
▪ Muroran Refinery (Nippon Oil Corporation (NOC)), 180,000 bbl/d (29,000 m3/d)
▪ Sendai Refinery (Nippon Oil Corporation (NOC)), 145,000 bbl/d (23,100 m3/d) CLOSED BY EARTHQUAKE
▪ Negishi Yokahama Refinery (Nippon Oil Corporation (NOC)), 340,000 bbl/d (54,000 m3/d) CLOSED BY EARTHQUAKE
▪ Osaka Refinery (Nippon Oil Corporation (NOC)) 115,000 bpd
▪ Mizushima Refinery (Nippon Oil Corporation (NOC)), 250,000 bbl/d (40,000 m3/d)
▪ Marifu Refinery (Nippon Oil Corporation (NOC)) 127,000 bpd
▪ Toyama Refinery (Nihonkai Oil/Nippon Oil Corporation (NOC)), 60,000 bbl/d (9,500 m3/d)
▪ Kubiki Refinery (Teikoku Oil), 4,410 bbl/d (701 m3/d)
▪ Chiba Refinery (Kyokuto) (Kyokuto Petroleum/ExxonMobil), 175,000 bbl/d (27,800 m3/d) CLOSED BUT RESTARTED
▪ Kawasaki Refinery (TonenGeneral Sekiyu/ExxonMobil), 335,000 bbl/d (53,300 m3/d) CLOSED BUT GETTING READY TO RESTART
▪ Wakayama Refinery (TonenGeneral Sekiyu/ExxonMobil), 170,000 bbl/d (27,000 m3/d)
▪ Sakai Refinery (TonenGeneral) (TonenGeneral Sekiyu/ExxonMobil), 156,000 bbl/d (24,800 m3/d)
▪ Nishihara Refinery (Nansei sekiyu/Petrobras), 100,000 bbl/d (16,000 m3/d)
▪ Keihin Refinery (Toa Oil/Shell), 185,000 bbl/d (29,400 m3/d)
▪ Showa Yokkaichi Refinery (Showa Yokkaichi/Shell), 210,000 bbl/d (33,000 m3/d) SENDING PRODUCT OVERLAND
▪ Yamaguchi Refinery (Seibu Oil/Shell), 120,000 bbl/d (19,000 m3/d)
▪ Sodegaura Refinery (Fuji Oil Campany), 192,000 bbl/d (30,500 m3/d) INCREASING PRODUCTION
▪ Kashima Refinery (Kashima Oil Campany/Japan Energy), 210,000 bbl/d (33,000 m3/d)CLOSED BY EARTHQUAKE
▪ Mizushima Refinery (Japan Energy) (Japan Energy), 205,200 bbl/d (32,620 m3/d)
▪ Shikoku Refinery (Taiyo Oil), 120,000 bbl/d (19,000 m3/d)
▪ Ohita Refinery (Kyusyu Oil), 160,000 bbl/d (25,000 m3/d)
▪ Hokkaido Refinery (Idemitsu Kosan), 140,000 bbl/d (22,000 m3/d) INCREASING PRODUCTION
▪ Chiba Refinery (Idemitsu) (Idemitsu Kosan), 220,000 bbl/d (35,000 m3/d) CLOSED BY EARTHQUAKE BUT BACK ON LINE AND INCREASING PRODUCTION
▪ Aichi Refinery (Idemitsu Kosan), 160,000 bbl/d (25,000 m3/d) INCREASING PRODUCTION
Tokuyama Refinery (Idemitsu Kosan), 120,000 bbl/d (19,000 m3/d) INCREASING PRODUCTION

(The last four refinery increases in production will add another 83 kbd to the total.)

By the end of the month it is expected that the recovery will only be to 3.4 mbd although this will still leave the country some 1 mbd short of the refined fuel it needs.

At present only one LNG terminal, at Shinminato, remains closed, but it is unlikely that this will reopen in the near term. The rest are operational, and LNG cargoes will be made available from a number of sources, if needed.

Japanese LNG ports
The northeast coast ports of Hachinohe, Sendai, Ishinomaki and Onahama are so severely damaged that they are not expected to return to normal operations for months.
Looking at a map (from Stratfor showing the power plants, and the road layout, the damage to the distribution network with the destruction at Sendai illustrates the problem in gaining access to the damaged area and in sending in new fuel. Food to parts of Ishinomaki has had to be delivered by helicopter, and for a town of 160,000 this is not nearly enough.

As the Independent reports
On the drive north out of Sendai city in northeast Japan, a slip-road takes you to a motorway that would normally be filled with traffic but was this week a scene of destruction to rival the most far-fetched Hollywood disaster movie. A thick coating of mud had been deposited at the toll booth, along with smashed vehicles, motorbikes and heavy machinery from a nearby factory. Beyond the booth, the road rose up to meet the highway and a panoramic view of the blitzed landscape below, where a jumble of hundreds of cars, trucks and splintered debris stretched as far as the eye could see. In the background, thick black smoke billowed from fires burning at a damaged oil refinery near the city bay.


Japanese infrastructure (Stratfor)

There are trunk pipelines running from the main LNG terminals, to assist in distribution.

Japanese trunk pipelines and LNG terminals

Fuel needs are not just for gasoline and diesel for vehicles. With the bitter cold that remains over much of the north of Japan, and no electric power, kerosene is also needed for heating. For domestic heating many homes rely on kerosene stoves to heat individual rooms in use, rather than using central heating. Stocks had been falling, before the earthquake, due to the severe winter this year. And with stocks being sent to help refugees, there are now shortages in other parts of Japan.

While there are some indications that the nuclear problems may be being brought under control, the problems of fuel shortage and the cascading problem of food, fuel and other resource distribution that it brings with it, are likely to remain in Japan for several weeks, as the crisis continues.

Read more!

Wednesday, March 16, 2011

Japan - using water cannons and replacing lost power

There are two different time intervals (short and intermediate term) for my comments today on the problems that Japan now faces with their nuclear power stations, following the earthquake and tsunami that have left the nation facing concerns over radiation and a shortage of power, that have accompanied the vast and tragic damage to people and property. I am gong to give a short technical comment on putting water on the nuclear station fires (wet stuff on red stuff as they say in the trade) and then comment a little on what the alternatives might be for replacing the lost power in Japan. (UPDATE: The loss of petroleum products due to the damage to nine refineries has cut the amount of oil and its products that is available from 450 kbd to 310 kbd. )

The first aspect of the problem relates to the immediate short-term, and the need to cool the reactor sites and the spent fuel pools at the Fukushima Daiichi power plant. Because the attempt to drop water onto the critical areas using helicopters did not work, the current plan is to use police water cannon. Police cannon, for those who have lived a righteous life, are used to control riots where it is desirable to minimize damage to the participants. They can be used either with plain water, or a small amount of a polymer (also used in fracking operations) which reduces friction (it is usually a poly-acrylamide). The latter is sometimes referred to as “Banana Water” since when it is used it makes the ground surface very slippery. After all, it is hard to continue a riot when you cannot get up off all-fours. (The polymer also makes the jet throw considerably further). A water cannon might throw a jet up to 60-meters at a working pressure of around 160 to 200 psi. They are generally designed for relatively close operational ranges, and with a stream that disperses. More effective designs to throw longer distances would have a greater section of straight section behind the nozzle (to stabilize flow) though sometimes internal flow straightening devices are used instead, allowing a shorter barrel.

However, should they wish to get more water into the area from further away, they might want to consider using some of the old hydraulic pumps and monitors left over from the recent past when coal was mined hydraulically in the Hokkaido (large pdf). These can deliver over a thousand gallons of water a minute, with sufficient power that they can mine coal from more than a hundred feet away. The reactors are slowly cooling, and it is hoped, once the water is available to accelerate the process, that those particular problems will subside.

In the intermediate term there is the loss of power from the eleven reactors that have been taken offline. Japan suffers from a lack of indigenous fuels. though it has sought to improve the efficiency of consumption, and thus lowered demand over the past decade the demand for oil and natural gas has remained high. The demand may be constrained in the short term by the disaster, since roads and infrastructure have been severely damaged, with road displacements of over a foot in places. But demands for some form of power, and the need to get the country re-mobilized may shorten any significant decline in demand. Moreover use of fuel oil has, recently, been rising reaching 151,000 bbl/day in January.

(Source EIA)

Twenty-four percent of Japanese electricity is produced from nuclear power and it is a portion of this that may now be out of commission for years.

The Japanese are reported to have shut down some 6,800 megawatts of power, and it has been calculated that, were this to be totally replaced by oil, that this would impose an additional demand of 238,000 bd on the market. On the other hand were it could be replaced by natural gas, a perhaps cheaper alternative, then demand would increase by perhaps 1 billion cu ft/day (BCF/d).

There are several ways in which the power can be replaced, but they will likely be focused on the use of fossil fuels. It should not be forgotten that five coal-fired power stations were shut down by the quake and tsunami, and cargoes for those stations are now being picked up by other stations in Japan.
According to market sources, the five affected power plants are the Tepco and Tohoku Electric joint venture 2,000-MW Soma Kyodo plant; Tohoku Electric's 2,000-MW Haramanchi plant; Joban's 1,600-MM Nakoso plant, and Tepco's 600-MW Hirono and 1,000-MW Hitachinaka plants.

Analysts said the equivalent of 10% of Japan's installed coal-fired generation capacity for electricity was currently offline.
The coal-fired plants will likely prove faster and simpler to repair and bring on line than the nuclear plants.

(Source EIA)

Until the recent events occurred, it was anticipated that the large use of coal in the country would fall, and be replaced by nuclear power. That trend is likely over, and the coal markets are already anticipating the switch back. As noted on Seeking Alpha, the question that arises, in part, is just where it will come from.
No matter the outcome of the current problems with the three old-style reactors in Japan, all of which need pumps to be secure from damage so water can be pumped up into the reactor core to cool the fuel rods (vs. the newer designs that use gravity to let water fall down onto them), one thing is certain: Other coal-fired plants in Japan will be working overtime to make up for this loss of power in order for re-building to be able to take place.

One additional reminder: It isn't as if China isn't already desperate for US and Canadian coal. It isn't as if Australia hasn't already had to reduce coal production as a result of the flooding there. It isn't as if India doesn't need more of both types of coal to power and build infrastructure there.
Utilities in Japan were already taxed, before the earthquake, given that January was the coldest in 25 years.
The 10 main utilities consumed 5.21 million tonnes of thermal coal last month, up from 4.55 million tonnes a year ago. They burned 698,385 kl of direct-burn crude oil (Ed. Equivalent to 141 kbd), rising from 440,534 kl a year ago. LNG burn also climbed to 4.12 million tonnes from 3.71 million tonnes.
With the cold weather diminishing (although it snowed around the damaged reactors yesterday) fuel demand would normally decline, but the balance between what supply is available and that which can be delivered is, in places now as much as a 25% shortfall. This has meant rolling blackouts that may well last into April. Some of this can be alleviated by load shedding by customers, and a re-distribution of load through scheduling. That will, however, take some time to organize,

Repair of the nuclear power stations is going to take a long time, and some may not be replaced by the current means of generating the power. It is perhaps likely that the emphasis will switch to natural gas, since there are spare turbines available, and a plentiful supply of the fuel. Since Japan would be importing LNG this has already given rise to an increase in price.
South Korea said on Sunday it will supply LNG to Japan's utilities after Tokyo made a request on Saturday. It added that Japan was likely to import an additional one million to 1.5 million tonnes of LNG per month after April.
However Korea, which also buys in that market is not as concerned with the rise in gas prices longer term, instead it worries about the rising price of coal, if this is used to replace the lost nuclear power. Coal is a likely intermediate-term answer that Japan may have little alternative but to adopt. But it will depend on who can get the most power available the fastest that may ultimately decide how the Japanese energy picture now changes.

Read more!

Monday, March 14, 2011

OGPSS - Oil producers just below 1 mbd, India, Argentina, Egypt and Oman

There were nine countries that, in 2008, produced between 500 kbd and 1 mbd , according to the EIA. Of these one, Azerbaijan, has been able to increase production to just over 1 mbd, and I wrote about it last week. Let me, therefore look at the first four of the remainder – India, Argentina, Egypt and Oman, in this post. The latter two are part of those countries where popular protests have in one case brought down the government, and in the other caused some changes to be made. How these will play out in terms of oil production, and oil exports remains one of the questions which are currently unanswerable.

India was producing 888 kbd of oil in 2008. It is a country with recognized growing demand for oil, to the point that Libya’s Gadaffi has offered it the chance (along with Russia and China) for them to replace Western companies who have shut down operations because of the turmoil. The growing internal demand for vehicular liquid fuel, remembering that India was the country that introduced the Tata Nano, is reaching record levels. Growth for different sectors of that market are rising at more than 10% a year.
Local car sales jumped 23% from a year earlier in February to 189,008 vehicles, showed data issued Wednesday by the Society of Indian Automobile Manufacturers, an industry lobby group. The figure is more than January's all-time monthly record sales of 184,332 cars.
Indian demand for oil is now more that 2 mbd above domestic production and it is increasingly dependent on imports. In 2009 the EIA showed where these came from:

Source EIA
As one looks at the coming global oil market, therefore, India is one of the BRICS nations (Brazil, Russia, India, China and South Africa) that will drive increased international trade, likely well above the levels of today. The EIA consider that Indian growth will be on the order of 100,000 bd per year, which will likely have to be met by additional imports.

The Indian situation in regard to natural gas is similar. Although production has started to increase signficicantly, demand continues to outstrip it.


In the global market India has often been overbid by China as both seek to guarantee fuel supplies into the future. India is currently seeking to add Russia to its suppliers. and there has been an ongoing effort to run a pipeline down from Turkmenistan into India, via Afghanistan and Pakistan, for a number of years. (The TAPI Pipeline) At the moment agreements are reported to be imminent, and these will be followed by natural gas purchases. It should be remembered, however, that the pipeline has to run through Afghanistan and over its thousand-mile length will pass through Kahdahar Province, and then through the troubled tribal areas of Pakistan.


Route of the planned TAPI pipeline to India.

The pipeline would deliver up to 2 bcf from the rich Turkmen fields, though some of the resulting flow would likely be tapped along the way to help both transmitting countries, before the remainder reaches India.

An alternative would be to run a pipeline from the natural gas fields of Iran down through Pakistan into India. This is the IPI pipeline, but (because of the sanctions on Iran) is less favored, at least by the US. And, unlike China, which has already created the pipelines into Turkmenistan, India is still not that far along in the discussion.

Planned route of the Iran, Pakistan India pipeline

Argentina does not attract a whole lot of attention on the hydrocarbon front page. Yet, the picture of how it illustrates the Export Land Model, can perhaps easily be seen from this plot from the Energy Export Databrowser.

The Argentine oil statistics (Export Energy Databrowser )

The situation in the Argentine is perhaps illustrated best by the actions of Repsol, Spain’s largest oil company.
“The sale of YPF shares is part of Repsol’s strategic goal to rebalance its portfolio of assets,” the company said.

Repsol is seeking to reduce business in maturing fields in Argentina while investing in exploration in Brazil’s offshore Santos Basin and elsewhere to increase output.
Thus, as production in the country falls, and demand rises, the amount that is available for export will likely continue to decline. The EIA, which listed Argentine production at 782 kbd in 2008, anticipates that it will be slightly down at 760 kbd this year continuing the trend shown above. Nevertheless, as Spain pulls out, China is moving in , buying out the Exxon Mobil interests in the country.

The natural gas picture is just a little further along, with production having peaked, domestic consumption which had followed right along, now requires that the country begin to import natural gas.

he Argentine natural gas statistics (Export Energy Databrowser )

It is expected that the natural gas fields in Argentina will collapse fairly quickly, with reports that the country will sensibly run out of the fuel within seven years. Within that time frame it is likely that only the current glut in supply will help. But (as with the UK) as more countries find themselves in this predicament, the supply excess will more rapidly attenuate.

Egypt was, of course, one of the two countries that led off the current popular protests against state leaders that had led too long. Producing 718 kbd in 2008, it was about that time that domestic consumption overtook production. Production in 2010 averaged 660 kbd, of which 540 kbd was crude oil.


Government plans to control demand as the country moves to import a larger percentage of that demand are likely now out of the window, at least in the short term. Because the country has about a million b/d refining capacity it will continue to both export and import hydrocarbons, but with the balance swinging toward the import need, within the frame of the current unrest, it is difficult to predict how this will evolve in the future.

Consider, in this regard, the natural gas exports to Israel and Jordan. Until five weeks ago a pipeline carried the gas across the Sinai . Following a terrorist attack on the pipeline flow has been restored to only a quarter of the previous level, and even that is now in question, as a leak just halted the flow again.
Egypt has been supplying 40% of Israel's natural gas since May 2008 – raw material for the production of 20% of the country's electricity – through the state-owned EMG company, businessmen Hussein Salem of Egypt, Yossi Maiman of Israel and Jewish American Sam Zell, and Thai energy company PTT.

The Egyptian opposition openly objects to the gas deal signed between the two countries in 2005. Since the Egyptian supply was halted, Israel Electric Corp. and the private power plants have been purchasing their gas from the Israeli Yam Tatis reservoir.

Gail has recently written on some of the back story to the Egyptian problems and with the rising population, and their increasing expectations from whatever new government finally evolves, it is likely that demand will continue to grow. However, with a relatively large reserve, Egypt can continue to export into the future, though the customers may be more politically screened.


Finally, for this session, I will refer again to Oman. I wrote about Oman just recently, as the protests in other countries had started to be repeated there. There has not been much of a change in the situation since then. Protests are continuing. Saudi Arabia is now responding more aggressively than earlier, troops having been sent into Bahrain And this, perhaps, implies that reactions will not be as peaceful as they have been to date. In that scenario it is not possible to predict whether even popular monarchies such as that of Oman will survive. That , in turn, calls into question the overall reliability of oil and natural gas supply from the Middle East and North Africa. Given the nervousness about nuclear power, it will be interesting to see how the governments of the world react. There are no easy answers

Read more!

Saturday, March 12, 2011

Texas combined temperatures

This is one of an evolving series in which I am looking at the temperatures over the past 115 years in the different states of America. I started in Missouri, and have gradually changed the format of the post as I have found different things in my exploration of the data. Last week in looking at Oklahoma I changed the plot which compares the population around the measuring station to compare it with only the average of the last 30-years of temperature data, rather than the entire 115 years. This does not mean that the last 115 years of data is not valuable, though once I started collecting the GISS records for the state, I found that longer term range does not appear to concern them as much. Of the thirteen GISS stations listed for Texas, there are only three with a temperature record over the full 115 years. The remaining ten stations only have records since 1948.

There are 49 USHCN stations in Texas, ranging from Albany to Weatherford, and they are spread not quite evenly over the state.

Distribution of USHCN stations over Texas (USHCN )

Looking for the GISS station record for Austin I found that there are 3 different records in the GISS file the longest one, however, (1895 to 2009) is for an Austin at a different set of co-ordinates (39.5 N, 117.1 W) to the city which is the logical choice. Of course the currently used site (Austin/Robert 30.3 N 97.7 W) only has data from 1948, but then, so do the others I mentioned. Houston, for example, has four stations, but the one that GISS has chosen to keep maintaining records for has only been around since 1948. While it may be that I am more cynical than most it should be noted that, if one looks at the record for, for example, the GISS stations in Abilene and Amarillo, there are very clear higher temperature spikes in 1933 and 1934, above the most recent high temperatures.

Abilene TX temperatures (GISS)

Amarillo temperatures over the last century (GISS)

However if one only plots the temperatures since 1948 (as most GISS stations do) then there is no evidence that the temperatures were, in that record, higher than the recent past. For example consider the case of Lubbock as an example.

Historic temperature record for Lubbock TX (GISS)

Looking at the overall temperature differences between the GISS temperature average, and that of the homogenized USHCN temperatures, there is a clear trend, although heavily influenced by the changing number of stations in 1948.

Difference between the average GISS station temperature and that of the homogenized data from the USHCN stations.

For Texas as a whole, of the average of the temperatures measured, adjusted for time of observation only (the TOBS temperatures) are used, then the state temperature appears to have declined slightly over the past 115 years.

Average temperature in Texas from 1895.

Texas is 790 miles long and 660 miles wide, including the bit that sticks up almost to Kansas and down past parts of Mexico. Thus it extends from 93.5 deg W to 106.5 deg W, and from 25.2 degrees N to 36.5 degrees N. is the second largest state, behind only Alaska in size. The mean elevation of the state is 518 m, and it runs from sea-level up to 2,666 m (Guadalupe Park). The average USHCN station is at a height of 438 m, while the average GISS station is at a height of 375.9 m. The Center of the state by latitude is sensibly at 31.25 degrees N. (both GISS and USHCN stations center on 31.3 degrees).

Turning to the usual geographic parameters, first latitude:

Correlation of temperature with latitude for Texas

Temperature correlation with longitude for Texas

However as the land rises to the West, this is explained within the relation to elevation:

Texas correlation with elevation

Using the 30-year temperature average for each station and plotting this against population, does not, for this state, give much of a correlation in this case

.Texas correlation of the last 30-year average temperature with population

And then there is the usual:

Difference between the reported USHCN homogenized data for Texas and the raw data corrected for time of observation (TOBS).

Sorry this is a little rushed today but a little excitement in the hotel with a fire alarm bringing us all down to the lobby and slowing things related to leaving. Nothing relative to the disasters of the rest of the world, but taking time.

Read more!