Monday, May 19, 2014

Tech Talk - Closing a coal-fired power plant

Much is made of large schemes to alter the way in which energy is produced in the United States. Large scale wind farms, and great arrays of solar panels attract large interest and funding, yet it is often in the smaller projects, from the individual solar panels to the change in energy sources for individual factories, or in this case a university, that there is at least as much progress, though with less fanfare.

I wrote, some eighteen months ago about the geothermal plans at Missouri University of Science and Technology (MS&T) previously the University of Missouri-Rolla and my academic home for 42 years. At that time the campus was beginning a process that would see the different parking lots and other open areas around campus disrupted while a series of vertical wells and horizontal pipes was laid beneath the ground, prior to its restoration.
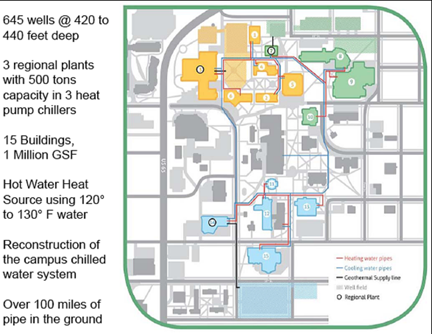

Figure 1. The MS&T Geothermal plan, showing the zoning of the wells and the connection pipe network.

Time has moved on since the initial plans were set in place, the trenches have been dug:


Figure 2. Geothermal trenches on campus, with walkways re-routed around them

Within the lots wells were then drilled roughly 430 ft deep, through which the system fluid will flow, and as these were drilled they were lined and connected by a secondary network.


Figure 3. Drilling the wells in the parking lots at the top right of Figure 1.

The network of wells is connected through plastic pipes that carry the water out to the wells, down and back up and then return to the central heat exchanger systems of the different circuits.


Figure 4. The heat exchange between the water and the ground (inhabitant )


Figure 5. The initial connections to the wells

Larger pipes are required to carry the water to and from the different fields to the processing plants where it is used to heat/chill water in a secondary circuit that is then distributed (depending on season to either warm or cool) through the network to the campus buildings.

Figure 6. The main pipe connections.

The parking lots have since been regraded, tarmac applied, and have, for some time been functioning as before.

Now the project is entering into the final days of installation, as a significant milestone has been reached. This week the coal and wood fired boiler #5 will shut down and all steam production at the campus power plant will permanently cease. Chillers are now operating for the summer to cool the buildings served by three of the regional plantsm which covers most of the air conditioning needs of the campus, and heat is being sent to six of the campus buildings.

Given the age, and change in the nature of the heating and air conditioning service to the buildings some still remain to have their systems upgraded, but most will now be completed while the students are away this summer.

Estimates of the savings that this will bring to the campus are in various forms. The coal and wood that have provided the energy source in the past will no longer be needed (and in time the plant will be removed). As well as the plant itself this will also free up the space where the coal was stored, and will improve the local aesthetic considerably along that side of the campus.


Figure 7. The campus power plant

The change in fuel will also see the overall amount of fuel required reduced, and it is anticipated that the energy use will be cut by 50%. Carbon dioxide emissions will be dropped by 25,000 tons a year (the system will still use significant amounts of natural gas) and water use will be cut by eight million gallons a year.

It is anticipated that the $32 million project will initially yield the campus a saving of around $1 million a year which will rise to more than $3 million a year as energy costs increase, while the system should not need significant maintenance for decades. There is a video of the project here). When completed, sometime next year the system will be serving 15 buildings with around a million square feet of floor space.

As the Missouri system was beginning, the initial phase of a similar system at Ball State was being completed . This will ultimately supply around 5.5 million square feet of campus space, and is expected to yield some $2 million a year in energy cost savings. Following the successful completion of Phase 1 of that project in March 2012, the Phase 2 project, requiring an additional 1,000 boreholes, was started in June of 2013, and is expected to be completed by some time next year. The four coal fired boilers at the plant (which consumed some 36,000 tons of coal a year,) were shut down in March of this year. Power will continue to be supplied from three natural gas boilers on campus. The $80 million project will have drilled a total of around 3,600 wells at the time of completion of Phase 2.

Oregon Tech has a 1.75 MW geothermal power plant, which combined with a solar electric array of panels on a 9-acre site off campus to produce most of the power needs of the campus. The dedication ceremony was on April 18th of this year. It is expected that the plant, which operates on a more conventional use of high-temperature water from the underlying host rock, will save the campus around $400,000 a year in energy. Water is brought up from 5,300 ft below the surface at a temperature of 200 degrees F, and used to spin two turbines, and as source of building heat, before being re-injected.

As the dates suggest this is a very new venture for universities and, as yet, there are not a lot of players in the game. Yet if the savings pan out to be at the level or greater than currently estimated it may well be more popular in the future as overall energy costs continue to rise. (Although in the short term natural gas prices may well rise a little, while coal prices are expected to fall a little).

Read more!

Saturday, May 17, 2014

Waterjetting 21b - collecting debris, or mined product

You don’t have to operate a water jet lance for any time before realizing that the rebounding water, and the debris from the operation can’t be ignored. On the other hand, after they fall to the floor they rapidly lose their energy and without some additional input will lie in the most inconvenient places until moved. Protection from the rebound is a critical part of the protective clothing and equipment that the operator wears (including side shields for the eye protection) but the collection and removal of the spent material is also critical to good operations, and in uses such as mining it is needed to carry the material to a point where it can be processed.

While this was fairly obvious to those who used water in earlier times to wash out soil and minerals and carry them down to flumes and separation devices, it was not always immediately obvious to those who experimented with the use of larger jets for underground mining. There are two critical velocities involved, once the particles are removed from the surface, these are the settling velocity and the suspension velocities of the particles. Essentially these are the speeds at which the transporting water is travelling that prevents, or encourages, the particles to settle out. This is an important part of drilling horizontal holes, where the drill cuttings can settle in the long hole hehind the drill, and can both stop the drill from moving forwards and also trap it when it tries to retract (personal experience).


Figure 1. Settling velocities (after VCCS)

Because of the wide range of particles that are mined by a jet, it is sometimes suggested that flow velocities in flumes remain above 40 ft/sec. It becomes a lot more difficult to get particles back into suspension after they have settled out.

Because water and debris are dispersed around the impact point after jet impact and because the amount of water needed to keep the particles suspended and moving has to be high, this often means that the geometry of the excavation has to be tailored to capture and confine the water in a narrow space with the mined product.

The National Coal Board carried out early experiments in coal mining in Wales at Trelewis Drift. (Jenkins R.W. “hydraulic Mining – The NCB Installation at Trelewis Drift” MSc Thesis, University of Wales, 1961).


Figure 2. Early NCB remotely operated monitor (after Jenkins ibid).

The 5-ft 6-inch thick seam dipped at roughly 6 degrees, and the monitor was used initially to drive the drift, and then to slab off coal from the pillars on either side, and then to mine along the face of a pillar, driving coal from one drift to the next adjacent, as the drift was retreated.

Part of the problem that arose was that the coal broke off in pieces that were up to 2-ft thick, and once these fell to the floor they became more difficult to recover, particularly where they were scattered (and this was the reason that the monitor was being operated remotely since the debris was reaching the miners). (Jet pressure was around 1,000 psi). The mine was naturally very wet (over the waders of some miners) and production did not exceed 45 tons a shift, even though the costs at the time were around 50-pence per ton in 1963. The conclusion was that the slope of the seam was not adequate to help enough with coal transport and the experiments were terminated.

This is in contrast to work elsewhere (the British trials had been commissioned after Russian hydraulic mining trials had been reported as successful). But the Russian work was carried out in the Donets coal basin, where the seams are much steeper, and more difficult to mine conventionally.

V.S. Muchnick wrote his dissertation on hydraulic coal mining in 1935, describing these early trials. While it was difficult to manually work in the steep seams, setting up a simple monitor that would wash away the coal, which would then fall under gravity to the drift tunnel beneath the mining operation was much more successful.


Figure 3. Early Russian Monitor (RGM-1)

Because of the Second World War hydraulic mining did not get its start until 1952 at the Tyrganskii-Uklony mine in the Kuznetsk Basin. Production in the hydraulic sections was anticipated to be 500 tons.shift, but by the end of the first year it had already exceeded 600 tons, more than twice conventional mining production. In the early operations the coal was weakened by blasting, but by 1957 jet pressures were raised sufficiently that this was no longer needed.


Figure 4. Showing the major Russian coal basins (Gazprom )

By 1979 there were nine major hydraulic mines in the Soviet Union with an annual production of over 8.9 million tonnes. As the mining operations expanded, so the monitors were increasingly operated remotely using hydraulic cylinders to direct the jets at the coal. At pressures of 1,500 psi the monitors could mine over 50 tonnes an hour, using around 650 gpm of water. (This was later doubled).

In almost all these operations the mine is worked in retreat, first driving the drifts to the back of the section, and then mining back, allowing the coal either to fall into the drift, where the water volume is sufficient to carry it into the flume, or pushing it down to the underlying drift, where it can similarly be collected.

Figure 5. GMDTs-3M monitor used in the Soviet Union

The mining pattern changed with the thickness of the coal, and with the steepness of the slopes at which the seams ran, although the access drifts were run more up dip, while the mining drifts were at a shallower angle closer to horizontal, so as to make working conditions easier, and to more effectively remove most of the coal from the section. In this way the coal collapsed under gravity down to the drift, where the water would float it into the flume. ( A barrier across the drift would confine the water and coal and act as a feed mechanism).


Figure 6. Method of mining in Soviet hydraulic mines in gently dipping seams of average thickness.

I will discuss the expansion of the technology around the world in later posts.

Read more!

Sunday, May 11, 2014

Tech Talk - without Cellulosic Ethanol where will transportation fuel come from?

There are some ominous signs that we are beginning to reach a point where it is less economic to look for and develop new supplies of oil, as costs rise, return on investment becomes less certain, and alternate opportunities exist for the funds that promise a better return with a lower initial investment. The problem, of course, that this generates is that as existing fields decline, so the fields that remain are likely to be smaller and more difficult (and thus expensive) to develop. To meet the need, therefore, exploration investment needs to increase, rather than decline, since the need is to find an increasing number of the smaller fields. Without those searches, then future supply will increasingly be unable to meet the growth in demand.

Further, given the time that is required to find new fields, develop them and then connect into a distribution network that carries the oil to refineries and the customer, without the knowledge of what is going to be needed, the crisis of under supply will approach not only more rapidly but also with less flexibility in being able to remediate the shortages when they start developing.

A large part of the problem lies in the way that oil is used. With much of it being refined into transportation fuels – in the USA some 70% - there is little in the short run that can be used to replace it.


Figure 1. Percentage uses of petroleum products in different sectors of the USA (Institute for Energy Research )

Since we are unlikely to see much change in power sources for vehicles in the next couple of years, as the oil shortage begins to bite there is insufficient flexibility in the system to offer an immediate alternative that will be viable. While corn ethanol has provided (at some cost) less than a million barrels a day it has reached an apparent plateau of production that is unlikely to change, given the alternate demand for the corn.


Figure 2. Ethanol Production in the United States (EIA) (Note: A billion gallons a year is roughly 65 kbd).

Cellulosic ethanol remains an unfulfilled promise, back in 2010 there was already some concern that it would meet even the initial targets, as time has worn on these seem increasingly out of touch.


Figure 3. Projected needs for cellulosic ethanol to meet projected national needs by 2030. (Bloomberg Biomass Magazine )

More recently Robert Rapier has noted that KiOR, one of the companies that Vinod Khosla founded and then took public as a promised source for this ethanol, is failing to live up to its promises, and may likely soon be bankrupt. It began shipments in 2013 from its Columbus, MS plant but of only nominal quantities of fuel relative to the future need. Shortly thereafter the plant shut down through the first quarter of this year, needing additional funds to improve operational efficiency.

Share prices that started at $15 have now dropped to $0.64, having recently visited $0.59 a share. Investments to make those changes may only come for a limited time, perhaps only through August, from Mr. Khosla. But the company has to pay back the $75 million it borrowed from Mississippi – with the next $1.8 million payment due June 30th, and there don’t appear to be other investors waiting in the wings. The state will get the assets should the company fold.

Sadly this is another exemplary case of a number of firms who promised much in this field, but have so far delivered relatively little, although there are several new plants coming on stream this year. The EPA has suggested that the production target for this year be lowered from 6 billion liters to 64 million liters – a significant cut, and one indicative of the likely difficulties in finding alternate sources to petroleum based products needed for the transportation industry when oil becomes less available.


Figure 4. Status of the Cellulosic ethanol production plants planned to be in operation by the end of this year (Nature )

The INEOS plant in Florida began production last July but then shut down and is looking to achieve stable production this year, after upgrading the facility, which will have a capacity of 8 million gallons a year. Not much against the millions of barrels a day that may be needed, but the company has the advantage that it is using local municipal waste and also providing power to the community – which provide other gains to their operations.

The Hirsch Report was published in February 2005. In that report the authors noted that it would likely take up to 20-years of concerted effort to produce an alternate source to petroleum based fuels. We are now nearly ten years through this potential period of grace, and the major candidate to provide that alternate resource is so far being found wanting.

The writing on the wall is increasingly discernable, oil companies are cutting back on exploration investment ensuring that future discoveries will likely be smaller in number as well as in size. This will reduce the amount available, requiring an alternate source. Cellulosic ethanol, which has been held up as one answer to the problem, is falling significantly short of the mark needed to make up for possible conventional shortfalls within the next decade.

The question then becomes – what is the alternative? We could look to making oil from coal, peat and other alternate sources as was done in Germany in World War 2 and in South Africa, where SASOL continues to operate. But planning, permitting, building and operating a facility to convert coal is something that will take at least seven years, and require initiatives to make commitments that are currently lacking.

What else is there? Bear in mind that solar and wind energy production largely goes to address the electricity market – which is largely separate from that of the transportation fuels. Thus their development will largely not impact the problem, since electric cars cannot be produced in the quantities that will likely be needed in the time that remains. Bedazzled by the promise of cellulosic ethanol we have failed to properly pursue the alternatives that now look as though they will prove to be needed.

Time is running short, but awareness of the problem is as yet, even less evident. Basking in the transient benefits of increased domestic production, even as turmoil has cut global oil production by an estimated 2.3 mbd, production that won't soon return, there is less inclination to face the issue than there has been in previous Administrations, even though it is now becoming possible that it will be this Administration that first sees the impact.

Read more!

Saturday, May 10, 2014

Waterjetting 21a - Of peat, coal and New Zealand

During the historical development of waterjets there was not a lot of change from the time of the Ancient Greeks, who found water flow being used to uncover and move minerals such as gold, and the Northern British miners of the 1800’s who were still using this tool in a form known as “hushing” as a way of helping to get lead ore out of the ground. The use of a directed higher-pressure stream (even though only powered by gravity) through a nozzle, as a way of mining the gold ores of California was the first step in a major change.

In part this was because the higher pressures sped the process up considerably, and in part it was because there was more method in the way that the jets were applied, so that the operators were kept safe and away from the area where the jets were mining, and where the surrounding rock was unstable. This had advantages in other applications.

Consider that peat is a fuel that is still mined and used in various parts of the world. (As a young man I helped my father dig peat in the spring using a shovel, and then carry it back to my Grandma’s house where it would dry over the summer and be burned the following winter.) But many peat bogs are relatively unstable places, so that bringing in heavy equipment is difficult given the soft ground. Modern practice is to cut large drainage channels around the mining area, allow the water to drain out and then mine the dried peat, which is more often these days used in gardening.

However, before such large operational processes were around peat miners had used water jets (along the lines of those used in California) to break out the fibrous material, and then to move the liquefied slurry in pipelines which are easier and lighter on the land than road beds. Back in 1979, for example:
Western Peat Moss Ltd in Vancouver is currently using hydraulic mining and pumps a peat moss slurry of a concentration varying beteen 0.75 and 1.5% by mass, a distance of 3.65 km in a pipeline 0.3 m in diameter, at a rate of 340 cubic m/hour (1,500 gpm). A similar operation is being used in Alberta by Hood Manufacturing Ltd, for the mining and transport of Peat moss.


Figure 1. A peat mining operation (the peat is transported away in the pipeline. (SRS Crisafulli)

Given that peat covers about 3% of the world land surface it is sometimes surprising that more has not been made of the resource, although it is physically strenuous to mine manually, and the high water content means that it must be dried before it can be used. This is why the largest market in America has become the garden market where the costs can be more easily absorbed by the market, and modern vacuum mining of the dried material has become the more common modern method of extraction.


Figure 2. Peat distribution around the world (SRS Crisafulli).

The first mention of hydraulic mining of peat came from Prussia, and by 1914 it was used as the primary source of fuel for the Electroperedacha Electric Power Station in Russia. After the war that usage had grown to mining roughly a third of all the peat mined in the Soviet Union. (Yufin A.P Hydromechanization, State Scientific Technical Press of Literature in Mining, Moscow 1965). There was, however, another place where remote mining can have a considerable advantage.

There are many places in the world where coal beds, originally laid down horizontally, have over the course of time been tilted to steep angles. These mines are very difficult to work in, since the steep slopes can be dangerous to workers, and productivity is generally quite slow. It appeared to dawn on mining engineers in both Russia and New Zealand at about the same time, that using water to mine and move the coal might get away from many of the problems of moving men, material and supports to a working face that isn’t that stable or needed for very long. A simple schematic shows the process:


Figure 3. Early New Zealand hydraulic mining operation (New Zealand Ministry of Culture and Heritage.

In the initial operations the coal was first weakened by blasting it with explosive, and as pressures and flow rates were increased this was found to be unnecessary, and the coal could be mined from the sold. Further, although the illustration shows that a man is directing the stream at the coal face, earlier methods had the stream being directed along a face, carrying the coal from one entry to another, where it could be flumed and carried away, by the same water flow.

By a suitable choice of geometry this did not need an operator to guide the jet stream, and so the practice arose back then of firing the face, and turning on the water flow and going home for the evening. When the miners arrived back the following day the coal had been moved down to storage (or in some cases out through a lower adit and out of the mine) and the face was cleaned off. All that was needed was to insert new roof supports in the exposed part of the seam, move the hydraulic channel over to the new face, drill it, and then, at the end of the shift, blast down the coal and go home. I will confess this is a much less strenuous way of mining than the 15 yards length of blasted coal some 6 ft deep that I had to physically move onto a conveyor each day with a shovel and pick (to break up the big lumps and to drive wedges above the props to hold the roof up) back when I was an Indentured Apprentice.

There are a number of different ways in which the coal was mined, with the pattern of extraction changing with the slope of the coal seam, the thickness of the seam and the strength of the overlying rock (since as the jet mining distances grew greater the area mined was no longer supported) and I will discuss some of these in more detail over the next couple of posts or so.

Read more!

The Icelandic Earthquakes are a little stronger

There seems to be an increase in the strength of the quakes that are happening along the southern part of the line, initially focussed on the Reykjanes Ridge, but now apparently spreading further north. Although it looks intense, remember the scale over which the events are happening. And also remember that these indicate some movement, so that those parts next to them that don't move will build up stress that must, ultimately, be relieved.


Figure 1. Earthquakes in Iceland in the 48 hours before May 10,2014 (Icelandic Met Office)

There is no more. . . . .yet

Read more!

Wednesday, May 7, 2014

Tech Talk - Fast destruction and slow reconstruction

Underlying many of the projections of future energy supply that are now being made there are, as mentioned earlier, a lot of assumptions that are beginning to appear more questionable as time passes. Much of the concern has to focus on the instability in the Middle East and North African nations (MENA) that are now increasingly unsettled by civil conflict. While optimism in many reviews anticipates that the turmoil will decline and nations will return to pre-conflict levels or higher, particularly in the case of Iraq, unfortunately this conflicts with much of what we have learned from recent history. Sadly there is also the history of Gazprom, which now also suggests that rosy visions of the future are only that, and what is coming is likely to be much grimmer.

Considering first Libya, once the infrastructure of an oilfield and its links to the outside world, and the operators that run it have been destroyed, seriously damaged or dissuaded from being there, then, particularly where conflict continues over time, restoration of pre-conflict volumes can take more than a decade. Once combatants become embittered by the realities of civil war, so their willingness to subsume the hatreds and other burdens brought on by loss becomes more difficult to engage, and conflict drags on with its continued losses for society. Libya is a sad example of how rapidly production can collapse.


Figure 1. Libyan oil production pre-current conflict (SEPM strata )

The country has now reached as low a rate of daily production (around 240 kbd) as it has seen in recent years.


Figure 2. Recent Libyan oil production (from OPEC MOMR)

For some time the powers that be have continued to hope and even project that Libyan production can return to levels of around a million bd, but those hopes seem dubious at best.

Just a week ago the National Oil Corporation announced that it was lifting the “Force Majeure” designation for the Oil Harbor at Zuetina. The first tanker was to load on Friday. According to a Bloomberg report the Ottoman Tenacity was to pick up a cargo of 600,000 barrels from Zuetina and carry it to Europe. The ship was reported to be loading on Friday and is currently just off Cagliari in Sardinia.


Figure 3. Location of the Ottoman Tenacity on Wed May 7th (Marine Traffic )

A second ship was supposedly loading up to 850,000 barrels at Haringa destined for France. Yet according to Marine Traffic it is now (Wednesday) off the coast of Tunisia, and does not, in the end, appear to have revisited Haringa.

The situation in Libya is not really stable, despite the hopes. On Sunday the Parliament swore in a new Prime Minister but his support is not strong, and factions continue to challenge his election. Attacks on the military are also on the increase. Meanwhile the blockade of the Sharara oilfield continues. It is hard to see oil production increasing much above the current levels, despite the optimism.

Yet if this effectively has removed a million bd from the global market, where can this be made up? In the short term Saudi Arabia increased production to cover the shortfall, and is still producing around 9.7 mbd. OPEC production overall remains at around 30 mbd, and is projected to remain at this level over the year.

OPEC notes that the Former Soviet Union is expected to increase production by around 200,000 bd this year, of which almost half will come from Russia itself, but OPEC are careful to include a word of caution in their predictions of Russian output.
The risk to Russia’s supply forecast remains high on technical, political and natural decline grounds.
It is the increasing political risks associated with Russian production, and the supply of that fuel to Europe that are perhaps of most concern. An article in Der Speigel points out that the Russian grip on German fuel supplies is only increasing. One of the Russian oligarchs has just bought one of the German oil and gas production companies for $7.1 billion, and now controls a fifth of German natural gas production and a quarter of its oil production. Another fifth of the German natural gas market, provided by Wingas, is also now Russian as Gazprom bought the company, and its distribution network, in a sale to be finalized this summer. And while Europe is seeing more LNG receiving facilities being constructed there is still a global shortage of export facilities to match that demand. As a result current facilities are significantly under-utilized.

Gazprom has, in the past, shown that it can, when necessary, play hard ball to ensure that it owns and controls the market for natural gas (just ask BP or Turkmenistan), and with the demise of the Nabucco pipeline is in increasing control of natural gas supplies into Europe. That condition cannot change in the short term, LNG facilities take years to plan, permit and construct, and thus the control which Russia exerts over Europe through this grip on the various supply pipelines is likely to continue to influence European opinion and, more realistically, actions in the next few years.

What this all means for the future of Ukraine is rather unfortunate – regrettably it is not clear that Russian ambition will end there and one would suspect that, given the limitations in response to the current and earlier (Georgia) Russian activity, that it will not. How this will affect overall oil and natural gas supply is unclear. OPEC concerns over future Russian production levels appear justified, especially since future developments in Russia will require increasing levels of capital, which might instead be directed at supporting Russian foreign policies – reducing overall volumes available, and more particularly the volumes that Europe has come to depend on. It could make for a couple of interesting years, since there are few alternatives that can be developed within that time frame. And certainly there is, at present, little will to make the capital investments that might bring them about.

Sadly history suggests that the outcome will not be a good one, there are few precedents that would show how one might get out of the increasing messes caused by political instability.

Read more!

Saturday, May 3, 2014

Waterjetting 20d - Proximate Jets

One way to illustrate the benefits of simultaneously cutting adjacent channels through a material is to artificially show how the jets would appear if they were simultaneously cutting through glass beads. An earlier post showed what water penetration around single jet cutting into beads looked like, and if a second image is placed close enough to, and at a slight converging angle, then one would get:


Figure 1. Simulated dual jets in glass beads using Photoshop to show the combination.

The figure shows that there is a zone at the bottom of the two cuts where the particles under the rib between the jets is saturated with water. The material has no strength, so that the returning water from both cuts has, as a result, enough power to remove not only the material under the jets, but also that between them. (Which is why you can’t show this in reality). The combined effort of the two jets produces results greater than the sum of their individual efforts.

There are a number of different applications, other than just in soil removal, where this can be considerable advantage. A number of rocks (coal and shale particularly) have weak layers within them, known as the cleat and bedding planes in coal, so that driving the water along those weakness planes, from two sides, will again liberate all the material to the free side of that pressurized plane.

But, at higher pressure it also works for removing of layers, such as, for example, the old paint, coatings or contaminant from a harder, typically metal, surface. A single jet, for example, can cut down to the metal surface, and may peel up the edges of the over layer along the cut, but there is insufficient immediate pressure to do more.

However if there are two jets cutting along parallel to one another, then if the two pressurized zones intersect (as Figure 1 shows) then there are free surfaces all around the intervening material, with a driving pressure to lift and remove it. Again the result is to produce significantly more material removal that could be achieved by two passes of a single jet. For this to work, however, the two jets must be close enough to each other that the pressurized zones within the material intersect. The distance over which this works varies considerably with the material being removed. In a well structured coal or a weak soil, for example, the distance may be measured in inches, in a tightly bonded paint it may be merely millimeters. Only testing can determine, as a function of jet flow rate and pressure, what the critical distance is for different materials.

Some materials are sufficiently cracked, and again coal is a good example, that the two jet system is not always necessary to achieve acceptable results. If the jet is aimed to flow into the horizontal bedding planes, for example, and then strikes a perpendicular cleat plane, then if there is an adjacent free surface, the water force may be sufficient, as it then surrounds the block of coal, that it can liberate it with only one jet. There is a difference between the volumes when the jet is used to pressurize one set of layers relative to the other. Perhaps the best illustration of this comes from some trials of coal mining in a steeply dipping seam of coal in Colorado.


Figure 2. Remote testing of a coal mining monitor inside the portal of an underground mine in Colorado.

Where the monitor was used to cut single passes across the face of the coal then there was a slight increase in the volume of material as the nozzle diameter (and thus water flow) increased. But where the jet was cutting into the cleat to fracture the coal (fracking) then the gain in volume mined was significant, and when the jet could work to pressurize the horizontal bedding planes, and thus to break off large slabs of coal, then the gain was even more significant.


Figure 3. The gain in coal production as higher volumes of water are used to pressurize internal fractures within the coal, breaking off greater volumes.

The larger nozzle diameters ( up to and beyond an inch) make it easier to sustain the pressure within the weakness planes of the coal, as the water spreads along the length of the fracture, exerting increasing amounts of force on the coal and thereby breaking it from the solid and moving it into a free space, provided that one exists for it.

The best mechanism for achieving this break depends on circumstance. If, for example, one is driving an access tunnel, then large free surfaces may not exist, and it may be less easy to find the weakness planes to exploit for large material removal. One way that Chinese investigators overcame this problem was to oscillate their cutting nozzle in a plane perpendicular to the traverse line.

Figure 4. Chinese Oscillating head miner

A simple cam connection to the nozzle drive forces the nozzle to move up and down during operation cutting a wide groove in the slab, and with the nozzle moved sufficiently that the ribs between adjacent passes is also removed by jet action.


Figure 5. Volumes of simulated coal removed in equivalent times. The top slot is removed without the jet oscillating. (It can be seen in the center of the wider slot). The lower slot is cut with the head oscillating at the same time as it is traversed.

Again, where the contrast between a confined jet and one which can work to a free surface is examined, the change in the volumes extracted can be seen to be quite significant.

The important lessons to learn in this are that the jet itself penetrates very rapidly into the material ( about 1/100th of a second) it then starts to lose efficiency as pressure is lost due to the effects of the side walls of the cut made and in the loss of pressure to water penetrating into the surrounding materials. If, however, that pressure can be developed as an additional means for removing material, by providing an adjacent free surface, or second pressurized zone from an equivalent jet cutting nearby, then the total volume of material removed can be significantly improved.

Read more!