Sunday, February 13, 2011

Nebraska combined temperatures

Heading south from South Dakota one comes to Nebraska, as I wander around the states comparing the GISS temperatures, the USHCN homogenized temperatures and the TOBS (Time of Observation corrected) raw data for the stations of the state.

Nebraska has 46 USHCN stations but as with some earlier states the stations seem, in general to be close to the interstates, and as with SD concentrated more in the south-east.

USHCN stations in Nebraska

There are three GISS stations in Nebraska on Chiefio’s list, and these are in Grand Island, Norfolk and North Platte. And, out of the gate, Grand Island has only got temperature records since 1944.

Temperature record for the GISS station at Grand Island NE

The information for Norfolk is also only for the past 56 years

GISS temperature record for Norfolk NE

And that leaves North Platte, which has a full record (I was beginning to get a little worried). It shows a steady rise in temperature, pre-1940, which the other stations obviously cannot.

North Platte NE GISS station temperature record

Inputting the temperature data was otherwise straightforward, and although many of the stations are in small communities it was not until I got to Purdum that I had to use zip-area-code, rather than citi-data for the population (97). And that is the only one. As I have come to expect the GISS stations are in the larger communities (average 31,423) relative to the average USHCN station (2,912). The effect of the truncated data from two of the GISS stations can be seen in comparing their average to that of the USHCN stations, the overall average difference is, for this state, only 0.07 degrees.

Difference between the average GISS station and the average of the homogenized temperature values for the USHCN stations in Nebraska

Overall, turning to the TOBS data, the state is warming at the rate of 0.7 degrees F every century. The homogenized data would suggest that the rate is 1.2 degrees F per century.

Average TOBS annual mean temperature for Nebraska (USHCN)

As far as the geography of Nebraska goes, it is 430 miles long and 210 miles wide, stretching from roughly 95.5 deg W to 104 deg W, and from 40 deg N to 43 deg N. The average elevation of the state is at 792.5 m (ranging from 256 m to 1,653 m). The average USHCN elevation is 650 m and the average GISS station is at 628 m.

Looking at the effects of geography on temperature. There is the expected fall with higher latitudes


And the apparent fall in temperature as one moves West.


However, as I have noted before, this is likely due to the rising elevation as the land moves West, and there is a stronger correlation with elevation:


Turning to population, again the largest populations are with the GISS stations, which I have included in this plot.


And finally there is the difference between the homogenized data that USHCN produces, and the raw data that has been corrected for time of observation.


Read more!

Thursday, February 10, 2011

Icelandic eruptions - no need to panic - yet!

Iceland has reached the MSM again. There is an article in today’s Telegraph about some recent activity on the island that may be the pre-cursor to another, but much larger eruption than that of last year. It turns out (as I discuss later in the post) that this may not be as much of a concern as I initially thought, but it gives me an excuse to update information on what is going on up there.

Last week there were three earthquakes greater than M3 in the region of Bárdarbunga, and there has been a continuation of activity in the region since then. It is, however, quiescent this morning, so that a check on the Iceland Met Office (IMO) site, is showing little activity in the region today. The Icelandic names are fairly long, so I am going to the Norse names of Loki, Laki and Katla for the three major areas where eruptions might be expected. The volcano that erupted under the glacier at Eyjafjallajokull last year does not have such a name, since it is much smaller than the other 3 – in itself a little worrying. The volcano that is now a worry is the one known as Loki. Laki and Katla are also a bit of a concern, and I’ll explain that a little later. Their locations are shown in general on the overall earthquake map where the IMO displays earthquakes.

Map showing earthquake activity in Iceland (IMO)

Loki has erupted in 1910, 1938 and lastly in 1996 and has not been, in general, that severe. The 1910 eruption was evaluated at a Volcano Explosivity Index of 2. There was a smaller eruption (which only affected local air traffic) in 1996 to the East of the current activity. Loki lies under the Vatnajokull glacial cap, which is about half-a-mile thick.

I have been keeping a record of the Icelandic quakes greater than M3 since the eruption at Ejyafyallajokull last year, just to see if there are clear pre-cursors. This is because the eruptions there have often been precursors for the subsequent, much larger eruption at Katla, which is relatively just next door.

The full list of earthquakes in Iceland greater than M3 is at that bottom of this post and I continue to add quakes there as they happen. The IMO site allows you to zoom in (by clicking the mouse at the relevant point) to different zones on the map. And if you do that for the Loki area, then you will get this map.

Map showing the Loki volcano region of Iceland (IMO ) The area in white is the Vatnajokull ice sheet.

Note the locations of Bardarbunga, Hamaninn and Grimfjall. Here are the last quakes: The information is tabulated as date, latitude, longitude, magnitude (depth and location).

81) 01-13-2011
64,400, -17,250, 3,8 (14.4 km deep 1,2 km ESE of Grímsfjall)

82) 01-25-2011
64,514, -17,667, 3,0 (1.1 km deep 97,5 km ENE of Hamarinn)

83) 02-02-2011
64,682, -17,361, 3,1 ( 1.4 km deep 9,2 km ENE of Bárðarbunga)

84) 02-03-2011
64,764, -17,266, 3,3 (1.1 km deep 3,3 km SW of Kistufell)
Not that far from the last one

85) 02-06-2011
64,501, -17,609, 3,4 (1,1 km deep, 9,7 km E of Hamarinn)

86) 02-06-2011
64,689, -17,020, 3,3 (1,1 km deep 13,6 km SE of Kistufell)

87) 02-06-2011
64,753, -17,256, 3,0 (2,7 km deep 3,8 km SW of Kistufell)

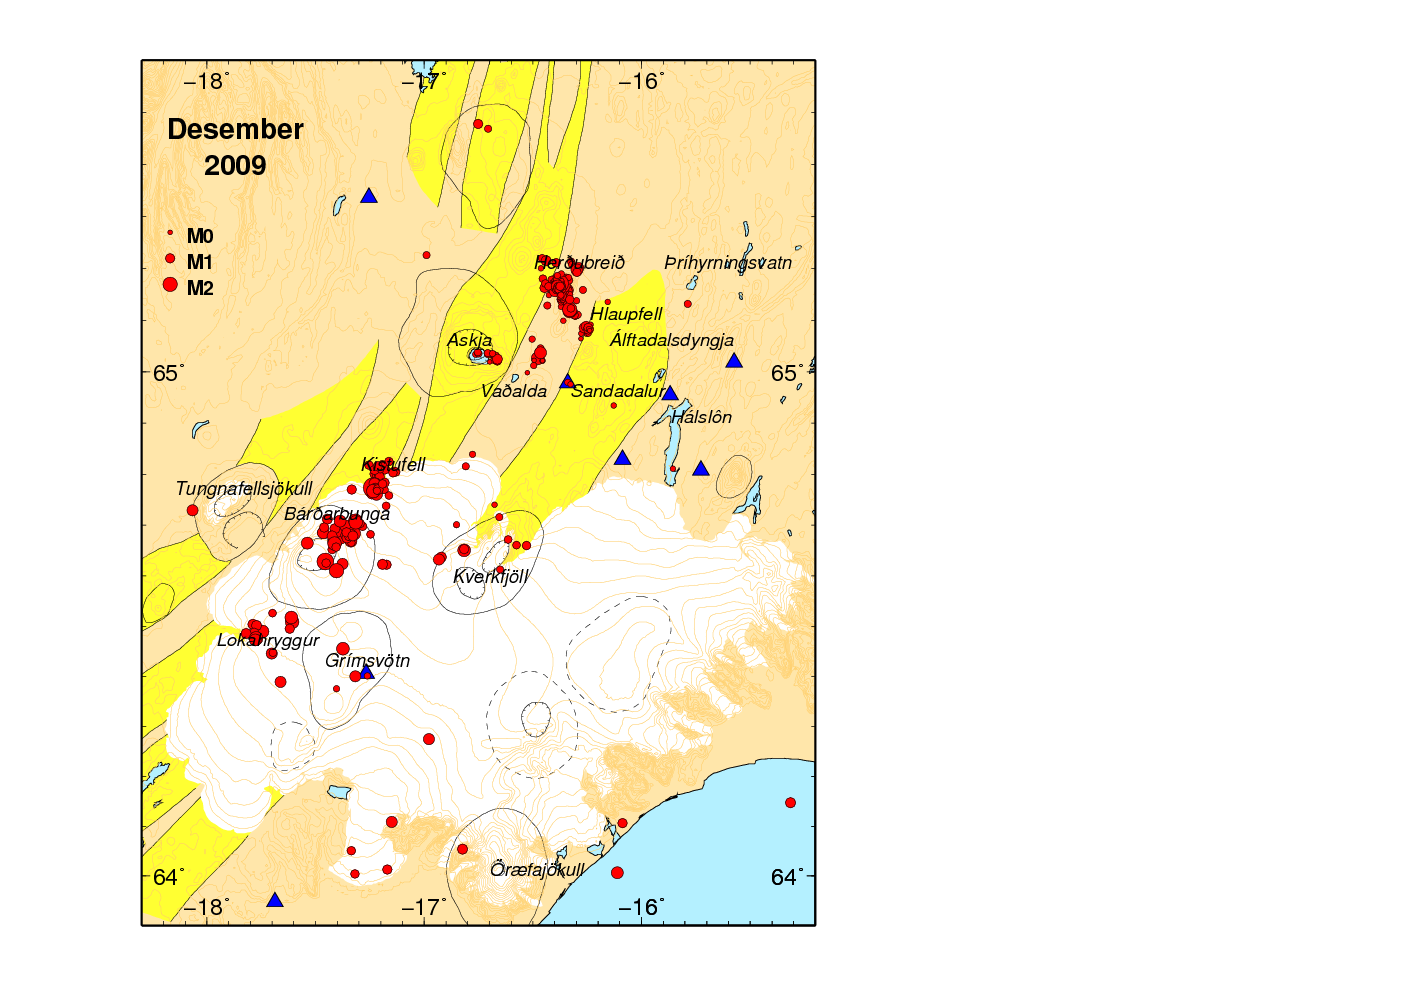
Kistufell is not on that map, but is just a little north. And in looking for a map showing the location (shown below) I found the Iceland Volcano and Earthquake Blog which suggests that there are often a lot of earthquakes in the region, and that, by themselves this is not a reason for concern. That has since been updated (I suppose in light of the Telegraph article) to a post yesterday drawing attention to the IMO Press release which says:
Presently, there are no signs of an imminent volcanic eruption in Iceland. The Icelandic Meteorological Office (IMO) did not issue a warning last weekend in connection with increased seismicity beneath the Vatnajökull ice-cap. If signs of an eruption were apparent, IMO would issue a warning immediately.

Location of Kistufell relative to Bardarbunga. Note the frequency of small earthquakes around the site – this in December 2009. (Iceland Volcano and Earthquake Blog)

Well with that concern abated for now, let me just reiterate why I remain a little concerned about Laki and Katla. As I have watched the IMO site over the past 9 months I have noticed that there has not been much activity in the Laki region. That is the region between Katla and Loki. If the two plates are continuing to move, and the quakes along the line show that they are, then there should also be small quakes in this region to allow the plate movement. There has not been that much, and it might indicate a build-up in stress in the region, so that when the point of failure occurs that it might be more violent.

It was the eruption of Laki, along a 15-mile fissure in 1783 that has, among other things, been blamed for the French Revolution. The eruption was so severe and so long that it killed a quarter of the Icelandic population, affected not only the European harvest but also led to a very bitter following winter (the Mississippi was reported to have frozen as far south as New Orleans).

The other concern is down at Eyjafyallajokull, and as was noted at the time, this has in the past been a precursor to the eruption at Katla about 18-months later. Well just in case that is going to happen again this year, I decided to map, by month, the quakes in the region, starting last month.

What I am interested in is to see whether there is a channel set opening from the original eruption that would lead to the Katla caldera. I have only been doing it since January, and had not planned on posting it until I had more data, but if you squint at this map in just the right way, you can see that there might be a connection forming. We will see, as the year moves on.

Earthquakes around Eyjafyallajokull in January 2011. (All below M3) (Source IMO)

But for now, panic over, we can go back to worrying about oil, natural gas, politics and the climate. (I believe it got down to 2 degrees F here last night, and I have a walkway to clear).

Read more!

Tuesday, February 8, 2011

The Sundering of Sudan - it may increase oil production

The disruption that began in Tunisia is continuing in Egypt, with changes also starting in countries such as Jordan and Yemen. And in the midst of this turmoil, the (finally) democratically dictated separation of Sudan into two separate countries is moving towards the July 9th separation date. At that time Southern Sudan will divide from the North. Sudan has only been selling its oil on the world market since 1999 and the transition will impact those exports.

With the hopeful end to the conflicts in the country, there is also now an increasing possibility that the oil and natural gas resources of the two new nations will be developed. Until recently China has been the most active player in the region, but as the results of the vote have become apparent, Russia too is indicating an interest.
Like other players in the world oil market, Russia would like to promote its energy interests in that region. Moreover, it is capable of becoming a serious competitor for both Western and Chinese companies in oil production and power supply. Russia’s clear competitive advantages are its technological experience in developing oil fields in many regions of the world, its investment potential and the absence of any political conditions for energy cooperation. The latter is important both for Khartoum and Juba, the current administrative centre of South Sudan, because after the referendum both sides will have to reconsider the criteria of their independence.


Map of Sudan (United Nations ) The blue tone marks the bounds of the South Sudan States.

The EIA notes that in 2009 oil was the major revenue generator for the country, bringing in more than 90% of foreign earnings. Within the country the primary energy source is that of combustible renewables and waste, reflecting the rural, non-electrified population of much of the country. And although BP (as reported by Energy Export Databrowser) suggests that virtually all the oil it produces is exported:

Oil statistics from Export Data Browser, based on the BP review.

The EIA find that there is a significant, and growing, domestic market, that uses a significant percentage of production. Various estimates of the size of the export market (for reasons given below) hover around the FT estimate of around 500,000 bd.

EIA statistics on Sudanese oil production.

The EIA note, as is shown on the graph above, that production and exports developed after a pipeline was run 1,000 miles from the oil fields up to Port Sudan. And it should be noted that while about 75% of the oil reserve (perhaps 6.5 billion barrels) is mainly in the South, that port (map above) is in the North. And as European nations in particular, but also those of the FSU, know from the past, those who control the pipeline can often remain in a position of power. The previous arrangements and actual distribution of funds have been viewed with some suspicion.
Much of this is due to the opacity with which Khartoum's captured state machinery operates, siphoning as much as 40% of total oil revenue through various forms of mispricing. Meanwhile, though the Comprehensive Peace Agreement (CPA) of 2005 established that 50% of revenues must be remitted to the Government of South Sudan (GOSS), this share is determined not by volume but sales. Khartoum markets the oil nearly exclusively and determines price as well as volumes exported, with little or no independent monitoring. According to U.K. watchdog Global Witness, major discrepancies of between 9% and 26% have been documented, underpaying the GOSS by as much as $700 million. Little is known of the $7 billion in oil revenues remitted to the South as accountability mechanisms were never factored into the CPA.
That initial agreement is set to expire this July. The pipeline supplies oil to two refineries (at El Obied and Khartoum) that supply the domestic market.

Current pipeline and bid blocks in Sudan (USAID )

One thing that may change this is the construction of s second pipeline, running from the South to Mombasa in Kenya. This would also feed a new refinery proposed for Lamu, which is near Mombasa. However the pipeline would be 870 miles long and have to go uphill to get into the Kenyan highlands, making it quite expensive. An extension of a railway line has been suggested as an alternative. But it now appears that the rail link will go through Uganda, rather than directly to Lamu.

Possible oil routes South from the new capital at Juba.

North Sudan is currently producing about 100 – 110,000 bd of Sudanese total production, but it hopes, by increasing production from the Balila oilfield in South Kordofan from 60 kbd to over 100 kbd, among other gains, to raise this level to 195 kbd by 2012. It has also been exploring for oil offshore in the Red Sea.

Meanwhile exploration in the South is expected to increase, and there are hopes that production might increase to 2 mbd by 2015, from their current estimated production of 450 kbd.

Conditions in the South however are not currently ideal for oil production, even for the Chinese
He said trucks bringing in fuel vital to operations were stopped at 12 illegal checkpoints on one 200km stretch of road alone, each time being charged $300. Waste oil has been set ablaze and workers kidnapped, he added.
These conditions may make China less likely to invest at the scale required for the new transport network. On the other hand China is but one of several partners in production.

For while China has a 40% interest, Malaysia has a 30% interest, and India in 3rd place with 25% in the current production company. And with the Russians expressing interest, who knows what may transpire.

Read more!

Sunday, February 6, 2011

OGPSS - Looking at the top producers

The troubles in Egypt continue to dominate the headlines, without a clear path forward at the moment. Given the threats that this may pose to other regimes in the region, I thought that this might be an appropriate moment to start providing an updated list of the current largest producers of crude oil and natural gas, and to use this set of information in later posts to discuss such things as potential future export levels. I used to do this in a post that I called “Updating my Lecture Slides”, since this was one of the opening topics when I still taught classes, and the numbers changed in an interesting way from year to year. (And as an aside it is interesting to go back 3 years and see what was then important, and also what has not.) As a point of reference, at the beginning, I am going to put up the table of leaders in oil production in 2008, from the EIA. Of these I am going to discuss the top half-dozen in this post, and then carry the discussion on to lower players on the list in future Sunday posts for a short while.

Source EIA

At the moment Russia is leading the field in crude oil production, with a reported 10.21 mbd in January 2011. This is still an increasing quantity, being up 1.6% y-o-y and President Putin has claimed that Russia has sufficient reserves that it can sustain prediction at 10 mbd for over a decade. (Note that Russia includes condensate in their total). Of the Russian total, it is reported that some 5.5 mbd was exported, which is a 2.4% decline y-o-y. And natural gas production in Russia is running at around 72.4 bcf/day, which is down 0.3% y-o-y. (There is an interesting book “Non-Gazprom Gas Producers in Russia” by James Henderson that just came out on the internal politics of Gas production in Russia that is well worth a read, and which I hope to review soon). OPEC, on the other hand see Russian exports in November 2010 running at some 6.557 mbd. Onto this it adds 2.557 mbd of refined product. Obviously I need to start getting into these numbers in more detail, to find where the real story is.

The Kingdom of Saudi Arabia (KSA) is now running relatively neck-and-neck with Russia, when one includes condensate and other NGL. The EIA estimate that in 2010 the country averaged 8.4 mbd of crude oil production and 1.8 mbd of other hydrocarbon liquids. The EIA further estimates that 5 mbd of this still comes from the Ghawar oilfield, which it notes puts that field ahead of production by every other country but Russia and the United States. Other field production is given as Safaniya at 1.5 mbd; Khurais at 1.2 mbd; Qatif at 0.5 mbd; Shaybah at 0.5 mbd; Zuluf at 0.45 mbd; and Abqaiq at 0.4 mbd. In December 2010 OPEC reported that KSA produced 8.3 mbd of crude. (The report does not break out NGL statistics within OPEC but totals the volume at 4.79 mbd in 2010). Saudi Arabia produces (and uses) around 3.2 bcf of natural gas.

Running third in the production stakes lies the United States. The latest TWIP shows a production of 5.568 mbd in the last week of January. This is an increase of 3% y-o-y, though production may have peaked in October. NGL production is now running at around 2 mbd. If one adds these together then the total for petroleum products becomes 7.27 mbd. The cold weather has had an impact on production, with Natural gas production running at around 62 Bcf , which is about 5.7% higher y-o-y. One of the questions that might need to be asked this year relates to the longer term life of the deeper wells in the Gulf, given the declining production from Thunder Horse, as well as the increasing water cut. Darwinian has noted that production was down to 0.146 mbd in November at 50% water cut .

China has overtaken Iran to become the fourth largest producer of crude. It is also becoming an increasingly greater importer of oil, and thus interest is not only in what it is producing, but the more than 50% of its need that it is now drawing from the international market. The EIA estimate that crude oil amounts to about 96% of liquid production. Pipelines from Eastern Siberia and Turkmenistan into China are drawing resources at an increasing rate and in this last year imports covered just over half of China’s oil consumption. Projections of a drop in demand or at least in the rate of growth in that demand, may be no more than wishful thinking. It appears that Chinese production reached 4 mbd of crude oil domestically, though its foreign investments yielded an additional 1.47 mbd. Over and above that were the purchases that it made. Natural gas production reached 8 bcf/day in 2009, but Chinese figures for 2010 may have fallen below this level, with the difference being made up though an increase in LNG imports. (If the amount imported from Chinese owned entities abroad are added then this equals the EIA 8 bcf/day number).

Iran is now running fifth in production, and according to OPEC it is now producing 3.681 mbd and has sensibly been able to hold average production at the same level as in 2009. (At 3.7 mbd) but even such oil optimists as Michael Lynch have doubts that it can sustain this level of production much longer. Stuart Stanniford has just had a look but saw nothing to indicate that the country isn’t producing flat out at this level. China continues to buy 0.46 mbd from Iran. India was importing about the same quantity (12% of its needs) from Iran, but has become enmeshed in a dispute that has only just been settled. The EIA are hoping that there will be a large increase in natural gas production from both Iran and Qatar in future years, largely from the South Pars field in the latter case. Current plans are for production to increase to 31 bcf/day over the next five years. Iran, because of geography, imports some natural gas from Turkmenistan, and intends the bulk of its exports to be to Europe via Turkey.

When writing these statistics, and considering future levels of production and exports, I am very conscious of the likelihood of the Export Land Model being applicable to almost all producers. However Canada the last of this top group, in the eyes of the EIA is likely to go against that trend.

EIA projection of production from Canada, in 2009.

One of the questions as to how much Canada will continue to export to the United States comes with the creation of a proposed oil pipeline from the oil sands of Athabasca down from Alberta to Texas. It is called the Keystone XL project and was a subject of discussion when President Obama met with the Canadian Prime Minister last Friday. It even finds favor with the Washington Post. It should be able to provide a flow of up to 1 mbd. In December 2010 Canada produced some 3.1 mbd of crude, which divides into 805 kbd of conventional light crude, 955 kbd of upgraded syncrude, 140 kbd of NGLs and condensate, and 1.2 mbd of heavy crude. The December figure for natural gas was 13.3 bcd/day. I will close with a map showing the projected path of the new pipeline, and take this up again next week.

Planned route for the Keystone pipeline

There is, however, one final piece of addition that one can make. If we add the volumes from the 6 top producers in 2008, then their total production was 40.583 mbd. The total for the current six top producers is 38.461 mbd. Given that some of the cuts in the KSA may have been voluntary, I believe, at this stage, that there are no great conclusions, in the short term, that we can draw from the difference. However, as I start to go through the countries and fields in more detail, that thought will be revisited.

Read more!

Saturday, February 5, 2011

South Dakota combined temperatures

South Dakota has, according to the USHCN site twenty-five stations, ranging from Aberdeen to Wood. They seem a little more evenly distributed than the set in North Dakota but not a whole lot of information from the North-west of the state.

USHCN stations in South Dakota

There are, according to Chiefio’s list, two GISS stations, at Sioux Falls and Huron. And while Huron has a full set of data:

Temperature change for Huron SD over the past 130 years (GISS )

However, when we look at Sioux Falls, GISS are back to using a station with a truncated series, in this case existing only from 1932 – sigh!

Station temperature record for Sioux Falls, SD (GISS )

Well I will first load the station temperatures into the spreadsheet, and then we’ll see what I find. The average GISS station temp is 0.39 degrees F higher than the average USHCN with homogenized data.

Difference between the USHCN and GISS average temperatures in South Dakota

Looking at the overall temperature behavior over the past 110 years, and using the TOBS, rather than homozenized data, gives:

Average raw temperature record (TOBS corrected) for South Dakota.

The difference between the 1.6 deg per century of the TOBS data, and the 1.8 degrees of the homogenized data is not shown here.

Turning to the population and geographical information for the state. Academy appears to be a state farm. Shall we say a population of 20?

Academy SD (Google Earth)

I had to use Zip Area Code to get a population for Forestburg and for Gann Valley. Oahe Dam is one of the least populated places I have looked at. But the station appears to be above the water intake for the turbines, so I am not quite sure how much influence that power generation will have on the temperature,

Location of the station at Lake Oahe Dam

It almost goes without a need to mention it that the GISS station at Sioux Falls is in the largest population of the stations recorded.

Looking at the state geography in general, the state is 380 miles long by 210 miles wide, running from sensibly 98.5 degrees W to 104 degrees W, and from 42.5 degrees N to 46 degrees N. The average elevation is 670.5 m above sea level, with the average USHCN station being at 554 m, and the average GISS station being at 416 m, so being significantly below the mean. The stations are therefore all well below the mean elevation, only 5 being above it.

So what does the temperature data look like?

South Dakota temperatures as a function of latitude

There is a stronger correlation here than with a number of other states. In regard to the longitude, again I believe that this is related to elevation change.

South Dakota temperature as a function of longitude.

However the correlation with elevation is not that high in this state, and in fact goes counter to prediction actually rising with height. However when it is considered that the two highest points are a) in Rapid City, which is one of the larger conurbations in the state and b) the other is at Hot Springs, perhaps the local geography is exerting an overall influence beyond the norm.


And for this state there is no correlation with population size, at least to an initial impression.


While we end, as usual with the difference between the raw and homogenized data for the USHCN. There does seem to be some trend to the adjustment after 1970.


Read more!

Friday, February 4, 2011

Natural gas shortages in the Southwest

The troubles with energy supply are not just confined to electric power blackouts in Texas. A shortage of natural gas in New Mexico has left 32,000 customers without a supply. Because the gas is supplied through pipelines that are kept at a fixed pressure to allow the gas to flow at sufficient volume, drops in either pressure or supplied volume will lower the amount coming out at the delivery end. This has led to a declared state of emergency with the governor urging that schools close in face of the cold and the shortage of fuel.

The problem with natural gas feeds, as opposed, for example to electricity, is that when supply is shut-off the flame that burns the gas goes out. Thus there is a safety protocol required to restore service:
The process to restore natural gas service to homes and businesses is the most time-consuming aspect of any outage. We ask for your patience as we begin and complete the restoration process over the upcoming days.

What can our customers expect? The restoration process means visiting each home and business twice. First, every meter is shut off. Then, work begins on restoring gas in the large pipelines bringing natural gas to their area and make sure the system is operating safely. Finally, our crews will go door-to-door, revisiting every home and business, to turn the meters back on, perform critical safety checks and relight gas appliances. There may be a slight smell of gas in your neighborhood while technicians purge the meters.

Who will be relighting my appliance? Qualified, trained New Mexico Gas Company service technicians from around the state will be helping to restore service to affected areas in an orderly manner.

The disruptions are not just confined to New Mexico. El Paso Natural Gas has declared “Force majeure” because of the constraints on supply. And frozen wellheads in Wyoming are reducing the flows available to customers in California. Just as with electric power, the utility answer is to shed some of the industrial load. Large industrial concerns get a lower price for their gas if they agree that it can be shut off in times where supply is no longer adequate. Such is now the case in San Diego where 88 companies have had their supplies curtailed as part of this program. Under normal circumstances the region is supplied through the Trans-western pipeline, which carries 2.4 Bcf/day.

It is reported that up to 5% of normal production has been temporarily lost both due to well head freeze-off and problems in the processing plants. And this is not all occurring in just the more northerly states.
The unexpected drop in supplies from wells freezing off forced utilities and some looking to churn a quick profit to reach for gas in storage, forcing the company to set limits on withdrawals. At least 1.5 bcfd of production is offline in the East Texas, Fort Worth and Texas Gulf Coast basins, Bentek estimates, with at least 900 mmcfd offline in the Anadarko Basin, which lays partly in Texas and Oklahoma. 'Anadarko volumes being off makes a lot of sense,' said Matt Marshall, senior energy analyst with Bentek in Evergreen, Colorado. 'It got hit hard by the weather and it's liquids rich.'

Liquids-rich gas tends to freeze faster since it has a higher dew point, Marshall said.
While supplies in storage should be more than adequate to meet demand, the problems arise in both getting this into the delivery pipelines, and then getting it to the customer. Or deciding which customer gets it. As the EIA noted in their latest (Feb 3rd) Natural Gas Weekly Update
The largest percent price increases during the week occurred in markets west of the Mississippi River, where there has been little price volatility this winter.In the Rockies and Midcontinent, where weather conditions were extreme and there were numerous reports of declines in production due to icing conditions at producing wells, price increases exceeded well over $1 per MMBtu or about 30 percent. BENTEK Energy, LLC, reported that flows on pipelines shifted significantly as higher demand in localized markets in the Rockies decreased flows on other pipelines that transport supplies out of the Rockies to the east, such as the Rockies Express Pipeline. In addition, numerous Midcontinent and Rockies area pipelines reported constraints on their systems, resulting in losses of flexibility to move gas between regions . . . . Prices in the Rockies increased at all trading locations. For example, the price for supplies on the Questar Corporation system in Utah increased $1.39 per MMBtu to $5.46, the highest price reported at this location this winter.

(As an aside it is worth noting that the EIA is predicting that there will be an additional 4 Bcf of natural gas coming onto pipelines from the Marcellus shale by this November). Overall the wellhead freeze-offs and other problems lowered national gas production, on average, to around 62 bcf/day.

Wellhead freeze-off occurs because the natural gas coming out of the well contains a varying amount of water in the mix. When temperatures get cold enough then, even though the gas comes out of the ground quite warm, this water can freeze. (A gas is considered dry in the USA when it contains less than 7 lb of water per million scf). When it does it blocks the flow channels, and the well is shut-in until it thaws. That is the simplest case, and since we know the freezing temperature of water then that should tell us when it is going to happen. Unfortunately, as some of you may remember from the Gulf oil spill incident this last summer, there are also conditions when gas hydrates can form in the infrastructure. These can form and freeze at higher temperatures. More typically, however, it is the water vapor in the line which causes a problem. David Fish gives an example of what can happen.
In a practical case you can have gas flowing in the pipeline at 60 degrees Fahrenheit and 700 psi and have no evidence of freezing. If you pass through a regulator station and cut the pressure to 225 psi, the flowing temperature at the point of regulation will drop 33 degrees Fahrenheit to approximately 27 degrees Fahrenheit. If the gas stream is saturated with water vapor and condensate, you will quickly experience the freezing concerns we are discussing.
There are several ways in which this the supply can be protected from this happening – though in parts of the country where it doesn’t normally get this cold, they might not be cost effective. The first is to remove the water, which can be done using a variety of tools typically either a solid or liquid dessicant, alternately methanol can be trickled into the line, lowering the freezing temperature of the mix, hopefully below prevailing temperatures, and thirdly the system can be kept warm enough that it doesn’t freeze. The last two of these make some assumptions on how cold it is going to get. And if the temperature falls below that point, then they may become ineffective.

Read more!

Wednesday, February 2, 2011

It appears we can still have bad winters, right Texas?

The “historic” winter storm that is now heading East and then out of the country has had some significant effects, beyond just forcing folk like us out to shovel our driveways clear. Utilities in Texas were forced to impose rolling blackouts because of the shut-down of some of its generating power. This affected as many as 1 million homes. The problem was caused, in part, by broken and frozen pipes which shut off cooling water, and thus operation, at one coal-fired and one natural gas-fired electricity generating plant in the state. (SInce it "never gets that cold" in the state, the pipes were routed outside and installed without adequate insulation for the current weather, apparently.) At the same time, however, the exceptionally cold weather was causing a reduced flow of natural gas from local sources, so that backup power could not be brought on line.
Dewhurst said he was told that water pipes at two plants, one of which is Oak Grove , forced them to cut electricity production. Natural gas power plants that should have provided back up had difficulty starting due to low pressure in the supply lines, also caused by the cold weather.
(The other plant was Sand Hill).

While the system could normally buy enough compensating power from adjacent states, the large size of the storm system means that the power from those states was already being used, and even though spot prices rocketed (from $50 to $3,000 per megawatthour it was not enough to meet demand, and thus the power companies first imposed load shedding requirements, and then started the rolling blackouts. They have, at least for now, served their purpose, and ERCOT is reported as having ended them, at least for today. There remains a “strong possibility” that they will be re-imposed on Thursday.

Oh, and a minor comment, I was complaining to the Engineer (who is in Mass) about our weather and he laughed. He lives on the main street in Somerville, and they have had so much snow already that he doesn’t know where there is room to put what fell today, and which he has to move to get to his car. So far they have had, apparently, twice the amount of snow they get in a normal winter.

Climate scientists appear to have become so fixated on the likelihood of a continuing warming trend, and all the possible disasters that this might bring, that they leave Governments unprepared for any possible alternatives. Thus grit supplies were not increased this winter in either the UK or USA, dam levels were kept full in Australia, so that when a flood came there was nowhere to put the water, except down river – thus negating one of the very reasons the dams were put there in the first place. If it is not now apparent that colder weather can be at least as damaging as warmer, if not worse, then observational science, which used to have a considerable worth, has now yielded place to science by computer model, where the old GIGO rubric has been forgotten.

And if this post seems more like a rant, perhaps it is to do with the 3 hours it took to dig out my drive today, and the aches and pains that this has left in the aging corpus.

Read more!