Showing posts with label Iran. Show all posts

Monday, October 13, 2014

Tech Talk - Pessimistic Talk in a time of surplus

The oil markets are concerned that there is too much oil currently available on the market, and that, as a consequence, oil prices may continue to tumble. Saudi Arabia is reportedly telling Reuters that it is happy with prices that may fall as low as $80 a barrel. As I mentioned the other day, some of this has to do with market share, and the KSA increasing production, and thereby seeking to weaken the likelihood of investment in other places, in turn ensuring their share holds up, not just now, but also down the road. The effect on gas prices has been rapid, with prices in parts of Missouri down to $2.65 a gallon – about a dollar less than I was paying only a week ago.

The effect will also have the benefit of a boost to the economy, which of course can’t hurt in the run-up to an election. But in the longer term it is hard to see how this boost can be sustained for more than a year. In the last post on this I mentioned that, outside of the US, Russia and KSA global oil production had dropped around 3 mbd over the past couple of years. Yet increased production (KSA raised production by 100 kbd in September as part of a total 400 kbd increase from OPEC overall) has, for now, been able to match and surpass this in order to meet the global demand. OPEC continues to expect that demand will increase by a million barrels a day this year and 1.19 mbd next. They further expect that the increased production to meet this will be met from outside the cartel, with the gain declining from 1.68 mbd this year, to 1.24 mbd next year, holding OPEC production to a decline of 300 kbd from the current 29.5 mbd. Simplistically the gains are maximized in increased production from the United States (880 kbd); Canada (250 kbd) and Brazil (190 kbd). They are anticipating a slight drop in Russian production, as part of an overall decline of 80 kbd for the FSU countries.

Part of the problem in projecting the balance revolves around estimating the production from Libya, Iraq and Iran (LII). Libya has reported raising production back to around 800 kbd, but some of that comes from the Shahara field, which was still involved in factional fighting, even as it came back on line at some 20% of normal. The three countries produce around 7 mbd (Iran 3 mbd, Iraq 3.2 mbd; Libya .8 mbd) so that the fluctuations in their production and sales can have a very significant impact on the global oil market, and the prices that are paid – but they function within OPEC, and it may be that the current drops in price are reminder that the big dog in that trailer is KSA, currently running at around 9.7 mbd.

It is foolish to try and predict, over the immediate short-term, how the fighting in Libya and Iraq will progress. Similarly it is hard to see how relations with Iran will change, potentially easing sanctions and allowing them to sell more product into the global market would upset the current balance in trade, and could, in the short-term, increase the glut and lower prices.

But supplies from those outside the cartel and the Americas are continuing to decline. That is not going to change. The rates may fluctuate a little (though the current drop in prices is not going to encourage large scale investment in declining fields) but the overall trend is steadily downward. And it is within that picture that potential changes in the production from the three LII countries have to be placed.


Figure 1. Libyan oil production through September 2013. (EIA)

Yet, as the fields have brought oil back to the market, there is a concurrent fall in global prices, as the EIA note.


Figure 2. Recent oil production from Libya and the price of Brent Crude (EIA)

Pre-conflict Libya was producing over 1.6 mbd, it recovered to 1.4 and is now struggling at around 0.8 mbd. But the prospects for the levels of peace required to sustain even that level do not seem promising. The conflict is worsening and seen as spiraling out of control.

Moving East to Iraq, despite the use of air power, the situation in the North is not improving, although the Kurds have now a pipeline to carry oil up into Turkey that is not controlled by the Islamic State. While it is still a matter of debate how much oil they will be able to sell, they hope that, by the end of next year they may be able to pump as much as 1 mbd, up from the initial 0.1 mbd when the pipeline went on line. At the same time, in the South, the oil fields lie some distance from the conflict, and there seems little threat, at the moment, to the plans to increase production, and move the majority of the oil to the coast for export. It is, therefore possible to foresee an increase in Iraqi production of perhaps a million barrels a day in the next couple of years. Is it likely? It is hard to say. Factional fighting is always hard to predict, and the willingness of those involved to use explosives makes it even more of a problem to predict what will occur, given the vulnerability of pipelines to attack.

Predicting how Iran will change is similarly conflicted, in that it is hard to predict the behavior of those who control the country, and in turn impact oil exports.

But putting this within the context of OPEC, I suspect that overall production will not fall much outside of the current volumes that the MOMR are predicting – which is sensibly overall stable output over the next year or so. And if that is the case, then I would, as mentioned last time, expect to see that the global surplus of oil supply over demand will gradually disappear over the next year, with the impact becoming evident once we reach the summer of 2016. It would be nice to be wrong, but I think it unlikely.

Read more!

Monday, October 7, 2013

Tech Talk - complacency does not see the slow erosion of supply

There has been some talk this week over the volumes of oil and natural gas that is being produced in America, with the WSJ, for example, noting that the US is on track to surpass the volumes produced by Russia. Given that Russia is the leading producer of crude oil at the moment, in August OPEC noted that their production was running at 10.51 mbd, in which month they noted that Saudi Arabia was producing 9.96 mbd. OPEC carefully give two numbers for US oil production, total production is given, for August, as 10.88 mbd, but of this only around 7.2 mbd is crude oil. (While the 9.96 mbd of Saudi production is their crude output, and they also produce some NGL’s from their gas production, as well as seeing some refineries gains as their processing capacity increases). However the WSJ notes that the grand total for the US also contains oil, natural gas and other related fuels to reach the 22 mbdoe, relative to the 21.8 mbdoe that Russia is estimated to be producing.

While the overall impression that is being bandied about, that the US will become energy independent, has been shot down more than enough times (see for example Chris Nelder, last year) there remains, however, a broad complacency that, with increasing production from tight rock, in both oil and natural gas, there is no reason to have concern over future supplies.

If one looks at the make-up of the US supply of energy, natural gas has been steadily increasing its share, as has crude oil, to the cost of the coal market.


Composition of the US energy supply sources, supply shown in quadrillion Btu’s (EIA )

The break-out for June gives more explicit figures:


Figure 2. US Energy supply by Source for June, 2013.

The gap between supply and demand for petroleum products (particularly for transportation) can then be assessed by looking at the consumption side of the equation.

Figure 3. US energy consumption by sector (in quads, EIA )

The bull stirring in our China shop (pottery variety) continues to be the levels of petroleum that we need, and that is unlikely to decline all that much in the intermediate term.

The problem that the world faces is that the balance between available supply of crude oil and the demands for it now lie within very narrow range of production. It is still not that much more of a concern that additional oil this month comes from the US, rather than the Kingdom of Saudi Arabia (KSA) since, give or take a few weeks, supplies can still be purchased from different sources and rapidly shipped by tanker to where it is needed. But if the US were to be asked to meet an additional production need of 1 mbd over existing supply, because of even a short-term failure of supply from another country, it would not be able to meet that demand. (Short, that is, of draining the strategic supply).

Most of the other countries in the world are in a similar predicament. And that includes Russia. Russia gets more than half of its budget from oil and gas revenues, and with their economy flattening out it needs more revenue. It would help considerably if that help came in increasing volumes of oil and gas for export. But the remaining oil and gas deposits are being found in more remote parts of the country, where the expense of not only drilling the wells, but also of getting the product to market, requires a very large capital and time investment. Thus, while it would be nice if they could, they can’t be expected to meet an upsurge in external demand by turning the odd tap on an oilfield to produce additional supply.

And if one goes around the world, as I have been noting recently, outside of the KSA, there is virtually no-one else who can relatively rapidly respond to bring the global market into balance. But even the KSA capabilities to meet that demand are limited. I would suspect that they would get uncomfortable if they had to produce over 10 mbd for any length of time.

And this is where the kicker in the story lies, because, if that is the case, and conflicts around the globe continue to nibble away at the production capabilities in places such as Sudan, Iraq, Libya and their neighbors, then the additional global reserve between available supply and demand is going to increasingly tighten. It is a relatively imperceptible change every month. A little less oil flows down the Alaskan pipeline (439,686 bd in August against the average ytd of 528,572 bd); South Sudan is running about 100 kbd behind the figures for January 2012; Libya continues to suffer from the actions of the militia that control two of their oilfields to the point that production is now around 1 mbd below normal production for the country. There are some indications that the situation is now improving, with flows returning to around 700 kbd but this is still only half of the original volumes. And while the problem is political, rather than technical, the optimism of the Libyan oil minister who projects a return to production levels of 1.6 mbd is perhaps difficult to justify realistically.


Figure 4. Recent changes in Libyan oil production (WSJ )

Libya is, perhaps, with Iran, an exemplar of the nations with the potential to produce more, but who are constrained by immediate political problems. Iraq, who might otherwise also be in the group, is challenged also to develop the fields that are required for it to bring in the additional volumes of oil to the world market.

If these countries remain at their current levels of production, and there is little to indicate any positive change in the near term, then the narrow band over which KSA production fluctuates to keep the balance may not be enough for much longer.

Complacency that there is currently enough oil and natural gas to go around, at current levels of price, lets the market focus on other, more immediately pressing issues. But the slow erosion of the remaining global production surplus continues, and accumulates, and the time when this becomes evident may only be when that reserve no longer exists. And that may not be nearly as far into the future as most seem to expect.

Read more!

Sunday, September 29, 2013

Tech Talk - Iran and a slight cough toward CNN

There has been considerable comment this week over the telephone call between President Obama and the President Rouhani of Iran. Certainly the election of a new President in Iran gives the opportunity for a fresh start, particularly given the belligerent attitudes of his predecessor. However the cynical side of me does wonder if there is more driving this than simply the change of personalities.

There are two points that need to be considered, as a possible new relationship between the two countries might slowly coalesce out of the mists of diplomatic effort. Firstly the major driver seen in moving Iran toward a more positive position is said to be the increasing bite that sanctions, and particularly oil sanctions, are having on their economy. As sanctions have tightened, so Iranian oil production has fallen, with reports suggesting that oil exports have fallen from 2.2 mbd to May’s value of 0.7 mbd. The reduction in income that this has had on the Iranian economy is significant, with the currency officially devalued to half, though the effect has been more of an 80% fall from peak, as inflation has reached 42%.

Easing sanctions to allow more oil flow would significantly improve the situation, although there is concern, expressed for example at CNN, that the increase in oil flow would weaken the positions of the Kingdom of Saudi Arabia and Iraq. They suggest that the advent of Iranian oil (presuming that they can bring 1.5 mbd to the market relatively quickly) is foreseen as having a potential impact on the United States in that it may, at least transiently, produce a glut in the market. That would drive down prices, until such time as KSA could drop production and bring the supply and demand back into balance, raising prices back to around $100.

In a peaceful world such a scenario might have some viability, but consider what is really happening in the world of global supply. Instead of the KSA moving toward a supply of 12.5 mbd (which was only a capacity number in the first place) they have backed this down to 12 mbd and have talked recently as lowering that number further as they hire more and more rigs to help sustain existing production at just under 10 mbd. Iraq, which was promising to rapidly increase production toward a target of 11 mbd, is instead considered by the IEA likely to reach no more than 6 mbd by 2020. Further with the ongoing increase in violence in the country being able to sustain current production at around 3 mbd and increase it beyond 3.5 mbd as the Majnoon field comes on line. However Shell’s target for the field is already below initial estimates for this year, and it is discussing lowering the 2017 target from 1.8 mbd to 1.0 mbd. There has recently been an outbreak of violence in Kurdistan, which might portend that even in this relatively stable part of the country oil production and security is becoming a greater target.

These events suggest that future increases in production from around the region are not as assured as one might hope. At the same time, while there are those who continue to expect the United States to become oil-independent in the next few years, the reality is somewhat different, and further increases in production much above current figures become more difficult to justify. If Russia, similarly, is unlikely to increase production – which it is not – then the questions that should be asked are rather where is the world going to get the additional 1 mbd that it requires every year to balance increasing demand against supply.

Over the course of this year Saudi Arabia has had to increase production from 9.1 to 9.96 mbd to keep supply in balance, and prices stable. At the same time production from Libya, which has run at around 1.6 mbd had fallen to 150 kbd at the beginning of this month. Hopes that this could be increased back up to 700 kbd rely on tribal militias that control strategic parts of the country, and their long term co-operation is dubious, while the fields and pipelines in the east remain shut down. It seems reasonable to anticipate that there will be at least a million barrels a day of Libyan production held off the market for some time.

If one goes around the world one sees that Brazilian promises of production increase are behind schedule, as are promises of production increases from countries such as Veneuela. And suddenly one is left with not much in the way of places left to balance off the current declines in supply and increases in demand.

At this point that 1.5 mbd of potential supply from Iran starts to look a little more promising as an answer. It might allow KSA to ease back on production levels that might be starting to impose a little strain on their infrastructure. It would help to provide balance if production increases around the world fail to show on time. One should recognize that negotiations to bring Iran back into the fold are going to take at least a year or two before it is realistic to anticipate full return to supply, but even the easing of sanctions a little might cause the flow to China, India and Asia to increase to meet the burgeoning demands that they have, and oil is still to some degree fungible.

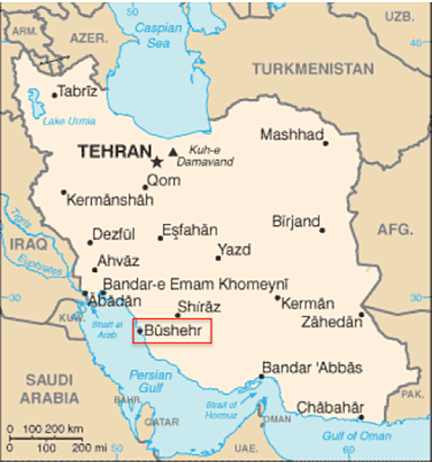
But in that regard, Iran has also just recently reached 100% output from the first of the nuclear power stations at Bushehr and is about to start construction of the second unit. Nuclear fuel will be provided by Russia, and spent fuel returned to Russia. It is a 1,000-megawatt unit, and since the unit was built under supervision by the International Atomic Energy Agency it is not subject to sanctions.


Figure 1. Bushehr Nuclear Plant

If the protocols that worked to make this happen can be expanded, then it is possible that, though negotiation, the tension in the region can be eased. This could well have benefits all around, most particularly for ensuring that, for at least a sadly few more years, there will be enough oil on the market to meet demand at a reasonable price.


Figure 2. Location of the Bushehr Plant

Read more!

Thursday, June 20, 2013

OGPSS - Insecurity in the Middle East

The continuing conflict in Syria, and the slow spread of violence in the region around it, continue to make it difficult to make accurate predictions about the future of oil exports from the region. Within Syria itself production had fallen into decline about ten years ago, before the current struggle began. The precipitate drop over the last two years has, however, been much more dramatic. As Energy Export Databrowser noted from the BP statistic review, production fell by 49% last year.


Figure 1. Syrian oil production showing the recent fall in volume. (Energy Export Databrowser ).

As with most oil-producing nations oil consumption had, on the other hand, been steadily rising with net exports (some is exported as crude and re-imported as refined product) falling to around 100 kbd. The conflict has, however, also reduced internal consumption at similar rates earlier in the conflict.


Figure 2. Syrian production and consumption until 2011. (EIA )

At the same time that Syrian exports have sensibly disappeared, the exports from Iran have continued to fall. Data through the end of last year shows that sanctions continued to bite, with exports falling 31% last year.


Figure 3. Oil production, consumption and exports for Iran (Energy Export Databrowser)

Much of the oil from Iran goes to China, India and Turkey. In May 2013 the total exports are reported to have fallen to 700 kbd although individual monthly numbers fluctuate given the complexity of now getting oil into the hands of customers. (H/t Gail - that report may only cover Chinese imports, since Bloomberg reports a different set of numbers, and an IEA estimate that Iran is averaging 1 mbd of exports this year.) India is hoping that the change in the Iranian Presidency will lead to an easing of sanctions. In the interim, the exemptions that China, India and Turkey are receiving to some of the sanctions have just been extended another six months. Part of this comes from the cuts those countries have already made. India, for example is now down to around 117 kbd around half that of a year ago.

Oil imports into China are reported to have increased, perhaps because the Chinese have just agreed to buy a number of Chinese drilling rigs. Total exports are projected to fall to 1.3 mbd over the current Iranian fiscal year (which started in March). If Iran is having to store more of its oil in off-shore tankers, this may explain the fall in regional tanker availability over the past month.

In a recent post I discussed my concern over the likelihood of Iraq being able to achieve the increased volumes of production within the time frame that their Central Government has suggested. However, as Leanan caught recently, Kurdish Iraq is moving more and more toward independent action in regards to their oil. From the Turkish side a pipeline will be allowed, that can go to the border, but not cross it. Mysteriously it will likely then fill, over time, with a flow of 1 mbd. Turkey is working with BP to develop the resources of Kurdish Iraq. In the interim Turkish demand has stabilized to a greater degree than it has in its southern neighbors.


Figure 4. Oil imports and consumption in Turkey (Energy Export Databrowser)

To a degree the instability is feeding off itself. Egypt continues to have problems in ensuring an adequate supply of fuel, and while Iraq and Libya have agreed to help, they prefer cash up front for the delivery, and that is proving to be a bone of contention. The country has reached the point where domestic production can no longer keep up with consumer demand, and these imports are going to become more critical to the budget, and, as a follow-on, national stability.


Figure 5. Change in oil consumption and the need for more imports for Egypt (Energy Export Databrowser)

The hope is that a pipeline can be built from Iraq, through Jordan, but that requires that a mutually acceptable line of credit be established, and that appears to be a problem. Egypt has the same soft-credit deal with Libya for a supply of a million barrels a month. The price, however, will be at that of the world market.

Unfortunately as the level of violence continues to grow one starts to get into an almost inevitable snowball effect, and there is a consequent negative impact on much industry, likely including that of oil production. The most likely consequence will be a further fall in the regional export of oil, which has a follow-on consequence in that the customers who have lost this supply (Japan has given up all Iranian oil for example) must then go onto the world market to find an alternate source of supply.

As those sources become even scarcer than they are already, marginal amounts of oil become more critical to maintaining a global balance. But such supplies don’t become available at the drop of a hat.

It seems to be a drum that I beat perhaps a bit often, but it is a message that bears repeating. Without significant and ongoing investment in the more difficult regions of the world, funds to identify the necessary availability of resource, and then to drill, in a timely manner, to prove the resource and start the process of turning it into a reserve, the oil balance cannot be sustained at a viable and acceptable price. It does not matter how glowing a set of reports are put out about how we can all relax because the world has plenty of oil in shale.

The largest of those resource sites is in Russia, where there may be as much as 75 billion barrels. But two things should be remembered. The first is that peak oil is reached, not when we run out of oil, but when we start producing less each year than in the previous. And the second is that getting much of the oil in the shale into the proven reserve category is going to take a fair amount of time, after which production rates, going from the results seen, for example, in the Bakken will decline at such a rate that a continued and expansive program of expensive drilling will be required to sustain production. And all this time the flow of oil from existing reservoirs will continue to fall.


Figure 6. A pretty wall hanging . (EIA)

Editorial Note: Because of one of those delightful family events that occur from time to time, this series will be on hiatus for a couple of weeks, since we will be traveling, when I would otherwise be writing.

Read more!

Thursday, May 16, 2013

OGPSS - The weather, corn, ethanol and oil production

News of the future was, in my youth, something that one found by crossing the palm of a lady in a dark tent with a piece or two of silver (or the modern equivalent) at one of the fairs that came to town. Such opportunities still exist, with all the caveats that existed back then likely still being in force. However projecting the future, whether of the weather, the likely corn crop this year in the United States, or the production of crude oil by the nations of the world has become a much bigger business with copious tables, graphs and theories replacing the rather worn pack of cards or crystal ball of my youthful experience.

Our part of the world underwent a drought last year severe enough to kill several trees in our yard, for example, as well as hurting the corn crop. This year, corn plantings have been severely impacted by the heavy rains and cold weather, so that decisions on crop plantings have become more complicated and delayed, with follow-on impacts on the ultimate yield in a number of Mid-Western states. Corn yield apparently falls at an average rate of 2.3 bushels per acre per day of delay in Northern Wisconsin. These changing conditions make it difficult to assess how much ethanol, for example, will be available to meet demand, although the latest EIA TWIP holds out some optimism for this year.

The impact of the drought on corn prices, and the consequent fall in ethanol production, as production costs rose, are directly visible from their plot of the two over the last year.


Figure 1. A comparison of corn prices and ethanol production in the USA (EIA TWIP )

However, with the weather impacts still being assessed it is already being concluded that the US corn crop is unlikely to reach the record level of close to 14.6 billion bushels that were earlier projected. It still, however, has the potential to reach around 12.3 billion bushels, which would satisfy the just under 5 billion bushel need for ethanol, as well as other demands of the market. By May 12th only 28% of this year's expected crop had been planted, in contrast with a normal year where 65% would be in the ground. Thus even the relatively short-term projections of the EIA could yet be in trouble for this year.

Moving to the slightly longer-term the nations that form OPEC must try and estimate global demand for their products, and the amount that other non-OPEC nations will produce, so that they can balance supply and demand at such a level that will sustain prices at a level they are comfortable with. Their estimates come out as Monthly Oil Market Reports and in the latest (May) version they continue to expect global demand to increase by 0.8 mbd over 2013, but are beginning to hedge that bet, as the global economy continues to appear anemic, with Russian and Asian economies slowing. Yet by the fourth quarter of the year they anticipate that global demand will reach 90.9 mbd.


Figure 2. Global oil demand by region (OPEC MOMR)

OPEC anticipates that, with the major increase coming from the Americas, that non-OPEC oil production will increase by just under 1 mbd to reach an a level of 54.41 mbd in the fourth quarter of the year. The majority of that growth (some 0.59 mbd) will come from the United States, with the Permian, Bakken and Eagle Ford being cited as the anticipated source of these gains. OPEC, having looked at current rig counts, project that these numbers may be revised upwards over the course of the year. And yet it is worth noting this:
On a quarterly basis, US oil supply is seen to average 10.62 mb/d, 10.67 mb/d, 10.62 mb/d and 10.61 mb/d respectively.
The sustained gain in North American production comes about because:
On a quarterly basis, Canada’s production is anticipated to average 4.02mb/d, 3.97 mb/d, 4.02 mb/d and 4.12 mb/d respectively.
Russia is expected to continue to lead in oil production over the course of the year, although it is not longer expected to increase production above current levels.
On a quarterly basis, Russian oil supply is seen to average 10.45 mb/d, 10.43 mb/d, 10.43 mb/d and 10.43 mb/d respectively.
And this brings us back around to OPEC as they try and balance their production against the gap between global demand and non-OPEC supply. As has been the case for a while, OPEC produced two separate tables showing production, as reported by secondary sources, as well as those directly reported by the countries themselves.


Figure 3. OPEC member production as reported by secondary sources (OPEC MOMR)


Figure 4. OPEC member production as reported directly (OPEC MOMR)

It would appear, with Manifa coming on line, that Saudi Arabia is increasing production again, while Venezuela and Iran would have you believe they are producing more than they are, and Iraq, which is now producing above 3 mbd, is directly reporting less (though that could be because some of that production is coming from the north, and there are some communication problems between there and Baghdad).

As long as OPEC has available reserves it can continue this balance to keep enough oil available at an acceptable price to allow the world economy to continue at its present pace. And with that ongoing adjustment available, their projections for this year of a relatively stable price would seem fairly founded, absent some major change in one of the larger producing states.

Iraq overtook Iran as the second largest producer in OPEC last year (according to secondary sources) and expects that with production from Majnoon, it will increase production capability by upwards of 200 kbd by the end of the year. Ultimately the goal is to achieve a target production of 1.8 mbd. However, as overall production levels increase, Iraq may join with the Kingdom in controlling production to maintain price.

Yet even with those abilities OPEC is becoming cautious over predicting that their estimate of the demand:supply balance numbers for this year will be accurate over that time interval.

With these uncertainties in even short-term projections of future production whether it be corn, ethanol or crude it is perhaps wise to continue a somewhat cynical view of projections over a longer time period. Although the bounding bar of a decline in existing field production continues to exist and will continue to require an offset in increased production from new wells to offset. Perhaps that lady in the tent of my youth may prove as prescient as some of the more optimistic forecasts that we continue to see.

Read more!

Thursday, January 17, 2013

OGPSS - Miles travelled, gas used and OPEC

Leanan has noted the API report of the continuing drop in US oil demand. It would be wrong, I believe, to explain this purely by reference to the increased efficiency of vehicles now on the road, nor would it be realistic to expect that these changing conditions will result in a lowering of gas prices.

To explain the rationale behind these thoughts requires reference to two sets of data. The most potent is the behavior of the Kingdom of Saudi Arabia (KSA), but before discussing their actions the story begins with the changes in the miles travelled reports that are issued by the Federal Highway Administration each month. Driven by a comment on recent versions of that plot, it is worth revisiting the summary of the rolling total of miles travelled in the United States, with the October 2012 plot being the last available.


Figure 1. 12 month rolling total of miles driven on all roads in the United States (FHWA)

It should be noted that this is not the amount of fuel used, but rather the distance travelled, and thus in itself this does not reflect any changes in vehicle performance because of the increased efficiency of their engines.

And while there does not appear to be any great difference between the numbers for 2011 and 2012 when broken down by month, for rural and urban travel, they both lie below the values for 2010.


Figure 2. Travel on US Urban Highways by Month (FHWA)


Figure 3. Travel on US Rural Highways by month (FHWA)

This shows that folk are actually driving less than they have previously, which may be reflective of the current economic condition, when combined with the high price for gasoline in relative historic terms. One can compare these curves with the demand for gasoline from This Week in Petroleum., though this has data through the end of the year and has a slightly different lower scale range.


Figure 4, Demand for gasoline in the United States (EIA TWIP)

Demand for gasoline, as with miles travelled, seems relatively equivalent for data for 2011 and 2012. The demand for ethanol, on the other hand, seems to be significantly less, assuming production matches that demand.


Figure 5. Production of fuel ethanol in the United States (EIA TWIP)

OPEC take a keen interest in those activities in the United States that impact the demand for oil, and in their latest Monthly Oil Market Report (MOMR) have plotted the variation in oil price with miles driven:

Figure 6. US mileage plotted against the retail price of gasoline (OPEC January MOMR)

Driven by increased demands for vehicular fuel OPEC anticipates continued growth in domestic demand for oil, both in the Middle East, and in Latin America.


Figure 7. Increase in domestic oil demand in the Middle East over 2012 and 2013. (OPEC January MOMR)


Figure 8. Anticipated growth in domestic demand in Latin America (OPEC MOMR)

Both of these tables feed into and support the position that Westexas has discussed in regard to the drop in available exports of oil in the coming years.

OPEC is not expecting to increase production in the coming year, but rather expecting that increase in demand will be met by production growth from the non-OPEC nations with numbers similar to those discussed earlier. And, as noted, most of that production growth is expected to come from America. The report confirms that OPEC, and particularly Saudi Arabia is willing to cut production, when demand falls, so that price levels are sustained. As in previous months the numbers showing production differ when the reports come from the countries themselves in contrast with reports from secondary sources.

Figure 9. OPEC crude production as reported directly. (OPEC MOMR )

There are significant drops in production reported for Iraq, Libya, Nigeria and Saudi Arabia so that the reported drop in production comes close to 1 mbd. There is not quite the same amount of sacrifice evident in the numbers from secondary sources.


Figure 10. OPEC crude production as reported from secondary sources (OPEC MOMR )

Overall production is down only around 500 kbd, with almost all of that being a reduction from Saudi Arabia. The difference between the production numbers from Nigeria (they report cutting production 120 kbd while others report they have increased production 136 kbd) are perhaps indicative of some of the problems that exist within the OPEC organization when they try and balance the supply:demand equation.

However, given that KSA is willing to do the heavy lifting it seems likely that prices will continue at their current levels, despite any changes in American production levels.

Read more!

Tuesday, December 11, 2012

OGPSS - Iran and the new EIA and OPEC Reports

With the possibility that demand for Iranian oil may fall below 1 million barrels a day (mbd) as sanctions continue to bite, Iran has announced that it wants OPEC to cut back production to the agreed quotas, rather than the overall additional 1 mbd that is actually being produced, and sold. Such a move would, of course, ,make it more difficult for those customers who have found a way of replacing Iranian oil, and perhaps incline them more towards disregarding the embargo.

OPEC has just released their December Monthly Oil Market Report (MOMR) in which they anticipate that earlier projections for 2013 oil demand growth will still be valid, at 0.8 mbd. (Though they note that December 2012 growth y-o-y was at 1.0 mbd as the US economy continued to improve). They expect that all of this increase will be met by non-OPEC increases in supply, and that demand for OPEC oil may even drop 0.4 mbd. Part of that projection continues to rely on increased US crude production, and the EIA TWIP of December 5th had the latest chart showing that projected growth, based on the newly released Annual Energy Outlook 2013.


Figure 1. Projections of future growth in US crude oil production. (EIA TWIP) from Annual Energy Outlook 2013)

As a footnote to that graph the Alyeska pipeline pumped an average of 582,755 bd in November, which brings the annual average up to 544, 625 bd. It is clear from looking at that plot that the gains in production are all assumed to come from increased production from the "tight" oil deposits that have produced the overall gains achieved to date. The optimism of this projection goes a little beyond the levels that I anticipate being achieved.

Coming back to the MOMR their projections do not include the recent news that Venezuelan President Chavez has had to have a fourth operation for cancer, and has named a successor, although the operation was apparently successful. This may complicate the decisions on how much to allocate among the OPEC partners, especially since all continue to need higher priced oil.

OPEC also give the price of various commodities in their report, and before going on to discuss country production, those prices are informative. (And can be read more easily by clicking on the table to get a better image). At present, with the decline in overall global demand, metal prices in particular seem to be continuing to slide.

Figure 2. OPEC report of commodity prices for November (OPEC December MOMR)

Equally informative is the demand that OPEC anticipates from the various regions of the world for oil in 2013.


Figure 3. OPEC estimates for regional oil demand in 2013. (OPEC December MOMR)

In total OPEC anticipates that global demand will reach 90.83 mbd by the fourth quarter of 2013, with the greatest growth continuing to be from China and the other Asian nations.

Looking at where this oil might come from, the main increase is still anticipated to come from North America.

Figure 4. Non-OPEC supply projections for 2013 (OPEC December MOMR)

The conflict in Syria is now reported to have led government forces to withdraw from the Omar and Al-Ward fields in the Deir Ezzor region, where much of Syria’s exports were produced. However the rebels do not, as yet control any of the refineries or export terminals and the result is that oil production is estimated to have fallen from 380 kbd to 160 kbd over the past few months. The regime is making up the shortfall in its needs by importing from Iraq.

Which brings us back to OPEC production levels. (Note that this is for crude oil and does not include the roughly 6 mbd in NGL that are currently being produced).

Firstly, this is what the various governments are reporting that they are producing:


Figure 5. OPEC production from official sources (OPEC December MOMR)

The total shows, among other things, how Libyan has recovered from their “Arab Spring.” In contrast with the official figures OPEC also posts the values from “secondary sources”.


Figure 6. OPEC production from secondary sources. (OPEC December MOMR)

The difference between the two figures for Iran is at around 1 mbd. Overall OPEC production is declining with the increase in non-OPEC production, so perhaps Iran won’t have quite as difficult a time persuading their colleagues to drop production a little more, to help them out. That won’t be at the latest meeting of the OPEC Ministers, which was held in Vienna on December 12th, where it was decided to maintain the current ceiling of 30 mbd.

The meeting was largely distracted by debate over who should be the new Secretary General, with this being “kicked down the road” for a decision at the end of May.

On the other hand, while Malaysia had promised to halt imports of oil from Iran last March, the IEA is reporting that they increased crude purchases from Iran in November. Whether this is oil ultimately destined for that country, or whether this a convenient transshipment point from Iranian tankers bringing in crude, which is then transferred to other carriers and a second purchaser is not clear, although a Chinese oil trader appears to be involved.

A move to make US natural gas available to NATO allies has begun in the Senate, with the intent that perhaps this could wean countries like Turkey from their use of Iranian and Russian natural gas. Whether this will ever amount to much is not clear, since Senator Lugar, the initial author, was defeated in the primary to the last election and thus leaves the Senate at the end of the term.

Read more!

Thursday, October 25, 2012

OGPSS - Global crude oil and Iran

There has been a little stir in the news on Energy lately, as folks have begun to extrapolate the growth in American oil and gas production to the point that they predict that the United States may out-produce Saudi Arabia, in terms of the totality of hydrocarbon production. Of course, in some cases, it has been North American oil independence that is featured, rather then that of the USA. And the reason for the generalization is that by broadening the geography so that the region also includes Canadian and Mexican production then the US imports from those countries magically disappear (which does not mean that they don’t have to be paid for. The US imported around 2.5 mbd from Canada and 1 mbd from Mexico in July). The stories also don’t dwell on the comparison of apples and apples. Consider the following quote from NPR. It is that easily missed sentence at the end of the first paragraph that is critical.
In 2011 the U.S. produced 5.66 million barrels of crude oil a day, according to the Department of Energy's Energy Information Administration. By next year the agency projects that will increase 21 percent to 6.85 million barrels a day. Add in things like natural gas liquids, biofuels and processing gains at refineries and that number increases.

"By 2013, we'll probably be a little over 11 million barrels a day," says EIA administrator Adam Sieminski. "That puts you pretty close to Saudi Arabia's" production of more than 11 million barrels a day, he says.
In which regard it might be pertinent to note that some of the crude produced in the Kingdom of Saudi Arabia (KSA) will be refined in the US, providing refinery gains here, and further distorting the comparison. Ah, well!

The current production gain in the US has resumed, after a short plateau, although the gains following the shut-ins for Hurricane Isaac seem to be leveling off.


U.S. Crude Production through mid-October 2012 (EIA TWIP)

The information in the October Monthly Oil Market Report from OPEC, show that crude oil production from KSA is running at 9.85 mbd, as reported by other sources.


Figure 2. Reported production from the OPEC nations through September 2012, as reported by others (OPEC MOMR)

When one looks at the production that KSA itself is reporting the numbers are slightly reduced.


Figure 3. Reported production from the OPEC nations through September 2012, as they reported to OPEC (OPEC MOMR)

While the comparison of the two levels of crude suggest that the US has a long way to go in matching KSA crude production, the two sets of figures also point to the answer to another question.

Looking at the figures for Iran, it is clear that the sanctions which have been imposed on that country by the West are having a serious impact. Not only is this seen in the fall in oil production, likely around 1 mbd, but in the more consequential cut to exports this fall is reflected in a $7 billion reduction in income. Iran has just started to admit that this bite in their export market is hurting production. And it is only now that they recognize that this will further fall, though they are now also threatening to carry this drop to its ultimate conclusion, and to stop exports entirely. An immediate impact to this would fall on Turkey, which has cut oil imports from Iran by about 20%, but which has a six month exemption from the full impact of the sanctions. It is currently importing around 200 kbd of crude. Some of the value of that oil is apparently returning to Iran as gold bullion, which can be easier to spend.

However the primary question might well be, if world oil markets are so tight, how come taking a million barrels out of production hasn’t had a more significant impact? And the answer to this comes in part because of the increase in production from KSA (Note that a year ago the country was producing around 500 kbd less than it currently is), and also from the gains in production from the United States. (As shown in Figure 1).

Further, given that the global economy, though regenerating from the depths of recession, is still not operating at levels sufficient to bring unemployment to more normal levels, overall demand also remains below what it might be.

Since we live in a global economy the problems of Europe and America are reflected in a reduced demand for goods from China and other Asian countries, which impacts the energy demand from factories. China has been taking some 40% of the Iranian export. OPEC has noted that Chinese demand has declined, and that part of this decline has been through an 18% reduction in imports from Iran. Interestingly this was partially made up through an increase in imports from Iraq.


Figure 4. Change in Chinese petroleum imports over the past year (OPEC MOMR )

One of the threats that Iran has made it that it will shut down its exports completely. The country was initially exporting some 2.3 mbd before sanctions occurred, and sanctions have dropped this already to around 860 kbd. Of this 200 kbd are going to Turkey, but this is a country with pipeline connections that give it options. There is a pipeline running from Iraq, the Kirkuk- Ceyhan connection which carries 300 kbd, and was briefly damaged by fire in August; and, more famously, there is the Baku-Tiblisi-Ceyhan pipeline from the Caspian. This can carry 1 mbd of crude, and having run 190 mb through September this year, it is running not quite full.


Figure 5. Oil and Natural gas pipelines through Turkey (Journal of Energy Security )

In short, as with the suggestions mentioned the other week, that Iran might seek to challenge Qatar in going into the natural gas LNG market, the threat this week that it might shut off exports of crude seems to be likely only geared for domestic consumption.

The global demand at present is not such that the Iranian supply is critical to ensuring a balance at an acceptable price between supply and demand. It would seem that the global economy would need to regenerate further, and for North American and KSA to reach some form of current peak in production against that potential of rising demand before this balance is threatened. But, in consolation to Iran, resting oilfields can sometimes help in terms of their longer-term production (as KSA have practiced for years).

Read more!

Wednesday, October 10, 2012

OGPSS - Iran and the possibility of natural gas exports

There has been much talk in the current Presidential debates about possible changes in US Energy Policy, with Governor Romney suggesting that more Federal land be opened for prospecting for oil. Historically one of the regions included in such lists has been up in the National Petroleum Reserve in Alaska. And, perhaps anticipating the debate, the current Administration has already and recently moved toward opening those territories up for development.** However those fields have now been determined to be more natural gas than oil, and so hopes for finding more oil reserves has shifted into moves offshore, where Shell continues to be optimistic as it begins to sink new wells in the Chukchi sea – although well completions have now moved into next year. However it should be noted that there have been suggestions in the past that more of the hydrocarbons under the Arctic are gas deposits than oil, and this argument has been strengthened by the recent discovery in the Barents Sea of more gas, when oil had been anticipated.

The current large volumes of natural gas that are being developed and marketed, whether in the United States or from Turkmenistan, are making considerable changes in the economies of many countries. Russia, who lost the sales battle to supply natural gas to China now can no longer justify the expense of opening the Shtockman field, as alternate supplies are coming to the market at lower costs, and this will, in turn, cascade on to prices in Europe, where the advent of more gas in the UK is making it more difficult to justify a switch into a greater reliance on renewable sources such as wind and solar.

This entire scenario means that it is not necessarily a good time to have a huge reserve of natural gas, and to go to the market with this as a resource to generate income. This is particularly true, if the country in question is Iran.
Iranian Oil Minister Rostam Qasemi has announced that Iran’s exploitation of the South Pars gas field will equal Qatar’s exploitation of the gas field by the end of Iranian calendar year 1392 (ends March 20, 2014) if $54 billion is invested in gas projects.
Iran and Qatar share the largest natural gas field in the world, a reserve that is known as the North Field in Qatar, and as South Pars in Iran.


Figure 1, The South Pars field which lies between Qatar and Iran in the Persian Gulf (PetroPars Annual Report )

Qatar has been exporting Liquefied Natural Gas for a number of years, and has been well able to manage a steady growth in market penetration, as noted in a previous post, and this quote from two years ago:
Ras Laffan 3 Train 7 is the fourth 7.8 million tons per year LNG plant brought online by Qatar Petroleum and ExxonMobil joint ventures within the past 12 months. It matches the capacity of Ras Laffan 3 Train 6, one of the largest operating LNG production facilities in the world, inaugurated in October 2009. These mega facilities have sufficient scale to competitively reach markets around the globe. Qatar's giant North Field, which is estimated to contain in excess of 900 trillion cubic feet of natural gas, will supply both trains.
For Iran to anticipate that they can generate the infrastructure to compete with Qatar in the short term, given the time taken to invest, not only in the surface plant, but also in the tankers that become dedicated to the customers and the routes that must be followed, is more than naïve. That they can expect to do this at a time when, more than in any time in the recent past, there is an adequacy of supply unseen in a generation, suggests a message that can be meant for local consumption only.

But Iran has other problems. At present, as noted last time, natural gas supplies are barely keeping pace with an acceleration in the volumes required to meet internal demand. Any move to increase production will face competition not only from Russia (with available natural gas supplies once anticipated to be sold to the USA, and, when that fell through, then to China) and Qatar but also potentially from the United States itself, since as The OGJ recently noted
“U.S. LNG export potential is a major issue in Asia, particularly in Seoul and Tokyo,” said Mikkal E. Herberg, research director at the National Bureau of Asian Research (NBR)’s Energy Security Program and the report’s editor, “That’s especially true for the next 5 years until major Australian and other export projects come on line.”
With China getting more of its supply through pipelines this may also weaken the LNG market, even as Iran moves to step into these waters.

So can Iran also move its natural gas by pipeline, it is, after all connected by land to potential customers. Well, apart from the relatively obvious problems of trying to do this at a time when the nations concerned with Iranian nuclear policy are tightening their sanctions on Iran, as they are being seen to have more effect, the question comes back to who might be a potential customer. At present Turkey buys the bulk of Iranian natural gas exports but the European Union is expected to include natural gas in the list of banned exports at the meeting on October 15th. (Armenia and Azerbaijan buy the remainder of the current export volumes). There was a recent explosion in a gas pipeline carrying natural gas from Iran into Turkey, stopping the flow. But while that initially imposed a supply problem for Turkey, this has been met through increased purchases from Russia which currently has plenty. Thus it would appear that while Iran has more than sufficient supplies to move into an increased export position, the current political situation will likely preclude this happening in the short term, and the global over supply may well restrict Iranian penetration into that market in the longer term.

** September Alaskan pipeline flows were at 517 kbdm against the average for this year of 537 kbd, however as winter gets established the latest volume reported for 10/09/12 was 580 kbd, moving the pipeline away for the critical numbers.

Read more!

Friday, September 28, 2012

OGPSS - An introduction to Iran

The theme of these posts, over the past eighteen months, has been to look at the leading producer nations that provide crude oil to the world, and see whether it is realistic to anticipate significant increases in their production. Posts have now looked at North America, Russia, Saudi Arabia and China based on the original list of rankings produced by the EIA in 2009. And, as I noted before beginning the China posts the interesting question at the moment relates to a) how much oil is Iran currently producing and b) how much, realistically, can it be expected to produce.

These are not questions with the same answer, since the current sanctions that have been imposed on the country have clearly already had an impact on the amount of oil that is being exported from Iran. Nevertheless the volumes produced have fallen below those now achieved by China, and for that reason China was given priority when it came to the order of writing these posts. But back at the beginning of 2011 there was no doubt that Iran was one of the top 5 producers (particularly if one combines the USA and Canada into the new “politically correct” term of North America as a way of dodging questions on long-term US production levels).

If one looks at the latest, September OPEC Monthly Oil Market Report (MOMR) for example, there is now a gap of 1 mbd between the official production claims, which are shown below, and the reports from other sources, which follow.


Figure 1. OPEC production reports, from the originating country (OPEC September MOMR )


Figure 2. OPEC production reports, as provided by secondary sources (OPEC September MOMR )

In passing it should be noted that OPEC is anticipating global oil demand to grow 0.9 mbd in 2012, and 0.8 mbd in 2013. To meet that OPEC anticipates that non-OPEC production gains will be 0.7 mbd in 2012, and 0.9 mbd in 2013, taking some of the pressure away from the OPEC producers. Within OPEC production, the gains from NGL’s are anticipated to further increase by 0.4 mbd in 2012, and 0.2 mbd in 2013. These figures again ease the need for OPEC to show increases in production to meet export demands, at the time that their internal consumption continues to rise.

Iran is thus, by the original criterion, the last of the Big Five to be looked at, although, in light of current production numbers it has clearly fallen into the second tier, and with current production below 3 mbd it joins others (Mexico and Veneuela, for example) who have fallen through from upper second tier into the lower second tier of nations that produce below 3 mbd, though this is likely transient, depending on how long sanctions last and, more critically, are effective.

If there is little likelihood of major increases in production from Russia, Saudi Arabia, and China, and that I take some of the optimism over North American production gains with a considerable grain of salt, then global increases in production must come from nations that are now producing below 3 mbd. With that size of an industry it is difficult to anticipate spectacular increases from a single producer. Rather individual country gains (with the exception of Iraq, which could increase production to 4 mbd) will likely only be perhaps on the order of 100 kbd. As a result, if global needs are to be satisfied, there has to be a whole series of overall gains in a multiplicity of countries. For it is only in this way that the total can combine to sustain the optimism of those who see a cornucopia of oil flooding our future through at least the next ten years.

That Iraq has moved into the second tier above 3 mbd this month (by both their own and other counts) makes it a separate point of discussion. But first there is Iran. And with President Mahmoud Ahmadinejad giving a more subdued speech before the UN this week as sanctions continue to bite, the role of crude in the Iranian economy may be becoming more evident to their government. Domestic consumption runs at about half of production, but the country needs the income from exports.


Figure 3. Iranian Oil statistics (Energy Export Databrowser )

Euan Mearns illustrated the range of Iranian oil facilities in his post last December prior to the embargo.


Figure 4. Iranian oil and gas fields and infrastructure (Euan Mearns at TOD)

Oil production in Iran has increased since the days in 2005 when, for a while, it appeared that the country had reached a point of declining oil production, and where natural gas injection was being debated as the possible answer. At that time as the debate over Iran “going nuclear” was beginning to build there was already a rationale for the development of nuclear power in the country.

Jump forward seven years and that debate is now at a much more intense level. The Israeli Prime Minister is seriously concerned over the development of nuclear weapons in Iran, as are other countries in the region, and around the world. The relative need for Iran to establish a nuclear-based electricity program, while used as a justification of the program by their government, has been largely neglected in the concern over the potential for weapons development. Sharing the largest gas field in the world (the South Pars: North Field) with Qatar, Iran has a resource that is being used at an increasing rate internally, with slight amounts being imported in the remote northern part of the country, where it is easier to use gas from abroad than to lay the delivery lines in country.


Figure 5. The South Pars: North Field Gas field shared by Iran and Qatar. (petroleum reports via The Encyclopedia of Earth)


Figure 6. Iranian natural gas statistics (statistics (Energy Export Databrowser )

And so, with the above as background, the next couple of posts will look at the Iranian situation in a little more detail.

Read more!