Showing posts with label global demand. Show all posts

Tuesday, February 11, 2014

Tech Talk - The BP Energy Outlook 2035

BP begins its new forecast for the energy future with the statement:
We project that by 2035 the US will be energy self-sufficient while maintaining its position as the world’s top liquids and natural gas producer.
This illustrates the optimism which BP are projecting in their image of future production. But it carries with it a lot of inherent assumptions, some of which are relatively easy to identify in the summary graphic presentation that accompanied the initial presentation of the new report. Perhaps the most illustrative of their optimism is this plot, which shows the increasingly decoupled changes in energy supply relative to projected increases in GDP.


Figure 1. The reducing dependence on Energy growth as a control on GDP. (All figures are from the new BP Energy Outlook for 2035)

Each year there are significant projections for the future of energy over the next few decades. Recent posts have reviewed this year’s projections from the IEA and ExxonMobil. These projections, were also reviewed last year and those reviews included the previous BP projection although that only projected forward to 2030 – the current review has added five years to this.

The relative contributions of the different fuel sources to the overall mix have not changed appreciably in the past year. Oil is anticipated to continue to shrink in percentage contribution, and coal will also decline in relative contribution after around 2020. Natural gas and renewables are anticipated to make up the supply needed.


Figure 2. Relative contributions of the different fuel sources to overall global energy supply to 2035.

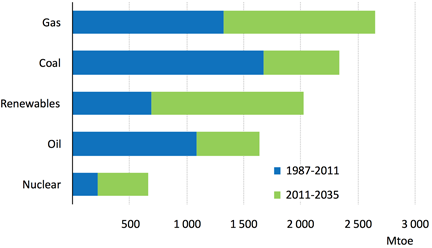
BP have made it a little easier to see how this breaks down by plotting the ten-year increments in fuel contribution as well as the overall totals.


Figure 3. Changes in projected fuel supplies over the period to 2035.

Changing the plot to show the ten-year incremental changes illustrates how coal, now surging as an international fuel source, is anticipated to decline beyond 2020.


Figure 4. Projected ten-year incremental changes in fuel supply through 2035.

Note that in overall total BP is projecting that global consumption will rise by 41% over today’s numbers, most of which increase will come from the rapidly-developing countries of the world.


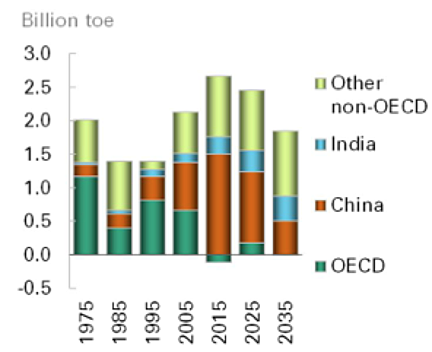
Figure 5. Regional increments of energy consumption growth over the decades to 2035.

The reliance on the improvements in energy efficiency to stall further growth in energy demand from the OECD countries is evident in this picture.

BP notes that the decade from 2002 to 2012 saw the “largest ever growth in energy consumption in volume terms,” but anticipates that this rate will never be exceeded in the decades to come. And they anticipate that as Chinese growth fades in the decades, so the growth of the Indian and adjacent economies will almost match that of China by the end of the period. As the nations of the world complete their industrialization, so the growth in the demand for fuel will see a greater emphasis on transportation demands.

Interestingly the decline in the demand for coal that BO projects is linked to the completion of industrialization in China, and this assumption is, of course, predicated on oil and natural gas remaining available to meet the demand at a reasonable cost.


Figure 6. Anticipated primary sources for generation of electric power.

The projections for changes in liquid fuel supply are also relatively simply presented. First one can see the projected changes in demand, with the OECD countries declining, as demand increase seems to focus in the Eastern nations.


Figure 7. Anticipated changes in global demand for liquid fuels

It is where this growth in supply is to come from that is of the greatest concern, and BP suggest the following:


Figure 8. The anticipated sources for growth in liquid fuel supply through 2035.

BP note the largest sources of these gains as being:
The largest increments of non-OPEC supply will come from the US (3.6 Mb/d), Canada (3.4 Mb/d), and Brazil (2.4 Mb/d), which offset declines in mature provinces such as the North Sea. OPEC supply growth will come primarily from NGLs (3.1 Mb/d) and crude oil in Iraq (2.6 Mb/d).
One of the more interesting plots in the report shows how, over last year, the changes in US production more than compensated for the declines in production from the MENA countries.


Figure 9. The ability of increased US production to balance declines in production from the nations in turmoil in MENA.

BP anticipates that continued US increases in production will more than balance the anticipated increases in global demand, so that the continued disruptions will not significantly affect global supply even though, as they have historically, they extend for more than ten years. The US gains are anticipated to continue to such an extent that OPEC will be required to rein in their supplies in order to sustain global prices.


Figure 10. Changes in the demand for OPEC oil and the result on their production reserve capacity.

One anticipates, given that KSA has said that they will not increase overall supply much above current levels, that the increases in production that BP anticipate will likely come from Iraq, and Iran if the sanctions are lifted. Given the current situation in those parts the latter seems increasingly more likely than the former. Further BP note that the increasing populations in these countries and their consequent increases in demand for energy is likely to constrain the levels at which these countries can continue to export.

In conclusion, and to justify the heading at the top of this piece, BP anticipate a continued growth in US oil production such that, by 2035 imports are virtually eliminated, being more than offset by the gains in the export of natural gas products. BP anticipates that the latter will increase by 2025 to around 12 bcf/d and continue at about that level.


Figure 11. BP projections for changes in the US oil supply sources for the period to 2035.

Read more!

Sunday, January 26, 2014

Tech Talk - Coal begins to fight back

As the President moves further into his second term, he appears to be growing more willing to tackle the concerns that his supporters have over projected Climate Change over the next century. Given the makeup of the Congress it is likely that this will be through additional regulation and Executive orders. There have been a number of reports that have documented the projected costs of climate change. Some of these have been relatively modest in statement. The Copenhagen Consensus Center, for example, noted:
Climate change is real and man-made. It will come as a big surprise that climate change from 1900 to 2025 has mostly been a net benefit, rising to increase welfare about 1.5% of GDP per year. Why? Because global warming has mixed effects and for moderate warming, the benefits prevail. The increased level of CO₂ has boosted agriculture because it works as a fertilizer and makes up the biggest positive impact at 0.8% of GDP. Likewise, moderate warming avoids more cold deaths than it incurs extra heat deaths. It also reduces the demand for heating more than increases the costs of cooling, totaling about 0.4%. On the other hand, warming increases water stress at about 0.2% and negatively impact ecosystems like wetlands at about 0.1%. Storm impacts are very small, as the total storm damages (including naturally caused storms) are about 0.2%.

As temperatures rise, the costs will rise and the benefits decline, leading to a dramatic reduction in net benefits. After year 2070, global warming will become a net cost to the world, justifying cost-effective climate action.
This, of course,led The Guardian to stress the post-2070 part of the comment. On the other hand there are the projections of the latest IPCC report (available here) that suggest that costs are already present in the global economy and that they see impacts ranging from a possible fall of 2% in global economic growth, as well as impacts on health and agriculture.

The projections, of which there are many, have focused on the need to cut greenhouse gas emissions and have moved governments around the world to take steps to reduce gas emissions, without a lot of comment from the industries most effected by the proposed regulatory changes. It appears that this relatively low key approach is going to change as a new report prepared for the American Coalition for Clean Coal Electricity (ACCCE) provides some strong factual discussion points that argue rather for the benefits of carbon use, and contrast these with the costs.

It has become politically popular in recent years to increasingly demonize the fossil fuel industries, and particularly the coal industry. And I have suggested, in the past, that this was an over-reaction. However it is of value to rational discussion of the issue to recognize the points that Management Information Services have put forward in this report.

Much is made of the increased fuel use that continues to power the Industrial Revolution as it continues to spread into under-developed countries and brings their standards of living up to those enjoyed by many in North America, Europe and the more well developed countries. The transition to the better standards of life is considered to need an energy consumption, per capita, of 4,000 kWh per year.


Figure 1. The UN Human Development Index and per Capita Electricity Use (America's Power )

When one considers the relative benefits of the use of power it sometimes help to recognize the mind-set of those making the comparison. The view of someone just gaining access to electric power, and who built a windmill to provide that power, reflects a greater recognition of the benefits of electricity than sometimes seems to be currently politically correct.

The benefits brought by the available power that is now in individual hands as a result of the Industrial Revolution are manifest in virtually every aspect of our daily lives. To maintain and spread that wealth of benefits through the expanded use of electricity to an increasing global user market the IEA projects that there will be an increase in virtually all power sources for electricity over the next twenty-five years.


Figure 2. Projected Electric Power Generation by Energy Source (America's Power )

However one of the impacts of increasing regulation, and the drive to switch to alternate, renewable power sources in Europe has already been an increase in the cost of that power. This is already leading the European Union to review their policies since increasing power costs lower the competitive position of European industries relative to those of countries (such as the USA) with lower power costs.

Within the United States the report concludes that there is a negative correlation between electricity prices and the economy with a suggestion that a 10% increase in electricity prices will cause a 1 % drop in GSP. (This is an awkward argument to make given that the economies of places such as Massachusetts are significantly better with an energy cost of over $0.14/kWh that those of West Virginia where the cost is about $0.08 per kWh – though the argument is about relative change).

But the increases in power costs do not just impact the competitive advantage of industry. As prices rise, so the poorer segment of the community find it harder to meet all their living needs. There is a graph that shows their choices:


Source: National Energy Assistance Directors’ Association. Figure 3. Potential Health Impacts of Increased Energy Costs on Low Income Persons (America's Power )

It is the broad use of coal that keeps the prices of power in many countries low, and the ability of many to utilize a domestic resource allows developing countries the opportunity to climb the ladder faster than the rates that they would be able to achieve without this resource. It should be remembered that over the course of the changes brought by industrialization since 1750 (as the report notes):
From 1750 to 2009, global life expectancy more than doubled, from 26 years to 69 years; global population increased 8-fold, from 760 million to 6.8 billion; and incomes increased 11-fold, from $640 to $7,300. . . . . . . in the U.S. from 1900 to 2009 population quadrupled, U.S. life expectancy increased from 47 years to 78 years, and incomes (denoted “affluence”) grew 7.5-fold while carbon dioxide emissions increased 8.5-fold.
The reality of the next decades is that coal and the other fossil fuels will, over the next twenty-five years, remain the basis for electricity generation for a significant portion of the global economy. This is likely to be particularly true for those nations that will grow the most in population and GDP over that interval.

By discounting the benefits that these improvements in life will bring to those countries, and focusing more on the hypothetical costs of anticipated problems the Administration has made a case for changing the energy mix. It is interesting to see that the industry that it likely to be most changed by their policies is now beginning to publically and with facts, shown willing to rebut some of those arguments.

Read more!

Tuesday, December 17, 2013

Tech Talk - The IEA World Energy Outlook

It is the time of year again that different folk stare into their own versions of a crystal ball and project how much energy the world will need in the future, and where they think that it will come from. It is interesting to look at these various predictions as the global supply picture morphs under a changing reality.

One of the changes in reality that is likely to have significant impact in the near-term is the flow in the Alyeska pipeline. Long-time concerns over the decline in flow and the effect that heat loss has on the contents is leading to new work to change the pipe dynamics and possibly to remove the water before it is pumped, lowering the temperatures at which the line currently has to be maintained.


Figure 1. Historic and Projected flows through the Alaskan pipeline (Alyseka)

The precipitation of ice and water from the oil, within the pipeline will otherwise reach a point that flow will stop – potentially at around 300 kbd, at a date not too far into the future.

In their annual World Energy Outlook, the IEA continue to see, overall, a gain in US oil production through 2025, largely coming through the light tight oil of the sort being produced from North Dakota and West Texas.


Figure 2. IEA projections for global oil production growth in the years to 2035. (IEA)

However in the following years , out to 2035, that supply also declines so that by 2035 the US will likely be in the same sort of supply situation, relying heavily on imports, that it is today.

The IEA make the point that the only longer term places that can be relied on are Brazil, with the off-shore fields, and the Middle East. Looking first at Brazil, which continues to have some problems in bringing their fields on-line on-schedule, the IEA anticipates that the major production growth is likely to be in the next ten years, but will continue beyond that point.


Figure 3. Brazilian oil production through 2035. (IEA)

Because the IEA foresee that Brazil will continue to supply the largest portion of its energy from hydropower this means that the largest volume of the fuel can be exported, where it meets the continually growing demand from the rest of the world.


Figure 4. Anticipates sources of power for electricity generation in 2035 (IEA)

At the same time the IEA anticipate that primary energy demand will still focus heavily on fossil fuel sources through 2035, with renewable energy only slowly nibbling away at the totals so that, by 2035 fossil fuel will have dropped from contributing the current 82% down to 75% of the larger total.


Figure 5. Anticipated changes in the sources of primary global energy through 2035. (IEA)

Although, by that time the IEA foresee a change not only in the places where demand is highest, but also in the relative rankings. The major finding in this regard that they draw attention to is the anticipated greater growth rates in India than in China, as time passes.


Figure 6. Changed picture of global energy demand in the year 2035 (IEA)

Other than projecting the growth in demand there is the need to anticipate where the supply will come from, and in this regard the IEA projects that the largest growth will come from natural gas (Figure 5), although crude oil is still anticipated to grow, with refinery capacity increasing to about 104 mbd.

It is interesting that the IEA projections for oil production growth hang most heavily on increased production from the Middle East. It requires very little glance into their crystal ball to assume that this is likely based on the increased production from Iraq, an assumption that was, last year, a largely common assumption to all future projections. Unfortunately for those earlier projections in the interim the initial Iraqi targets have been cut back, with current targets being reduced below the “best case” scenario that the IEA had projected in their review of the country.

Taken with the possibility of a significant and sudden decline in production from Alaska, and the likelihood that the rate of drilling in the Bakken will decline, as prospects become more uneconomic suggests that it will be difficult to sustain the levels of crude output that the IEA are anticipating can be made available to meet their projected needs.

By the same token the growth in the global demand for natural gas is predicated on the reserves uncovered in the United States being exported, as needed, to the rest of the world. It is, however, also predicated on the price of natural gas remaining relatively stable in terms of current costs.


Figure 7. Anticipated components of the costs of US LNG when shipped to either Asia or Europe (IEA)

The underlying flaw in that assumption is that the costs of purchasing the natural gas in the United States are now starting to rise to a more realistic level relative to the costs of production from tight shales. This week's OGJ, for example has noted the EIA Short Term Energy and Winter Fuels outlook that notes that prices are expected to rise 13% this winter over last (on constant demand) to $3.62 per kcf. Given that the EIA is expecting the price to inch upwards towards $5.00 per kcf over the next year this makes the IEA report appear a little over-optimistic on costs and hence market share.


Figure 8. Natural Gas Prices in the United States (EIA)

This is likely to be particularly true as some of the older gas fields, such as the Haynesville, appear to be in decline even at prices in the $4 - $5 per kcf range.


Figure 9. Natural Gas Production from the Haynesville Shale (OGJ )

Increasing the price of natural gas will reduce its competitive advantage over coal and in consequence I would anticipate that power generating companies will continue to build boilers that can handle both coal and natural gas, and that the longer-term continued switch to natural gas will become more of an economic choice dependent on how much LNG finally comes onto the market from the United States and at what price. I am not convinced that this will be quite the bargain and cornucopia that it is anticipated to become. In other words I still find the IEA view of the future to be a somewhat optimistic one, given the realities that are now unfolding before us.

Read more!

Thursday, June 13, 2013

OGPSS - A June TWIP, and the OPEC MOMR

The EIA has noted, in This Week in Petroleum that, for the first time, the sum of Non-OECD country demand contributed more than half to the total of liquid fuels consumed in the world.


Figure 1. Changes in the relative shares of liquid fuel consumption between the countries in and out of the OECD. (EIA )

It does, however, point out that the projections of the Short Term Energy Outlook are for the two curves to re-intersect at the end of 2014.


Figure 2. Projected changes in liquid fuels consumption, through 2014 (EIA)

The reality of that second assumption is, I rather suspect, more based on hope than reality. Once you start providing power, and all its benefits, to the general population you are on a slippery slope that it is almost impossible to back away from. Consider (as a small example) the problems that Egypt is currently having with the supply of subsidized bread to the general populace. Once you start supplying a commodity at a subsidized price it becomes very hard to change the equation, and too much of the non-OECD world is now living in an economy where energy use is subsidized. The problem that the above graph fails to recognize is that you cannot wean a culture from subsidies in the immediate short term and still expect their government to survive in its present condition.

Thus when the EIA project that global demand will grow to over 92 mbd in the next year, they are likely only being realistic. Their assumption that it may then decline is perhaps more in the nature of wishful thinking.


Figure 3. EIA anticipated growth in demand and supply over the near term (EIA)

There are however a couple of caveats to that last statement, the first of which is that the decline in demand may be more reflective of a lack of supply capacity (our raison d'ĂȘtre) and alternatively it may reflect, as a result of the first, that prices will rise to influence demand. Nevertheless we remain in a condition where the harsh realities that lie just over the horizon remain obfuscated by other events.

As with many other international agencies the EIA continue to anticipate continued growth in the North American supply of liquid fuels. Outside of that growth the increased demand for more than an additional mbd of liquid fuels seems more likely to be likely to be desperately hunting for an invisible savior.


Figure 4. Anticipated growth in liquid fuels supply over the next two years (EIA)

The decline in supply from OPEC in the two years ahead should be noted. It should also be remembered that this is likely to be as much a voluntary control, to ensure price stability in the face of increased North American production, rather than as a result of a short-term supply shortage. However the reality of continued domestic growth in demand in the Middle East, as Westexas has reminded us, is something that cannot be neglected. It has been noted that Saudi Arabia, although having less than a third of Germany’s population, recently surpassed it in terms of oil consumption. It will add several new oil-fired power stations including those at Yanbu and Jeddah. This will feed into an anticipated continued growth in Saudi domestic demand of 5.1% pa.

And this brings us to the OPEC Monthly Oil Market Report (MOMR) for June. OPEC continues to anticipate a global demand growth of 0.8 mbd this year, though they note that there will likely be a growth of 1.2 mbd in the non-OECD nations, requiring a reduction in OECD demand to match the overall forecast. Major growth in demand will continue to be in China (at 0.4 mbd and the Middle East at 0.3 mbd). On the other hand OPEC anticipate cutting their supply (to match anticipated need) by 0.4 mbd over the course of this year. OPEC, therefore, has slightly dropped their projection for year end, however it will still crest above 90 mbd.


Figure 5. Estimates of global oil demand (OPEC June 2013 MOMR)

A large part of demand projection is tied to growth in the global and individual nation economies, and that is a murky crystal ball to view. But OPEC anticipates that these economies will continue to grow at an increasing rate, while recognizing that this projection is in an area with a high level of risk in the estimate. The continued, and perhaps growing unrest in the Middle East continues to cast a further shadow over predictions over both supply and the reality of future demand in those countries. And, as one of the less frequently discussed topics, future output from Russia is not as assured as the average analyst appears to assume.

OPEC is anticipating a relatively strong growth in demand in the second half of the year to almost reach 91 mbd by the end of the year. Overall the growth in supply to meet this demand continues to come from North America.


Figure 6. Anticipated oil supply for 2013. (OPEC June 2013 MOMR)

OPEC itself is reporting a slight increase in overall production (by about 128 kbd) although, as always, there are differences in the numbers between those supplied by the countries themselves, and those reported from other sources.


Figure 7. OPEC crude oil production as reported directly (OPEC June 2013 MOMR)

There continues to be a significant disparity between the numbers reported from Iran and Venezuela, for example, when other sources are reported to the tune of around 1.5 mbd roughly. In the short term Iraqi production appears stable.


Figure 8. OPEC crude oil production as reported by others (OPEC June 2013 MOMR)

With the continued global reliance on increased production from North America, and, in turn, that reliance on improved production from tight formations, I would be a little more confident of the future were it not for plots such as this, which I recently found.


Figure 9. Chesapeake typical well decline curve (Eagle Ford Forum)

It is a curve that I rather suspect continues to be optimistic.

Read more!

Tuesday, December 11, 2012

OGPSS - Iran and the new EIA and OPEC Reports

With the possibility that demand for Iranian oil may fall below 1 million barrels a day (mbd) as sanctions continue to bite, Iran has announced that it wants OPEC to cut back production to the agreed quotas, rather than the overall additional 1 mbd that is actually being produced, and sold. Such a move would, of course, ,make it more difficult for those customers who have found a way of replacing Iranian oil, and perhaps incline them more towards disregarding the embargo.

OPEC has just released their December Monthly Oil Market Report (MOMR) in which they anticipate that earlier projections for 2013 oil demand growth will still be valid, at 0.8 mbd. (Though they note that December 2012 growth y-o-y was at 1.0 mbd as the US economy continued to improve). They expect that all of this increase will be met by non-OPEC increases in supply, and that demand for OPEC oil may even drop 0.4 mbd. Part of that projection continues to rely on increased US crude production, and the EIA TWIP of December 5th had the latest chart showing that projected growth, based on the newly released Annual Energy Outlook 2013.


Figure 1. Projections of future growth in US crude oil production. (EIA TWIP) from Annual Energy Outlook 2013)

As a footnote to that graph the Alyeska pipeline pumped an average of 582,755 bd in November, which brings the annual average up to 544, 625 bd. It is clear from looking at that plot that the gains in production are all assumed to come from increased production from the "tight" oil deposits that have produced the overall gains achieved to date. The optimism of this projection goes a little beyond the levels that I anticipate being achieved.

Coming back to the MOMR their projections do not include the recent news that Venezuelan President Chavez has had to have a fourth operation for cancer, and has named a successor, although the operation was apparently successful. This may complicate the decisions on how much to allocate among the OPEC partners, especially since all continue to need higher priced oil.

OPEC also give the price of various commodities in their report, and before going on to discuss country production, those prices are informative. (And can be read more easily by clicking on the table to get a better image). At present, with the decline in overall global demand, metal prices in particular seem to be continuing to slide.

Figure 2. OPEC report of commodity prices for November (OPEC December MOMR)

Equally informative is the demand that OPEC anticipates from the various regions of the world for oil in 2013.


Figure 3. OPEC estimates for regional oil demand in 2013. (OPEC December MOMR)

In total OPEC anticipates that global demand will reach 90.83 mbd by the fourth quarter of 2013, with the greatest growth continuing to be from China and the other Asian nations.

Looking at where this oil might come from, the main increase is still anticipated to come from North America.

Figure 4. Non-OPEC supply projections for 2013 (OPEC December MOMR)

The conflict in Syria is now reported to have led government forces to withdraw from the Omar and Al-Ward fields in the Deir Ezzor region, where much of Syria’s exports were produced. However the rebels do not, as yet control any of the refineries or export terminals and the result is that oil production is estimated to have fallen from 380 kbd to 160 kbd over the past few months. The regime is making up the shortfall in its needs by importing from Iraq.

Which brings us back to OPEC production levels. (Note that this is for crude oil and does not include the roughly 6 mbd in NGL that are currently being produced).

Firstly, this is what the various governments are reporting that they are producing:


Figure 5. OPEC production from official sources (OPEC December MOMR)

The total shows, among other things, how Libyan has recovered from their “Arab Spring.” In contrast with the official figures OPEC also posts the values from “secondary sources”.


Figure 6. OPEC production from secondary sources. (OPEC December MOMR)

The difference between the two figures for Iran is at around 1 mbd. Overall OPEC production is declining with the increase in non-OPEC production, so perhaps Iran won’t have quite as difficult a time persuading their colleagues to drop production a little more, to help them out. That won’t be at the latest meeting of the OPEC Ministers, which was held in Vienna on December 12th, where it was decided to maintain the current ceiling of 30 mbd.

The meeting was largely distracted by debate over who should be the new Secretary General, with this being “kicked down the road” for a decision at the end of May.

On the other hand, while Malaysia had promised to halt imports of oil from Iran last March, the IEA is reporting that they increased crude purchases from Iran in November. Whether this is oil ultimately destined for that country, or whether this a convenient transshipment point from Iranian tankers bringing in crude, which is then transferred to other carriers and a second purchaser is not clear, although a Chinese oil trader appears to be involved.

A move to make US natural gas available to NATO allies has begun in the Senate, with the intent that perhaps this could wean countries like Turkey from their use of Iranian and Russian natural gas. Whether this will ever amount to much is not clear, since Senator Lugar, the initial author, was defeated in the primary to the last election and thus leaves the Senate at the end of the term.

Read more!

Wednesday, December 8, 2010

This week's TWIP and record world demand for oil

Te EIA released their “This Week in Petroleum” today, with an article on American demand over the past year plotted by month. I had not seen the data presented that way before, and since you may not have, either, here it is:

Change in overall demand in the USA (EIA )

It is spread over two years so that you can see that demand bottomed out in May 2009, and has been rising ever since. As they point out, a growth of almost 1 mbd over last year is a very significant increase in demand, which just about offsets the similar sized drop in demand back a couple of years ago as the crisis began to develop.

If one notes that the plot ends in September, and then goes to the refinery input plot for this past week, that too is kicking up significantly, though at only about half the earlier gain y-o-y.

UPDATE: Because of these evidences of continued rising demand, the IEA has just raised its forecast of demand for next year by another 260,000 bd to 88.8 mbd.

Though in the period between these two points the input reverted to close to being the same as last year.


Gasoline demand does not show as high an increase, with most of the increase in production going into distillates.


That steady increase is a little odd, except that is being used to keep stocks up, given that demand has suddenly dropped off:

(The above figures are from today’s TWIP

At the same time ethanol production has steaily continued to climb to the point where it has now set a new record at 0.939 mbd.


Elsewhere in the world Wood Mackenzie is noting that we appeared to have returned to consumption levels from before the recession. In fact a new record has been reached:
Worldwide oil demand for this year’s third quarter will set a record at 88.3 million b/d, said Wood Mackenzie Ltd., Edinburgh, in its latest analysis. 

According to the report, provisional data shows that global oil demand for the recent quarter will almost certainly exceed the previous highest quarter—the fourth quarter of 2007—when demand averaged 88 million b/d.


Just 3 years from the onset of the great recession, global oil demand has recovered to the pre-recession peak seen in 2007, the report said.
The IEA is predicting that this new level will be close to the average demand for the whole of 2011 but it may be that those predictions are already behind the times.

Assuming that this is the case, then the talk of seeing crude over $100/bbl in the near future is likely to become more true than less. Not that this will cause much concern among the OPEC ministers soon to meet in Ecuador, and certainly it is not going to be a concern if, as Lybia’s minister predicts, oil reaches the $100 figure. Should that occur it might be that quotas get loosened a little, but that is unlikely to occur before the next meeting next June. Which might suggest that the projection of $100 oil may be exceeded quite a bit sooner than most people think. There is, after all, only so much oil still stored around the world in tankers.

Read more!