It is perhaps an odd time to be writing about oil shortages. The price of gas in our town has just moved above $2 a gallon up significantly from the $1.64 it was at its recent lowest point, but still very reasonable. Debate still rages as to whether the global price of a barrel of oil has found a bottom, although there are signs that the price is beginning to increase, in part due to other issues than overall availability of crude. So why be concerned?
There are several issues, and perhaps the first is that of industrial inertia. Despite the daily fluctuations in oil price, many of the events that occur between the time that oil is found in a layer of rock underground and the time that some of it is poured into your gas tank take a long time to initiate, and similarly can’t be turned off overnight. It takes, for example, roughly 47 days for a tanker to travel from Ras Tanura in Saudi Arabia to Houston.
One response to the drop in oil prices has been to reduce the number of rigs drilling for oil in the United States. Again this is not an immediate response, but rather one that grows with time. This is particularly true with the number of oil rigs that are used to gain access to the oil reservoirs. As the price for this oil falls, so rigs are idled and the potential for additional oil production also declines. This drop is particularly significant in fields that are horizontally drilled and fracked because of the very rapid decline in production with time in existing wells and the need for continued drilling to develop and produce new wells to sustain and grow production. The most recent figures show a fall of 98 rigs in the week from the 6th to the 13th of February, with the overall count now standing at 1,358. This rate of decline has held at nearly 100 rigs a week now for the past three with no indication of any immediate change in the slope of the curve. At the same time the number of well completions in the Bakken is falling, as producers hold back on the costs for producing oil that would be sold at a loss.
The impact from this will take time to appear, North Dakota has reached a production rate of 1.2 mbd in December and the DMR estimates that it will need around 140 rigs to sustain that production level this year, with the most recent rig count being 137. This number is likely to continue to fall through the first six months of the year.
The impact is not just in the immediate loss of production. Rather, once the rigs are idled it will take time, even after the markets recover, for the companies to adjust their planning and finances, and to re-activate the rigs. What this effectively does is to shift the production increment into later years, when the production base from existing wells will have declined beyond current levels. This means that the peak level of production will likely also be lower than would otherwise be the case, and the period over which this peak production is sustained will also be shorter.
The problem that this all presages is that lower levels of production against an increasing world demand will induce a faster rise in price than many now anticipate. There is a complacent feeling that oil prices won’t reach $100 a barrel for some considerable time - perhaps even years. If the current difference between available oil supply and demand is below 2 mbd, Euan Mearns has suggested that roughly half of this might be eaten up by increased demand, while the other half would disappear as production levels drop, although he doesn’t see this bringing the two volumes into rough balance until the end of 2016.
I rather think that it will happen faster than that, and that the price trough will steepen faster than currently anticipated, and likely before the end of this year. The problem (if you want to call it that) with the perceptions of the ability of global production to meet demand is that it is all tied to the production of the United States and Canada. I have noted, over the past two years, how future projections of increasing global oil demand have been met, in models, by increased production from the United States, and that this was anticipated to continue. (Increased production from Iraq, if sustained, is more likely to be needed just to balance declines in production from other countries).
Yet the US industry is going into a relatively rapid decline because of the way that it is structured that is going to be hard to stop, and much slower to reverse than anticipated. (In a way it is similar to the intermittent traffic congestion one finds on roads which result because we brake a lot faster than we then accelerate). This will not only stop the growth in production that is currently anticipated, but will go further and before the end of the year will lead to a drop in overall volumes produced. Yet demand is expected to increase. Where will the supply come from, if not the United States?
While Saudi Arabia can produce more, one gets the sense that they are quite comfortable where they are, thank you and won’t be increasing their contribution, and while Russia may bemoan the price they are getting for their oil, if the price goes up they are not going to be able to meet an increased demand, nor are there likely to be others with spare capacity that they can bring to the table. And because of the inertia in the system the United States will still be in a mode of declining production.
So I rather suspect that what we can anticipate is that prices will start to recover through the summer, and then, as the full impact of the rebalanced situation starts to become evident, will move higher at an increasing rate. Because if, in fact, we are reaching the period of a tighter balance between demand and available supply, then the market will change its perceptions quite quickly and be driven by a totally different metric.
Showing posts with label gas prices. Show all posts
Showing posts with label gas prices. Show all posts
Monday, February 16, 2015


Wednesday, December 31, 2014
Tech Talk - Projections 2
It is the end of another year, or more optimistically the start of a new one. Last year I was tempted to make a couple of predictions for the future. And while I can make the case that they were not too wrong, they did not include the drop in oil prices, which has now taken the price of our local gas to below $1.85 a gallon. China has, in recent months, seemed less belligerent about claiming large sections of the China Seas. Whether this has anything to do with the relative success of rigs that have drilled in those waters is something that still remains an unknown.
But it is the changing price of gasoline, itself reflective of the drop in oil prices that is the big news. WTI closed at $53.56 today, and Brent at $57.50 a barrel. Predictions include some who would suggest that the price will continue to fall, until it reaches $20 a barrel, and there it may stay for some time. Well it certainly grabs a headline, but that is about all the value that particular forecast contains. The futures prices suggest that the price has yet to bottom out, though it may be getting close to that value.

Figure 1. Crude oil futures prices (EIA TWIP)
None of the recent news suggests that there will be a further increase in supply to sustain the current imbalance between available supply and demand. Libya is descending even further into a mess, with the oil facilities at the port of Es Sider now being destroyed. The likelihood of significant increases in production and the return to export levels achieved earlier this summer seems increasingly nonexistent. Neither Russia nor Saudi Arabia are likely to increase production, although the latter are continuing to produce the increased volume that they originally put on the market to replace Libyan losses. And so this leaves Iraq and the United States as the key producers who can significantly change the current supply:demand balance in any significant way.
It is probable that, with the agreement between the Kurds and the Central Government now having generated a second payment of $500 million to the KRG that the agreement may be sustained and grow. At present the Kurds are to supply about 550 kbd, of which 300 kbd will travel through the new pipeline to Turkey and thence onto the world market. The rest will be supplied to Baghdad. Meanwhile production in the south (which gets exported through Basra) has seen some increase.
Whether the Kurdish production can increase to over 1 mbd by the end of next year remains open to some doubt, given the ongoing conflict, and the target 6 mbd by the end of the decade for the entire country will likely require changes that the current conflict, which shows no signs of ending, will inhibit.
One of my responses, when the drop in price first started, was to note that the oil supply system has a certain inertia to it. And here I am not talking about the fluctuations in price that one sees in the stock market, and in the price of the crude, but rather in the time that it takes to stop current drilling, postpone future plans and to reduce the production from existing and new developments.
Thus the drop in investment in new production, whether in Russia, Iraq or the United States takes some time to have an impact. Unfortunately for those expecting the price to continue to fall, in the face of the overabundant supply, the situation has changed since historic times, where well production was relatively stable and the oversupply situation was corrected by shutting in production (mainly by Saudi Arabia). Even then it was the perception of the response that drove price rebounds, rather than the immediate reality of the changes.
The system this time is different. The increase in production in the United States has been sustained, and over the last two years has produced more than 2 mbd more than at the start of that period.

Figure 2. US crude oil production over the past two years. (EIA TWIP)
The rig count in North Dakota has already fallen to 170 rigs compared with 187 at this time last year. Concern about the oil price has led companies to cut their investment plans for next years, in some case by 20% so that the rig count is likely to continue to fall. And with the short life at high production values for most wells that will soon affect production. The North Dakota Oil and Gas Division of DMR shows the consequences of this:

Figure 3. Future production estimates from the ND DMR Oil and Gas Division.
The blue line requires about 225 rigs in continuous action, so that won’t happen. By the same token the black line is with no more drilling, and that won’t happen either. The result will be somewhere in between, probably moving the peak out beyond the current projection, but also lowering it as the existing baseline drops with less wells significantly contributing. (Bear in mind it is taking 11,892 wells to sustain current production levels.) But in the short term the line will likely dip down until the price rebounds.
The question now becomes how soon that drop in US production will become evident, and have some impact. I doubt that it will be before June of 2015.
On which note may I wish all readers a Happy, Healthy, Successful and Prosperous 2015.
But it is the changing price of gasoline, itself reflective of the drop in oil prices that is the big news. WTI closed at $53.56 today, and Brent at $57.50 a barrel. Predictions include some who would suggest that the price will continue to fall, until it reaches $20 a barrel, and there it may stay for some time. Well it certainly grabs a headline, but that is about all the value that particular forecast contains. The futures prices suggest that the price has yet to bottom out, though it may be getting close to that value.

Figure 1. Crude oil futures prices (EIA TWIP)
None of the recent news suggests that there will be a further increase in supply to sustain the current imbalance between available supply and demand. Libya is descending even further into a mess, with the oil facilities at the port of Es Sider now being destroyed. The likelihood of significant increases in production and the return to export levels achieved earlier this summer seems increasingly nonexistent. Neither Russia nor Saudi Arabia are likely to increase production, although the latter are continuing to produce the increased volume that they originally put on the market to replace Libyan losses. And so this leaves Iraq and the United States as the key producers who can significantly change the current supply:demand balance in any significant way.
It is probable that, with the agreement between the Kurds and the Central Government now having generated a second payment of $500 million to the KRG that the agreement may be sustained and grow. At present the Kurds are to supply about 550 kbd, of which 300 kbd will travel through the new pipeline to Turkey and thence onto the world market. The rest will be supplied to Baghdad. Meanwhile production in the south (which gets exported through Basra) has seen some increase.
Whether the Kurdish production can increase to over 1 mbd by the end of next year remains open to some doubt, given the ongoing conflict, and the target 6 mbd by the end of the decade for the entire country will likely require changes that the current conflict, which shows no signs of ending, will inhibit.
One of my responses, when the drop in price first started, was to note that the oil supply system has a certain inertia to it. And here I am not talking about the fluctuations in price that one sees in the stock market, and in the price of the crude, but rather in the time that it takes to stop current drilling, postpone future plans and to reduce the production from existing and new developments.
Thus the drop in investment in new production, whether in Russia, Iraq or the United States takes some time to have an impact. Unfortunately for those expecting the price to continue to fall, in the face of the overabundant supply, the situation has changed since historic times, where well production was relatively stable and the oversupply situation was corrected by shutting in production (mainly by Saudi Arabia). Even then it was the perception of the response that drove price rebounds, rather than the immediate reality of the changes.
The system this time is different. The increase in production in the United States has been sustained, and over the last two years has produced more than 2 mbd more than at the start of that period.

Figure 2. US crude oil production over the past two years. (EIA TWIP)
The rig count in North Dakota has already fallen to 170 rigs compared with 187 at this time last year. Concern about the oil price has led companies to cut their investment plans for next years, in some case by 20% so that the rig count is likely to continue to fall. And with the short life at high production values for most wells that will soon affect production. The North Dakota Oil and Gas Division of DMR shows the consequences of this:

Figure 3. Future production estimates from the ND DMR Oil and Gas Division.
The blue line requires about 225 rigs in continuous action, so that won’t happen. By the same token the black line is with no more drilling, and that won’t happen either. The result will be somewhere in between, probably moving the peak out beyond the current projection, but also lowering it as the existing baseline drops with less wells significantly contributing. (Bear in mind it is taking 11,892 wells to sustain current production levels.) But in the short term the line will likely dip down until the price rebounds.
The question now becomes how soon that drop in US production will become evident, and have some impact. I doubt that it will be before June of 2015.
On which note may I wish all readers a Happy, Healthy, Successful and Prosperous 2015.
Read more!
Monday, October 6, 2014
Tech Talk - The Price of Power, and its consequences
The changing colors of the leaves carry the message that winter will soon be here, and so it is time to stock the yard with wood to carry us through until spring. In Missouri I just found wood, cut to the length I need, and stacked, for $110 a cord and (since it has to be cut) it will arrive next week. Only the chimney then needs a quick sweep, and we’ll be ready for another season. (We burn just under a cord of wood a month, and this keeps the electricity bill sensible).
At one time the wood was insurance, in case of an extended power outage (and we had one that lasted three days, one winter) but we enjoy the heat from the tile stove, and so it is now part of our life. And with the continued risk of a loss of power, the insurance remains comforting.
Driving back from Maine a couple of weeks ago, gas prices fell over $0.25 a gallon along the 1,300 mile trip, another benefit of living in the Mid-West. But at both ends of the drive, the impact of fuel prices continues to slow economic growth, as it does nationally. Gail Tverberg has written of the inter-relation between the economy and fuel prices, most recently on Monday. However we disagree on one point, since she anticipates a potential significant drop in oil prices, which I do not.
In the early days of The Oil Drum I remember walking through the streets of Denver to a meeting with two other contributors, and suddenly realizing that I, the more technically based of the three, was by far the most pessimistic. Increasingly I am realizing that while this pessimism has not ameliorated, the current relative abundance of oil and gas in the United States has given many folk an undeservedly complacent view of the next few years.
Ron Patterson recently pointed out that if one discounts US production, the rest of the world has seen a decline in production, with non-US production now down around 2 mbd from its all-time peak. (If one also removes Saudi Arabian and Russian production from the mix, the decline gets closer to 3 mbd). Now to assume that this is totally due to a loss in production capacity would be a mistake. Saudi Arabia continues to adjust the volume of their production to try and keep global prices relatively stable, dropping production by 400 kbd in August. In the immediate short-term that was not enough for their purpose, and they are now lowering price a little, perhaps in order to sustain their market share. The cuts were in the range of $0.20 to $1.20 a barrel). Although it could also be a way of trying to sustain global growth at a time of weakness.

Figure 1. Global Production without including the United States – as plotted by Ron Patterson. I added the trend line at the end of the top plot.
These flutterings at the margin however don’t help my concerns, because they are focused only on the short-term, and don’t consider the overall situation. If the production from the rest of the world is declining at around 700 kbd, and Saudi Arabia will only produce to a maximum of 10 mbd, and Russia appears to be in that plateau that precedes decline, even without the loss in funding that recent US Government mandates will impose, then that leaves the growth in US production as being the only source to match both the decline in global production, and the continuing demand for more oil which together total around 1.7 mbd. And US production projections, even at their most optimistic can’t do this, even for one more year.

Figure 2. Projected Growth in US production (EIA)
The mathematics are, of course, not absolute numbers but remain somewhat flexible. There could be a sudden cessation of conflict in Libya and full production might return; all conflict might end in Iraq and production development might surge at the investment opportunity; and sanctions might disappear against Iran – but somehow I don’t see any of these happening.
The argument of the Cornucopians, that one can either find a substitute for the fuel in some other resource, or that technology will suddenly become available to allow unanticipated levels of production from the existing reserves and resources is, perhaps why I – knowing a fair bit about the technology – am more of a pessimist than many others.
The analogy that I use may be a little crude – but you can’t have a baby in a month by making nine women pregnant. You can’t create new technology out of thin air by suddenly investing a few billion in a bunch of scientists pulled from lists on the Internet either. There are not that many folk who are sufficiently expert to be useful, particularly in the fields that relate to the production of fossil fuels. Many of those who do exist are, like me, coming to the end of their professional lives, so that the skill sets and knowledge bases that they have built are disappearing. Many of the doctorates that we see today are based more on computer modeling than on hands-on experimentation and engineering. And unfortunately the knowledge that we have about the nature of the rocks at depth, their behavior and how to change the way in which they yield their fluids still leaves a lot to be desired, when it comes to validating the models that are produced.
But even if such new technology were developed it would take decades to see it adopted in sufficient volume across the world that it would have a significant impact on global fuel production. It was for this reason that, back in 2005, the Hirsh Report discussed the need for a twenty-year lead-time to develop new technology that could replace our needs for fuel. The time that they suggested that we had available now is beginning to seem very optimistic, while the moves to ameliorate the problem have been judged less critical and thus no longer receive the attention and funding that the have in the past.
And so, when the crisis comes, and this is increasingly likely to come in the next two years, there will be no good answers, just tightening supplies and rising prices. This is perhaps why I am beginning to think that the next President of the United States still may well be, despite all the gaffs, Brian Schweitzer.
At one time the wood was insurance, in case of an extended power outage (and we had one that lasted three days, one winter) but we enjoy the heat from the tile stove, and so it is now part of our life. And with the continued risk of a loss of power, the insurance remains comforting.
Driving back from Maine a couple of weeks ago, gas prices fell over $0.25 a gallon along the 1,300 mile trip, another benefit of living in the Mid-West. But at both ends of the drive, the impact of fuel prices continues to slow economic growth, as it does nationally. Gail Tverberg has written of the inter-relation between the economy and fuel prices, most recently on Monday. However we disagree on one point, since she anticipates a potential significant drop in oil prices, which I do not.
In the early days of The Oil Drum I remember walking through the streets of Denver to a meeting with two other contributors, and suddenly realizing that I, the more technically based of the three, was by far the most pessimistic. Increasingly I am realizing that while this pessimism has not ameliorated, the current relative abundance of oil and gas in the United States has given many folk an undeservedly complacent view of the next few years.
Ron Patterson recently pointed out that if one discounts US production, the rest of the world has seen a decline in production, with non-US production now down around 2 mbd from its all-time peak. (If one also removes Saudi Arabian and Russian production from the mix, the decline gets closer to 3 mbd). Now to assume that this is totally due to a loss in production capacity would be a mistake. Saudi Arabia continues to adjust the volume of their production to try and keep global prices relatively stable, dropping production by 400 kbd in August. In the immediate short-term that was not enough for their purpose, and they are now lowering price a little, perhaps in order to sustain their market share. The cuts were in the range of $0.20 to $1.20 a barrel). Although it could also be a way of trying to sustain global growth at a time of weakness.

Figure 1. Global Production without including the United States – as plotted by Ron Patterson. I added the trend line at the end of the top plot.
These flutterings at the margin however don’t help my concerns, because they are focused only on the short-term, and don’t consider the overall situation. If the production from the rest of the world is declining at around 700 kbd, and Saudi Arabia will only produce to a maximum of 10 mbd, and Russia appears to be in that plateau that precedes decline, even without the loss in funding that recent US Government mandates will impose, then that leaves the growth in US production as being the only source to match both the decline in global production, and the continuing demand for more oil which together total around 1.7 mbd. And US production projections, even at their most optimistic can’t do this, even for one more year.

Figure 2. Projected Growth in US production (EIA)
The mathematics are, of course, not absolute numbers but remain somewhat flexible. There could be a sudden cessation of conflict in Libya and full production might return; all conflict might end in Iraq and production development might surge at the investment opportunity; and sanctions might disappear against Iran – but somehow I don’t see any of these happening.
The argument of the Cornucopians, that one can either find a substitute for the fuel in some other resource, or that technology will suddenly become available to allow unanticipated levels of production from the existing reserves and resources is, perhaps why I – knowing a fair bit about the technology – am more of a pessimist than many others.
The analogy that I use may be a little crude – but you can’t have a baby in a month by making nine women pregnant. You can’t create new technology out of thin air by suddenly investing a few billion in a bunch of scientists pulled from lists on the Internet either. There are not that many folk who are sufficiently expert to be useful, particularly in the fields that relate to the production of fossil fuels. Many of those who do exist are, like me, coming to the end of their professional lives, so that the skill sets and knowledge bases that they have built are disappearing. Many of the doctorates that we see today are based more on computer modeling than on hands-on experimentation and engineering. And unfortunately the knowledge that we have about the nature of the rocks at depth, their behavior and how to change the way in which they yield their fluids still leaves a lot to be desired, when it comes to validating the models that are produced.
But even if such new technology were developed it would take decades to see it adopted in sufficient volume across the world that it would have a significant impact on global fuel production. It was for this reason that, back in 2005, the Hirsh Report discussed the need for a twenty-year lead-time to develop new technology that could replace our needs for fuel. The time that they suggested that we had available now is beginning to seem very optimistic, while the moves to ameliorate the problem have been judged less critical and thus no longer receive the attention and funding that the have in the past.
And so, when the crisis comes, and this is increasingly likely to come in the next two years, there will be no good answers, just tightening supplies and rising prices. This is perhaps why I am beginning to think that the next President of the United States still may well be, despite all the gaffs, Brian Schweitzer.
Read more!
Tuesday, December 3, 2013
Tech Talk - Falling gas prices and Iraq
Filling up at the local gas station yesterday I noted that prices are still below $3.00 a gallon, though at $2.99 only just below. Going back to the BBC Calculator this is still $2.04 less per tank than the regional average, and $86 less than I would pay in Italy. So even though the costs are rising over the last time I looked, they are still relatively low.

Figure 1. Relative fuel costs ($/gal) in different locations around the world. (BBC Calculator)
The orange line in figure 1 shows what I paid, and the darker grey horizontal line the regional cost here in the MidWest.
The EIA have noted in last week’s TWIP that the national price is as low as it has been since the beginning of 2011.

Figure 2. Average US retail prices for gasoline (EIA).
The EIA continues to describe the causes of these relatively low prices:
The problems in Iraq, for example, have now reached the point that the Turkish government is directly working with the Kurds in Northern Iraq, to develop the oil in the Kurdish northern part of Iraq. This comes at a time that Iraq has been negotiating with the different major oil companies that had contracted to help Iraq reach an overall production target of 12 mbd by 2017. There have been considerable doubts cast on that original estimate, with the IEA producing a report, reviewed in an earlier post that concluded that the country would be lucky to achieve a production goal of 6 mbd by 2020, with an out year estimate that the country would be able to reach 8.3 mbd only by 2035.
Recognizing some of the difficulties in gearing up oil production at the different oilfields around Iraq (some of which were discussed in another post last June) production targets for 2017 had already been scaled back to a goal of 9 mbd by 2017, a drop of 25%. Now there has been discussion between Iraq and its partners for the various fields to drop those target values further, despite the large scale of the reserves that are considered available.

Figure 3. Oil reserves by field (Financial Times)
Exxon Mobil had 60% of the stake in the West Qurna oil field, but after it had started to work with the Kurds independently of Baghdad it found that relations with the Central Government rather chilled. Exxon Mobil has thus sold 25% of their stake to Petro China, and 10% to Pertamina of Indonesia, bringing the EM stake down to 25%. The current discussions between the companies and the Iraqi government are aimed at reducing the production target of the field by around 1 mbd..
Oil has just started to be produced at West Qurna Two, but the initial target is to have commercial production by the end of the year has suffered from local disruptions and the initial goal to reach a production of 400 kbd by the end of 2014 is now also in doubt. Commercial production is now not estimated to begin until perhaps the end of the first quarter of 2014. Initially the field was to be producing 1.9 mbd by 2017. That goal had been lowered to 1.2 mbd at the end of 2012. How the current disruptions will play into that target is difficult to estimate yet, but a year ago the parties were assuming that production would have already reached 150 kbd.
Earlier this year ENI had agreed with the Ministry of Oil to lower the target peak production from the Zubair field from 1.2 mbd to 850 kbd with that goal to be reached in 2016.
Discussions are not yet complete on new target production to be achieved from the Majnoon field. Shell has just announced the start of production from the field with the intent of raising production to over 175 kbd by the end of the year. However the long term target of raising production to 1.8 mbd is now in question. Shell is reportedly suggesting that the 2017 target be lowered to 1 mbd.
Similarly over at the Rumaila field BP is in discussion over long-term production, although earlier last month Schlumberger stopped work at the field because of local disturbances. With the field producing 1.4 mbd the disturbance was short-lived and is not reported to have affected current production, though it is indicative of tensions within the country. Current discussions are aimed at lowering the 2017 target production by around 800 kbd.
When these cuts are combined the total reduction is around 3.65 mbd, taking 2017 production down to 5.35 mbd, which is below the earlier best case scenario envisaged by the IEA.
OPEC notes that, after reaching a peak recent production of 3.194 mbd in August, production has fallen back below 3 mbd in September and October, and with Saudi Arabia also cutting back below 10 mbd in October the Organization is lowering production to meet the reduced winter demand, albeit the reduction from Iraq might not have been anticipated.

Figure 4. OPEC production figures through Oct 13, 2013 as reported by others to OPEC (OPEC MOMR )
This means, unfortunately, that if the world was anticipating that the roughly 4 mbd increase in global demand by 2017 would be met largely by increased oil production from Iraq then they are likely to be sadly disappointed. Enjoy the lower gas prices while you may.

Figure 1. Relative fuel costs ($/gal) in different locations around the world. (BBC Calculator)
The orange line in figure 1 shows what I paid, and the darker grey horizontal line the regional cost here in the MidWest.
The EIA have noted in last week’s TWIP that the national price is as low as it has been since the beginning of 2011.

Figure 2. Average US retail prices for gasoline (EIA).
The EIA continues to describe the causes of these relatively low prices:
Lower global crude oil prices, high profitability for diesel fuel that has been encouraging refiners to increase throughput, high inventories, and the switch to less-costly winter grades of gasoline are among the factors currently driving gasoline prices.The OPEC Monthly Oil Market Report (MOMR) reports that global oil prices have fallen $2.04 a barrel (to $106.69) – the first decline in five months, as stocks increase and the Northern Hemisphere moves into winter. The estimate for global demand growth this year remains at 0.9 mbd, with the growth for next year anticipated to be at 1.04 mbd. This steady growth in global demand of a million barrels a day keeps raising the question as to where the increase is likely to come from. This is particularly germane given the disturbed conditions in a number of the MENA countries that provide a significant amount of baseline production, as well as anticipated increases.
The problems in Iraq, for example, have now reached the point that the Turkish government is directly working with the Kurds in Northern Iraq, to develop the oil in the Kurdish northern part of Iraq. This comes at a time that Iraq has been negotiating with the different major oil companies that had contracted to help Iraq reach an overall production target of 12 mbd by 2017. There have been considerable doubts cast on that original estimate, with the IEA producing a report, reviewed in an earlier post that concluded that the country would be lucky to achieve a production goal of 6 mbd by 2020, with an out year estimate that the country would be able to reach 8.3 mbd only by 2035.
Recognizing some of the difficulties in gearing up oil production at the different oilfields around Iraq (some of which were discussed in another post last June) production targets for 2017 had already been scaled back to a goal of 9 mbd by 2017, a drop of 25%. Now there has been discussion between Iraq and its partners for the various fields to drop those target values further, despite the large scale of the reserves that are considered available.

Figure 3. Oil reserves by field (Financial Times)
Exxon Mobil had 60% of the stake in the West Qurna oil field, but after it had started to work with the Kurds independently of Baghdad it found that relations with the Central Government rather chilled. Exxon Mobil has thus sold 25% of their stake to Petro China, and 10% to Pertamina of Indonesia, bringing the EM stake down to 25%. The current discussions between the companies and the Iraqi government are aimed at reducing the production target of the field by around 1 mbd..
Oil has just started to be produced at West Qurna Two, but the initial target is to have commercial production by the end of the year has suffered from local disruptions and the initial goal to reach a production of 400 kbd by the end of 2014 is now also in doubt. Commercial production is now not estimated to begin until perhaps the end of the first quarter of 2014. Initially the field was to be producing 1.9 mbd by 2017. That goal had been lowered to 1.2 mbd at the end of 2012. How the current disruptions will play into that target is difficult to estimate yet, but a year ago the parties were assuming that production would have already reached 150 kbd.
Earlier this year ENI had agreed with the Ministry of Oil to lower the target peak production from the Zubair field from 1.2 mbd to 850 kbd with that goal to be reached in 2016.
Discussions are not yet complete on new target production to be achieved from the Majnoon field. Shell has just announced the start of production from the field with the intent of raising production to over 175 kbd by the end of the year. However the long term target of raising production to 1.8 mbd is now in question. Shell is reportedly suggesting that the 2017 target be lowered to 1 mbd.
Similarly over at the Rumaila field BP is in discussion over long-term production, although earlier last month Schlumberger stopped work at the field because of local disturbances. With the field producing 1.4 mbd the disturbance was short-lived and is not reported to have affected current production, though it is indicative of tensions within the country. Current discussions are aimed at lowering the 2017 target production by around 800 kbd.
When these cuts are combined the total reduction is around 3.65 mbd, taking 2017 production down to 5.35 mbd, which is below the earlier best case scenario envisaged by the IEA.
OPEC notes that, after reaching a peak recent production of 3.194 mbd in August, production has fallen back below 3 mbd in September and October, and with Saudi Arabia also cutting back below 10 mbd in October the Organization is lowering production to meet the reduced winter demand, albeit the reduction from Iraq might not have been anticipated.

Figure 4. OPEC production figures through Oct 13, 2013 as reported by others to OPEC (OPEC MOMR )
This means, unfortunately, that if the world was anticipating that the roughly 4 mbd increase in global demand by 2017 would be met largely by increased oil production from Iraq then they are likely to be sadly disappointed. Enjoy the lower gas prices while you may.
Read more!
Sunday, November 10, 2013
Tech Talk - Energy cost, additive engineering and cavitation
I paid $2.85 for a gallon of gasoline this weekend, at the gas station just up the road from our house, here in South Central Missouri. A couple of weeks ago while I was in the UK the price my brother paid was around $8.00 a gallon. The BBC calculator that I used to check the UK price tells me that I am paying $6.89 less per tank than the regional average here, and that were I to live in Italy my tank-full would have cost me $95 more, while it Venezuela it would have cost $43 less. (It cost $45 to fill my tank).
The low cost of fuel is one of the benefits from the increased crude oil production in North America, sustained as it is by the increase in production from Saudi Arabia to balance the global market losses from other countries around the world. Further the EIA explains the refineries are helped with this low price by the high demand for diesel and the premium that it has achieved – causing refineries to run at record levels to meet the demand, and producing, as a secondary product, more gasoline that is thus being marketed at the lower price. It is a situation that the EIA expects to continue for a while.

Figure 1. US refinery inputs (EIA TWIP Nov 6, 2013)
The relatively low price of fuel, here in the United States, particularly relative to Europe is starting to attract industries historically located abroad. The move to date is being led by those attracted by the cheap price of natural gas, particularly in the chemical industry. BASF, for example, cut the ribbon last week on a plant expansion in Vidalia, LA and just recently announced plans to expand its research facility in Beachwood, Ohio.
It was, however, another report on manufacturing that really caught my attention this week. It was the news that 3D Printer technology had advanced enough to now make a gun from metal parts. The process involved is somewhat more complicated than that used in earlier guns manufactured using this new generation of equipment. Earlier in the year a gun had been made from plastic parts and made some additional news when a version fired nine shots without falling apart. The evolution of the plastic gun is worth noting in that the first one reported was built from components printed with an $8,000 second-hand Stratasys Dimension SST 3D printer. And while it fired a shot successfully, the gun blew up on the second trial. The second gun, however, was made on a $1,725 Lulzbot A0-101 3D printer, that was available from Amazon, made by Aleph Objects and it survived firing nine rounds. For a variety of reasons the plastic gun contained some metal parts, but it marked the advent of this new technology. Prices for these replicator units are already down below $2,000 and they are limited, at present, to working with different types of thermoplastic. (But they can make, for example, shoes.)
The difference in being able to move to making parts from metal, particularly those that allow the repeated (over 600 times) firing of the gun is a very significant step forward. Thirty-four parts were made from stainless steel and Inconel 625 and then a grip was made from nylon, using a classic 1911 design.

Figure 2. The metal gun made by Solid Concepts (Solid Concepts )
It is the different metal part of this that is worth underlining. The components were made by laser-sintering (which simplistically means that they used a laser to melt tiny particles of metal so that they would fuse together to make the model). The machine that is used to do this, at the present time costs between $400,000 and $1,000,000. It also has power and other logistic needs that require it be run in a commercial, rather than residential environment.
But, as Sold Concepts notes:
Chris Hechtl has already produced The Wandering Engineer” series of Science Fiction books, starting with New Dawn that uses the concept widely as one of the bases for the stories. (Worth a read just to get some idea of the scope of what is to come - though I am also enjoying the series, as the books are written).
It is going to change the way in which components are built, but it will also change the way in which minerals are processed once they are mined from the earth. It will be no longer necessary to cast metals into large ingots and then forge them down into smaller shapes. It is likely that, for many items in the near future that process will still be cheaper, but as time progresses and the costs of the process reduce (bear in mind that this is laser-based and remember how those costs have come down as lasers have become ubiquitous in society) that even large parts may be better made this way. Further it allows intricate melding of different materials to make products that are stronger and better suited to the need.
Thus the objective of mineral processing in the years to come will be aimed at making fine powders rather than going through all the steps to make the larger ingots. That will, in turn, impact earlier stages of processing, and, while I don’t normally discuss my own work in these posts, I would draw your attention to a recent post from October 31st, down below, which includes a video of a small piece of equipment virtually instantly breaking half-inch coal into 5-micron pieces, which can be done with a pressure washer from the local hardware store. It also works in breaking out minerals from their host rock.
The world indeed will change, and with those changes the power requirements of the future are also going to undergo drastic revision.
The low cost of fuel is one of the benefits from the increased crude oil production in North America, sustained as it is by the increase in production from Saudi Arabia to balance the global market losses from other countries around the world. Further the EIA explains the refineries are helped with this low price by the high demand for diesel and the premium that it has achieved – causing refineries to run at record levels to meet the demand, and producing, as a secondary product, more gasoline that is thus being marketed at the lower price. It is a situation that the EIA expects to continue for a while.

Figure 1. US refinery inputs (EIA TWIP Nov 6, 2013)
The relatively low price of fuel, here in the United States, particularly relative to Europe is starting to attract industries historically located abroad. The move to date is being led by those attracted by the cheap price of natural gas, particularly in the chemical industry. BASF, for example, cut the ribbon last week on a plant expansion in Vidalia, LA and just recently announced plans to expand its research facility in Beachwood, Ohio.
It was, however, another report on manufacturing that really caught my attention this week. It was the news that 3D Printer technology had advanced enough to now make a gun from metal parts. The process involved is somewhat more complicated than that used in earlier guns manufactured using this new generation of equipment. Earlier in the year a gun had been made from plastic parts and made some additional news when a version fired nine shots without falling apart. The evolution of the plastic gun is worth noting in that the first one reported was built from components printed with an $8,000 second-hand Stratasys Dimension SST 3D printer. And while it fired a shot successfully, the gun blew up on the second trial. The second gun, however, was made on a $1,725 Lulzbot A0-101 3D printer, that was available from Amazon, made by Aleph Objects and it survived firing nine rounds. For a variety of reasons the plastic gun contained some metal parts, but it marked the advent of this new technology. Prices for these replicator units are already down below $2,000 and they are limited, at present, to working with different types of thermoplastic. (But they can make, for example, shoes.)
The difference in being able to move to making parts from metal, particularly those that allow the repeated (over 600 times) firing of the gun is a very significant step forward. Thirty-four parts were made from stainless steel and Inconel 625 and then a grip was made from nylon, using a classic 1911 design.

Figure 2. The metal gun made by Solid Concepts (Solid Concepts )
It is the different metal part of this that is worth underlining. The components were made by laser-sintering (which simplistically means that they used a laser to melt tiny particles of metal so that they would fuse together to make the model). The machine that is used to do this, at the present time costs between $400,000 and $1,000,000. It also has power and other logistic needs that require it be run in a commercial, rather than residential environment.
But, as Sold Concepts notes:
Solid Concepts has been using metal sintering for some time now to successfully create parts for a wide array of products. The 1911 gun is well known and people can relate to it in respect to its power and need for precise components. This story is about how additive manufacturing can be used to produce real, accurate parts in your industry whether it’s aerospace, transportation, medical, energy, consumer products, etc.The changes that this will make in industrial manufacturing, and in the global market for materials cannot be underestimated. At present parts are generally made by subtraction, taking large billets of material and milling and machining away all the un-needed bits, producing large volumes of scrap chips. None of that waste will be generated with this new process.
Chris Hechtl has already produced The Wandering Engineer” series of Science Fiction books, starting with New Dawn that uses the concept widely as one of the bases for the stories. (Worth a read just to get some idea of the scope of what is to come - though I am also enjoying the series, as the books are written).
It is going to change the way in which components are built, but it will also change the way in which minerals are processed once they are mined from the earth. It will be no longer necessary to cast metals into large ingots and then forge them down into smaller shapes. It is likely that, for many items in the near future that process will still be cheaper, but as time progresses and the costs of the process reduce (bear in mind that this is laser-based and remember how those costs have come down as lasers have become ubiquitous in society) that even large parts may be better made this way. Further it allows intricate melding of different materials to make products that are stronger and better suited to the need.
Thus the objective of mineral processing in the years to come will be aimed at making fine powders rather than going through all the steps to make the larger ingots. That will, in turn, impact earlier stages of processing, and, while I don’t normally discuss my own work in these posts, I would draw your attention to a recent post from October 31st, down below, which includes a video of a small piece of equipment virtually instantly breaking half-inch coal into 5-micron pieces, which can be done with a pressure washer from the local hardware store. It also works in breaking out minerals from their host rock.
The world indeed will change, and with those changes the power requirements of the future are also going to undergo drastic revision.
Read more!
Thursday, January 17, 2013
OGPSS - Miles travelled, gas used and OPEC
Leanan has noted the API report of the continuing drop in US oil demand. It would be wrong, I believe, to explain this purely by reference to the increased efficiency of vehicles now on the road, nor would it be realistic to expect that these changing conditions will result in a lowering of gas prices.
To explain the rationale behind these thoughts requires reference to two sets of data. The most potent is the behavior of the Kingdom of Saudi Arabia (KSA), but before discussing their actions the story begins with the changes in the miles travelled reports that are issued by the Federal Highway Administration each month. Driven by a comment on recent versions of that plot, it is worth revisiting the summary of the rolling total of miles travelled in the United States, with the October 2012 plot being the last available.

Figure 1. 12 month rolling total of miles driven on all roads in the United States (FHWA) It should be noted that this is not the amount of fuel used, but rather the distance travelled, and thus in itself this does not reflect any changes in vehicle performance because of the increased efficiency of their engines. And while there does not appear to be any great difference between the numbers for 2011 and 2012 when broken down by month, for rural and urban travel, they both lie below the values for 2010.

Figure 2. Travel on US Urban Highways by Month (FHWA)

Figure 3. Travel on US Rural Highways by month (FHWA) This shows that folk are actually driving less than they have previously, which may be reflective of the current economic condition, when combined with the high price for gasoline in relative historic terms. One can compare these curves with the demand for gasoline from This Week in Petroleum., though this has data through the end of the year and has a slightly different lower scale range.

Figure 4, Demand for gasoline in the United States (EIA TWIP) Demand for gasoline, as with miles travelled, seems relatively equivalent for data for 2011 and 2012. The demand for ethanol, on the other hand, seems to be significantly less, assuming production matches that demand.

Figure 5. Production of fuel ethanol in the United States (EIA TWIP) OPEC take a keen interest in those activities in the United States that impact the demand for oil, and in their latest Monthly Oil Market Report (MOMR) have plotted the variation in oil price with miles driven:

Figure 6. US mileage plotted against the retail price of gasoline (OPEC January MOMR) Driven by increased demands for vehicular fuel OPEC anticipates continued growth in domestic demand for oil, both in the Middle East, and in Latin America.

Figure 7. Increase in domestic oil demand in the Middle East over 2012 and 2013. (OPEC January MOMR)

Figure 8. Anticipated growth in domestic demand in Latin America (OPEC MOMR) Both of these tables feed into and support the position that Westexas has discussed in regard to the drop in available exports of oil in the coming years. OPEC is not expecting to increase production in the coming year, but rather expecting that increase in demand will be met by production growth from the non-OPEC nations with numbers similar to those discussed earlier. And, as noted, most of that production growth is expected to come from America. The report confirms that OPEC, and particularly Saudi Arabia is willing to cut production, when demand falls, so that price levels are sustained. As in previous months the numbers showing production differ when the reports come from the countries themselves in contrast with reports from secondary sources.

Figure 9. OPEC crude production as reported directly. (OPEC MOMR ) There are significant drops in production reported for Iraq, Libya, Nigeria and Saudi Arabia so that the reported drop in production comes close to 1 mbd. There is not quite the same amount of sacrifice evident in the numbers from secondary sources.
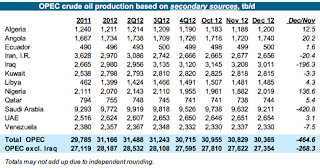
Figure 10. OPEC crude production as reported from secondary sources (OPEC MOMR ) Overall production is down only around 500 kbd, with almost all of that being a reduction from Saudi Arabia. The difference between the production numbers from Nigeria (they report cutting production 120 kbd while others report they have increased production 136 kbd) are perhaps indicative of some of the problems that exist within the OPEC organization when they try and balance the supply:demand equation. However, given that KSA is willing to do the heavy lifting it seems likely that prices will continue at their current levels, despite any changes in American production levels.

Figure 1. 12 month rolling total of miles driven on all roads in the United States (FHWA) It should be noted that this is not the amount of fuel used, but rather the distance travelled, and thus in itself this does not reflect any changes in vehicle performance because of the increased efficiency of their engines. And while there does not appear to be any great difference between the numbers for 2011 and 2012 when broken down by month, for rural and urban travel, they both lie below the values for 2010.

Figure 2. Travel on US Urban Highways by Month (FHWA)

Figure 3. Travel on US Rural Highways by month (FHWA) This shows that folk are actually driving less than they have previously, which may be reflective of the current economic condition, when combined with the high price for gasoline in relative historic terms. One can compare these curves with the demand for gasoline from This Week in Petroleum., though this has data through the end of the year and has a slightly different lower scale range.

Figure 4, Demand for gasoline in the United States (EIA TWIP) Demand for gasoline, as with miles travelled, seems relatively equivalent for data for 2011 and 2012. The demand for ethanol, on the other hand, seems to be significantly less, assuming production matches that demand.

Figure 5. Production of fuel ethanol in the United States (EIA TWIP) OPEC take a keen interest in those activities in the United States that impact the demand for oil, and in their latest Monthly Oil Market Report (MOMR) have plotted the variation in oil price with miles driven:

Figure 6. US mileage plotted against the retail price of gasoline (OPEC January MOMR) Driven by increased demands for vehicular fuel OPEC anticipates continued growth in domestic demand for oil, both in the Middle East, and in Latin America.

Figure 7. Increase in domestic oil demand in the Middle East over 2012 and 2013. (OPEC January MOMR)

Figure 8. Anticipated growth in domestic demand in Latin America (OPEC MOMR) Both of these tables feed into and support the position that Westexas has discussed in regard to the drop in available exports of oil in the coming years. OPEC is not expecting to increase production in the coming year, but rather expecting that increase in demand will be met by production growth from the non-OPEC nations with numbers similar to those discussed earlier. And, as noted, most of that production growth is expected to come from America. The report confirms that OPEC, and particularly Saudi Arabia is willing to cut production, when demand falls, so that price levels are sustained. As in previous months the numbers showing production differ when the reports come from the countries themselves in contrast with reports from secondary sources.

Figure 9. OPEC crude production as reported directly. (OPEC MOMR ) There are significant drops in production reported for Iraq, Libya, Nigeria and Saudi Arabia so that the reported drop in production comes close to 1 mbd. There is not quite the same amount of sacrifice evident in the numbers from secondary sources.

Figure 10. OPEC crude production as reported from secondary sources (OPEC MOMR ) Overall production is down only around 500 kbd, with almost all of that being a reduction from Saudi Arabia. The difference between the production numbers from Nigeria (they report cutting production 120 kbd while others report they have increased production 136 kbd) are perhaps indicative of some of the problems that exist within the OPEC organization when they try and balance the supply:demand equation. However, given that KSA is willing to do the heavy lifting it seems likely that prices will continue at their current levels, despite any changes in American production levels.
Read more!
Sunday, June 19, 2011
A Panel on Gas Prices and their Effect
I have been invited to join the discussion at the Focus Group tomorrow on the subject:
The Real Causes and Microeconomic Effects of High Gas Prices
For those interested you can attend the event via the above referenced website (click on the title) or go to the site and add a question of comment at any time.
Gail Tverberg and James Hamilton will be the other panelists with Scott Albro acting as Moderator, I believe. (I haven't done one of these before in this format, hence my slight lack of specificity).
The list of questions and discussion can be found by scrolling down from the title at the website.
Could be fun, it starts at 2 pm on the East Coast, 11 am on the West.
UPDATE, It was a good discussion and it flowed well, though I ended up disagreeing with the other two panelists on where gas prices will be at the end of the summer. The nice thing about that argument is that in three months we will know who was right. The mp3 file is now available to listen to at the site, and the transcript should be up in a few days.
The Real Causes and Microeconomic Effects of High Gas Prices
For those interested you can attend the event via the above referenced website (click on the title) or go to the site and add a question of comment at any time.
Gail Tverberg and James Hamilton will be the other panelists with Scott Albro acting as Moderator, I believe. (I haven't done one of these before in this format, hence my slight lack of specificity).
The list of questions and discussion can be found by scrolling down from the title at the website.
Could be fun, it starts at 2 pm on the East Coast, 11 am on the West.
UPDATE, It was a good discussion and it flowed well, though I ended up disagreeing with the other two panelists on where gas prices will be at the end of the summer. The nice thing about that argument is that in three months we will know who was right. The mp3 file is now available to listen to at the site, and the transcript should be up in a few days.
Read more!
Wednesday, April 13, 2011
Gas prices and oil supply in light of EIA and OPEC monthly reports
I paid $50 to fill my tank at a gas station in Maine this morning, at a cost of almost $4 a gallon. When the Actress muttered some comment of protest, I told her that she had better get used to the price, because it is hard to see any normal reason for a decline in that price in the near future.
The EIA TWIP today was discussing the transportation fuel market this summer, and begins by noting:
Their estimate, and the rationale for it are given in the new Short-term Energy and Summer Fuels Outlook with the price of West Texas Intermediate (WTI) at $112 (it has since fallen $5) . The EIA is expecting the market to tighten, based on the turmoil in the Middle East and North Africa, and “robust” growth of demand. But they only increase the anticipated average price of WTI to $106 this year, and $114 next. And in this I think that they are being rather too optimistic given the times. And that includes their estimate that the price of gasoline will still be below $4 (at $3.80 average) through the end of next year. (Though they do add a caveat that there is a 33% probability that prices could get over $4 on average this July).
And in an aside (since the topic today is mainly crude oil) it is worth noting relative to my post on the EIA World Gas Shale report that the EIA are projecting that the Henry Hub price for natural gas will remain around $4.10 per kcf in 2011 i.e. below the 2010 average, and it will only rise to $4.55 per kcf in 2012 – which doesn’t make those gas shale drilling balance sheets look any prettier.
The oil supply problem itself is sufficiently worrying. As with others they are still predicting a global increase in demand of 1.5 mbd this year, expecting that it will rise an additional 1.6 mbd in 2012. OPEC (whose daily barrel is currently at $117) expects that with the tragedy of the earthquake and tsunami in Japan, that there won’t be quite as much growth as previously expected, and thus are only anticipating a growth in demand of 1.4 mbd this year. As their April Monthly Oil Market Report notes, they do not expect countries outside of Japan to be affected, and thus they continue to anticipate a world economic growth of around 3.9%.
As I mentioned in an earlier post there were a number of Japanese refineries which were damaged, and the country which was refining about 4.5 mbd had an immediate drop to 3.1 mbd. That has now been partially restored as some refineries have increased production, and others have been repaired. However the country as a whole is still reported to be about 617 kbd short of the pre-earthquake figure. (And there are three coal-fired power plants Haramachi Tohoku, Kashima Ibaraki, and Hitachinaka Ibaraki that are still off-line and 9 of 210 hydro-electric plants were damaged. )
Nevertheless Middle Eastern suppliers stopped some of the shipments to Japan, and this may well be what is being seen as a short-term decline in demand. (OPEC saw a drop of around 0.5 mbd in tanker shipments in March). However OPEC anticipate that there will have to be substitution for the loss in Japanese nuclear power, since that cannot be restored or replaced with equivalent new nuclear power stations in less than several years. As a result they expect that the demand for oil as a replacement fuel (the loss could be made up by about 200 kbd of oil equivalent fuel) will increase later in the year.
OPEC expects that 0.6 mbd of the overall global increase in demand will be supplied by non-OPEC countries, with Brazil, the United States, Canada, Colombia and China increasing production, while the UK and Norway will show the greatest declines. That leaves the rest for them, and bearing in mind the loss from Libya, and other potential losses around MENA, though OPEC itself only expects to see demand for its oil increase about 0.4 mbd. (Which arithmetic doesn’t quite compute – but never mind – I am assuming that the rise of 0,4 mbd includes the offset to cover the losses in production within OPEC, and that with the 0.4 mbd OPEC increase, and the 0.6 mbd non-OPEC increase, that the world will only be 0.4 mbd short – which might come from NGL increases). Incidentally OPEC anticipates that Chinese demand will grow 0.5 mbd to 9.5 mbd.
There is an interesting comment in the OPEC report relating to the poor performance of natural gas prices (as I have been discussing).
The EIA TWIP today was discussing the transportation fuel market this summer, and begins by noting:
Regular-grade gasoline retail prices, which averaged $2.76 per gallon last summer, are projected to average $3.86 per gallon during the 2011 driving season. The monthly average gasoline price is expected to peak at about $3.91 per gallon by mid-summer. Diesel fuel prices, which averaged $2.98 per gallon last summer, are projected to average $4.09 per gallon this summer. Weekly and daily national average prices can differ significantly from monthly and seasonal averages, and there are also significant differences across regions, with monthly average prices in some areas exceeding the national average price by 25 cents per gallon or more.Well right now, before driving season starts, the price was $3.97 for regular – but the EIA have the “out” that this is after all Maine, which is at the end of the delivery line. Ah, well!! But I suspect that the EIA is still being a tad optimistic, and may regret that $0.25 error bar by the end of the season.
Their estimate, and the rationale for it are given in the new Short-term Energy and Summer Fuels Outlook with the price of West Texas Intermediate (WTI) at $112 (it has since fallen $5) . The EIA is expecting the market to tighten, based on the turmoil in the Middle East and North Africa, and “robust” growth of demand. But they only increase the anticipated average price of WTI to $106 this year, and $114 next. And in this I think that they are being rather too optimistic given the times. And that includes their estimate that the price of gasoline will still be below $4 (at $3.80 average) through the end of next year. (Though they do add a caveat that there is a 33% probability that prices could get over $4 on average this July).
And in an aside (since the topic today is mainly crude oil) it is worth noting relative to my post on the EIA World Gas Shale report that the EIA are projecting that the Henry Hub price for natural gas will remain around $4.10 per kcf in 2011 i.e. below the 2010 average, and it will only rise to $4.55 per kcf in 2012 – which doesn’t make those gas shale drilling balance sheets look any prettier.
The oil supply problem itself is sufficiently worrying. As with others they are still predicting a global increase in demand of 1.5 mbd this year, expecting that it will rise an additional 1.6 mbd in 2012. OPEC (whose daily barrel is currently at $117) expects that with the tragedy of the earthquake and tsunami in Japan, that there won’t be quite as much growth as previously expected, and thus are only anticipating a growth in demand of 1.4 mbd this year. As their April Monthly Oil Market Report notes, they do not expect countries outside of Japan to be affected, and thus they continue to anticipate a world economic growth of around 3.9%.
As I mentioned in an earlier post there were a number of Japanese refineries which were damaged, and the country which was refining about 4.5 mbd had an immediate drop to 3.1 mbd. That has now been partially restored as some refineries have increased production, and others have been repaired. However the country as a whole is still reported to be about 617 kbd short of the pre-earthquake figure. (And there are three coal-fired power plants Haramachi Tohoku, Kashima Ibaraki, and Hitachinaka Ibaraki that are still off-line and 9 of 210 hydro-electric plants were damaged. )
Nevertheless Middle Eastern suppliers stopped some of the shipments to Japan, and this may well be what is being seen as a short-term decline in demand. (OPEC saw a drop of around 0.5 mbd in tanker shipments in March). However OPEC anticipate that there will have to be substitution for the loss in Japanese nuclear power, since that cannot be restored or replaced with equivalent new nuclear power stations in less than several years. As a result they expect that the demand for oil as a replacement fuel (the loss could be made up by about 200 kbd of oil equivalent fuel) will increase later in the year.
OPEC expects that 0.6 mbd of the overall global increase in demand will be supplied by non-OPEC countries, with Brazil, the United States, Canada, Colombia and China increasing production, while the UK and Norway will show the greatest declines. That leaves the rest for them, and bearing in mind the loss from Libya, and other potential losses around MENA, though OPEC itself only expects to see demand for its oil increase about 0.4 mbd. (Which arithmetic doesn’t quite compute – but never mind – I am assuming that the rise of 0,4 mbd includes the offset to cover the losses in production within OPEC, and that with the 0.4 mbd OPEC increase, and the 0.6 mbd non-OPEC increase, that the world will only be 0.4 mbd short – which might come from NGL increases). Incidentally OPEC anticipates that Chinese demand will grow 0.5 mbd to 9.5 mbd.
There is an interesting comment in the OPEC report relating to the poor performance of natural gas prices (as I have been discussing).
Nevertheless, a sustained upward trend in HH natural gas prices may appear if there is a radical change in the US energy policy regarding nuclear production, which seems unlikely at present. According to Barclays, in order to rebalance the US natural gas market via higher demand, it would be necessary to shutter a large amount (13-26%) of total North American nuclear capacity.Well I have to confess that is one answer that I hadn’t thought of applying in order to get the shale drilling companies off the hook.
Read more!
Monday, July 26, 2010
Deepwater Oil Spill - Restarting Progress
BP does not seem to have gone back to the daily briefings, let alone the twice-a-day ones that were being issued just a couple of weeks ago. Admiral Allen has given permission for the top and bottom kill (through the relief well) activities to continue. The Admiral also noted that the riser for the RW has been reattached, and the reconnection, removal of the plugging packer, and cleaning of the well is in process. It is estimated that the intersection with the original well will now occur on the 7th August, with the final set of casing being run into the hole this week, and then, after cement injection, the well will WOC (wait on cement) while the cement hardens, and is then checked. In the meanwhile the undersea valve system is being modified to carry out the static kill that I discussed earlier. (And the leak monitoring has transferred to the BOA ROV 2, which is now showing four leaks.)
Once the flow channel to the well is restored, and the casing set and cemented in the relief well, then the Q4000 will carry mud from the HOS Centerline, driven by pumps on the Blue Dolphin into the riser, and down to the BOP to carry out the static kill. The Admiral currently expects that this will begin on August 2nd. He did note that the plan is still to inject cement into the top of the well, after the mud has killed any pressure differential between the bottom of the well and the reservoir, and thus also stabilized the well.
As the more immediate and visible problems reduce, with this path toward the final sealing of the well, and with future flows from it into the Gulf becoming less likely, the oil on the surface, and that migrating towards the shore is getting less. This will allow the Admiral to redeploy assets. For example it now appears that the risk of oil East of the Mississipi is declining, and that commercial fishing there may reopen before the end of the week, given that
We are now in the most intense driving season of the year, and this is evident, with traffic noticeably heavier on the roads in New England in recent days. SeaCoast Sunday noted in their paper edition on Sunday that occupancy rates in the York area of Southern Maine are over 90% during the week and at 100% on weekends. It is therefore not surprising that gas prices are on the rise, being on average 25 cents higher than this time last year.
We have been fortunate that the weather in the Gulf has not generated that much damage to the rigs and platforms yet this year, and those that were affected by Bonnie are now back in business. But the season is still young, and may yet remind us of our vulnerable dependence on oil.
Once the flow channel to the well is restored, and the casing set and cemented in the relief well, then the Q4000 will carry mud from the HOS Centerline, driven by pumps on the Blue Dolphin into the riser, and down to the BOP to carry out the static kill. The Admiral currently expects that this will begin on August 2nd. He did note that the plan is still to inject cement into the top of the well, after the mud has killed any pressure differential between the bottom of the well and the reservoir, and thus also stabilized the well.
As the more immediate and visible problems reduce, with this path toward the final sealing of the well, and with future flows from it into the Gulf becoming less likely, the oil on the surface, and that migrating towards the shore is getting less. This will allow the Admiral to redeploy assets. For example it now appears that the risk of oil East of the Mississipi is declining, and that commercial fishing there may reopen before the end of the week, given that
"We're 90 days into this, and I think the data speaks for itself," said Randy Pausina, assistant secretary for fisheries at the Department of Wildlife and Fisheries. "There's been no indication that any seafood is even remotely close to being at any level of concern. Find me the concern and prove it to me."Sport fishing has already been restarted.
We are now in the most intense driving season of the year, and this is evident, with traffic noticeably heavier on the roads in New England in recent days. SeaCoast Sunday noted in their paper edition on Sunday that occupancy rates in the York area of Southern Maine are over 90% during the week and at 100% on weekends. It is therefore not surprising that gas prices are on the rise, being on average 25 cents higher than this time last year.
We have been fortunate that the weather in the Gulf has not generated that much damage to the rigs and platforms yet this year, and those that were affected by Bonnie are now back in business. But the season is still young, and may yet remind us of our vulnerable dependence on oil.
Read more!
Wednesday, February 3, 2010
Gasoline, crude, supplies and miles travelled
This winter has been a little harder, in the sense of snow on the road, than some I have experienced in the past. Which may explain, to a degree, the drop in gasoline demand that the EIA is reporting has happened over the past month.
 Gasoline Demand (EIA )
If you look at this time last year the current curve seems to be tracking what happened back then, and the steady upward trend in demand that has occurred in the last two years as we move forward from this date will, I suspect, likely be repeated.
What is that going to do to gasoline prices, and with them the price of crude? Well prices have dropped back a little, bear in mind that it was this time last year that they bottomed out, and then there was a run-up until about August, which was the end of the summer driving season.
 Average gasoline prices (EIA)
We have had the same sort of pattern with crude prices (and the change since last February is why I consider recent drops as relative inconsequential). Domestic crude, after a steady rise since last August, has taken a little drop, and with imports also falling, the inputs into domestic refineries are around 900 kbd off last year’s numbers.
 Refinery inputs of crude (EIA)
There is still enough oil available through the market to cover an expected increase in demand over the short term, but I have a growing concern for supply on the summer of 2011.
Looking at traffic volumes, after a little hiccup in October, the numbers for November were more of a gain. The average traffic increased by 1.4%. While for the entire year through November traffic had risen by 0.3%. And this time all regions were showing an increase in traffic, although there was still a decline in urban traffic off the interstate.
 Monthly changes in miles driven for 2009 relative to 2008 (FHWA )
The hiccup does show up in the running 12-month total, which has flattened, at around the levels that we were at in 2004, when the curve was merrily climbing upwards.
 Cumulative miles driven through November 2009 (FHWA )
Given that car sales rose 6% last month (with the exception of Toyota) with some manufacturers showing double digit rises in sales over last year there is more promise for the economy in these numbers.
Saudi Arabia is maintaining higher levels of supply both to Asia and to Europe. And while Russia is still playing nice, as the Ukrainian election is on Sunday, and it still has a candidate or two in the race, it too has promised to keep supplies up to Western Europe. With the higher crude prices bringing a bit of stability back, perhaps we can get through this winter without any histrionics in that part of the world.
 Gasoline Demand (EIA )
 If you look at this time last year the current curve seems to be tracking what happened back then, and the steady upward trend in demand that has occurred in the last two years as we move forward from this date will, I suspect, likely be repeated.
What is that going to do to gasoline prices, and with them the price of crude? Well prices have dropped back a little, bear in mind that it was this time last year that they bottomed out, and then there was a run-up until about August, which was the end of the summer driving season.
 Average gasoline prices (EIA)
 We have had the same sort of pattern with crude prices (and the change since last February is why I consider recent drops as relative inconsequential). Domestic crude, after a steady rise since last August, has taken a little drop, and with imports also falling, the inputs into domestic refineries are around 900 kbd off last year’s numbers.
 Refinery inputs of crude (EIA)
 There is still enough oil available through the market to cover an expected increase in demand over the short term, but I have a growing concern for supply on the summer of 2011.
Looking at traffic volumes, after a little hiccup in October, the numbers for November were more of a gain. The average traffic increased by 1.4%. While for the entire year through November traffic had risen by 0.3%. And this time all regions were showing an increase in traffic, although there was still a decline in urban traffic off the interstate.
 Monthly changes in miles driven for 2009 relative to 2008 (FHWA )
 The hiccup does show up in the running 12-month total, which has flattened, at around the levels that we were at in 2004, when the curve was merrily climbing upwards.
 Cumulative miles driven through November 2009 (FHWA )
 Given that car sales rose 6% last month (with the exception of Toyota) with some manufacturers showing double digit rises in sales over last year there is more promise for the economy in these numbers.
Saudi Arabia is maintaining higher levels of supply both to Asia and to Europe. And while Russia is still playing nice, as the Ukrainian election is on Sunday, and it still has a candidate or two in the race, it too has promised to keep supplies up to Western Europe. With the higher crude prices bringing a bit of stability back, perhaps we can get through this winter without any histrionics in that part of the world.
Read more!
Thursday, December 3, 2009
Seasonality of Demand
Well, with Thanksgiving, and a slight problem in transportation that got us home a day late, it is belatedly time to catch up a little on the latest TWIP report . As we look at reports of weak demand for gasoline and rising stocks, it is important to remember the context within which they are being reported.
Consumption of gasoline is somewhat controlled by season, as is overall oil demand.
 Source EIA.
Demand therefore will normally decline in the winter months, and one can see this for the current gasoline demand plot:
 Source (EIA )
Demand peaked in August and will now decline until late in February. (Although when, back in that time earlier this year, I looked at these curves I was unable to see a pickup in driving until after April). Looking at how the FHWA record of driving is progressing this month (bearing in mind that the running 12-month total is some months behind current). Overall driving across the country was up 2.5% in September on a year-on-year comparison, and this month there was a gain in all regions of the country. (All but the North-East showing a gain of more than 2%).
 Vehicle miles driven reported for Sept 2009 (FHWA )
The changing demand for gasoline with the change in seasons, and the current drop is thus then reflected in the historic change in gasoline prices, which, when averaged from 1990 (taking the data from the EIA) gives:

This is just for regular gas (which is the first column in the table at the EIA that I have derived it from).
Prices have, on average, fallen to a minimum around the beginning of Christmas week, and peaked about the end of June (Morton Downey has a similar sort of chart in Oil 101 which shows that driving peaks at the beginning of August, on average, and is at a minimum in February.
If one looks at the last couple of years, from the EIA plot, one can see that there is, as with demand, a clear seasonality in price, which suggests that no-one should be unduly concerned over prices for the next two or three months, since they will likely fluctuate a little as a result of the normal fall in demand.
 Gas prices over the last two years (EIA )
It will be interesting to see, however, what starts to happen as demand picks up, as it normally does, somewhere in towards the end of February and then more strongly in May. Because I suspect that it will be about then that supply might become a little tighter.
We have the Saudi’s at the moment agreeing to hold supplies to the United States at a constant volume, while they previously agreed to increase sales to China as both countries work to cement ties, and while the production from Manifa (h/t Leanan) is pushed back to 2015. Whether this will have any overall impact on the global market will likely become more evident as we move into the summer of next year.
TWIP this week focused on the change in ownership of the refineries in the United States over the past decade. It is best illustrated with this table that they provided.

As you can see, even though there are no new refineries, by improving capacity within existing plant, overall production numbers have increased. The footnote however recognizes the recent closing of the Delaware City refinery and the loss of 210,000 bd of refining capacity.
Consumption of gasoline is somewhat controlled by season, as is overall oil demand.
 Source EIA.
Demand therefore will normally decline in the winter months, and one can see this for the current gasoline demand plot:
 Source (EIA )
 Demand peaked in August and will now decline until late in February. (Although when, back in that time earlier this year, I looked at these curves I was unable to see a pickup in driving until after April). Looking at how the FHWA record of driving is progressing this month (bearing in mind that the running 12-month total is some months behind current). Overall driving across the country was up 2.5% in September on a year-on-year comparison, and this month there was a gain in all regions of the country. (All but the North-East showing a gain of more than 2%).
 Vehicle miles driven reported for Sept 2009 (FHWA )
 The changing demand for gasoline with the change in seasons, and the current drop is thus then reflected in the historic change in gasoline prices, which, when averaged from 1990 (taking the data from the EIA) gives:

This is just for regular gas (which is the first column in the table at the EIA that I have derived it from).
Prices have, on average, fallen to a minimum around the beginning of Christmas week, and peaked about the end of June (Morton Downey has a similar sort of chart in Oil 101 which shows that driving peaks at the beginning of August, on average, and is at a minimum in February.
If one looks at the last couple of years, from the EIA plot, one can see that there is, as with demand, a clear seasonality in price, which suggests that no-one should be unduly concerned over prices for the next two or three months, since they will likely fluctuate a little as a result of the normal fall in demand.
 Gas prices over the last two years (EIA )
 It will be interesting to see, however, what starts to happen as demand picks up, as it normally does, somewhere in towards the end of February and then more strongly in May. Because I suspect that it will be about then that supply might become a little tighter.
We have the Saudi’s at the moment agreeing to hold supplies to the United States at a constant volume, while they previously agreed to increase sales to China as both countries work to cement ties, and while the production from Manifa (h/t Leanan) is pushed back to 2015. Whether this will have any overall impact on the global market will likely become more evident as we move into the summer of next year.
TWIP this week focused on the change in ownership of the refineries in the United States over the past decade. It is best illustrated with this table that they provided.

As you can see, even though there are no new refineries, by improving capacity within existing plant, overall production numbers have increased. The footnote however recognizes the recent closing of the Delaware City refinery and the loss of 210,000 bd of refining capacity.
Read more!
Monday, September 7, 2009
Natural Gas versus Coal - perhaps the UK experience revisited?
Back when North Sea oil and gas were discovered the British Coal Industry was a powerhouse in the land. Coal gas was used for domestic cooking, with the fuel generated by large gas works that dotted the landscape. Skip forward a little, and there was a massive campaign to convert the burners that had used coal gas over to a smaller size that allowed them to burn the natural gas becoming available from the North Sea. And with oil and natural gas coming ashore in increasing quantities the British coal industry rapidly faded from its peak to a fainter shadow of energy production, and coal gas became a historical item.
Coal gas is formed by the partial combustion of coal, natural gas (NG), on the other hand, occurs as a hazard in most coal mines. As the coal is mined the pressure comes off the coal, or it is fragmented, and the natural gas can escape. Once it reaches a certain concentration in the air it becomes explosive, and a heat source (a metal pick rubbing on sandstone for example) can ignite it, causing ignition of the gas, with a consequent disaster as those in the mine vicinity can be killed. Thus there are many precautions (which I will describe at another time) to stop that ignition, or to stop the flame from spreading very far.
But the natural gas can also be collected, and if it is collected in a purer form than that diluted by the ventilation currents of the working mine, it becomes a valuable resource, which the British miners now use to help power the mining process itself.
However the folks at Chesapeake are now starting to face off against those of Peabody to try and influence the Senate version of Waxman-Markey. And the debate brings renewable energies into the picture, not necessarily to NG’s advantage. (Which is a little odd given that NG plants are generally considered the back-up power when the wind don’t blow or the sun don’t shine).
Now the U.S. currently has a glut of natural gas. As a result futures have fallen to $2.508 per million Btu (give or take equal to 1 kcf). This has to start hurting some of the producers since, inter alia, Chesapeake has noted that it is costing them around $4.44 million to drill new wells in the Marcellus, a field in which they anticipate being the biggest player. The company is still very positive about that development – but notice the long-term price they are expecting to justify that optimism:
Perhaps he, like so many others, realizes that as soon as the glut goes away, and the short-lived nature of the gas shale wells being what it is, that will likely happen within the year, then the price will go back up, and it will become less economic than the current coal contract.
Hence the desire of the natural gas companies to get a little more assistance from Congress in the struggle for the future.
It depends on how well they sell, and how well the coal companies manage to resist. All tied up with the debate about climate change, which seems to be less certain with recent publications (in New Scientist among other places) suggesting that the globe may cool for a while before reheating, this could be an interesting debate. And perhaps one with less certain an outcome than the British experience.
Coal gas is formed by the partial combustion of coal, natural gas (NG), on the other hand, occurs as a hazard in most coal mines. As the coal is mined the pressure comes off the coal, or it is fragmented, and the natural gas can escape. Once it reaches a certain concentration in the air it becomes explosive, and a heat source (a metal pick rubbing on sandstone for example) can ignite it, causing ignition of the gas, with a consequent disaster as those in the mine vicinity can be killed. Thus there are many precautions (which I will describe at another time) to stop that ignition, or to stop the flame from spreading very far.
But the natural gas can also be collected, and if it is collected in a purer form than that diluted by the ventilation currents of the working mine, it becomes a valuable resource, which the British miners now use to help power the mining process itself.
Sixteen generators are installed across 5 deep mine sites. These embedded generating sets are fuelled exclusively on mines gas. Some of the electricity generated is used at UK COAL sites representing a substantial energy cost saving.However this harmonious use of the fuel projects a different attitude than that which existed as the National Coal Board died. And now that same struggle may be gearing up for a rematch in the United States, as the growing surplus of natural gas leads industry leaders to press Congress about forcing coal’s replacement with NG as part of the new Clean Energy Initiative. So far it hasn’t worked.
For all its pronouncements that gas could be used to replace aging, inefficient coal-fired power plants — and reduce greenhouse gas emissions in the process — lawmakers from coal-producing states appear committed to keeping coal as the nation’s primary producer of power.
However the folks at Chesapeake are now starting to face off against those of Peabody to try and influence the Senate version of Waxman-Markey. And the debate brings renewable energies into the picture, not necessarily to NG’s advantage. (Which is a little odd given that NG plants are generally considered the back-up power when the wind don’t blow or the sun don’t shine).
“By allowing free emission allowances to maintain coal production from existing coal plants, while providing mandates that there be more wind and solar, you squeeze gas out in the middle,” said William F. Whitsitt, an executive vice president at Devon Energy, a major natural gas producer.This is not really something that it easily fixed in the marketplace, since the return on investment needed for the construction of a major power plant requires that there be a sustained market for the power produced, and concurrently a reliable cost-effective source of the fuel that will be required to generate the electricity for a significant portion of the plant lifetime.
Now the U.S. currently has a glut of natural gas. As a result futures have fallen to $2.508 per million Btu (give or take equal to 1 kcf). This has to start hurting some of the producers since, inter alia, Chesapeake has noted that it is costing them around $4.44 million to drill new wells in the Marcellus, a field in which they anticipate being the biggest player. The company is still very positive about that development – but notice the long-term price they are expecting to justify that optimism:
Based on drilling results by Chesapeake and others in the industry, the company has recently increased its targeted average EUR in the Marcellus from 3.75 bcfe per well to 4.2 bcfe per well. Assuming flat NYMEX natural gas prices of $7.00 per kcf (compared to a recent 10-year NYMEX strip price of approximately $7.02 per kcf), the company’s estimated pre-tax rate of return from a 4.2 bcfe horizontal Marcellus well drilled for $4.5 million is approximately 71% excluding the benefit of drilling carries and more than 1,000% including the benefit of drilling carries.Back in March Chesapeake was reducing its production from the Haynesville shale however, back then they were also predicting that the drop in drilling activity would produce results before the end of the year.
During March 2009, most Mid-Continent natural gas prices at major interstate pipeline delivery points will average around $2.70 per thousand cubic feet, a price at which most natural gas production is unprofitable. We believe low wellhead prices combined with constrained capital availability will likely cause U.S. drilling activity to decline well beyond the 40% drop already seen since August 2008. As a result, U.S. natural gas production will begin to dramatically decline before the end of 2009 and consequently natural gas markets will regain better supply/demand balance by the end of 2009, if not sooner.Given the continued excess in the marketplace, it would be nice if the NG industry could find a reliable market of greater size in power generation. They have already managed to corner around 25% of that market – but as yet have not managed to convince folk, such as the manager of our local power plant (which is already constructed to burn natural gas, but which blanked off the nozzles) to switch back.
Perhaps he, like so many others, realizes that as soon as the glut goes away, and the short-lived nature of the gas shale wells being what it is, that will likely happen within the year, then the price will go back up, and it will become less economic than the current coal contract.
Hence the desire of the natural gas companies to get a little more assistance from Congress in the struggle for the future.
It depends on how well they sell, and how well the coal companies manage to resist. All tied up with the debate about climate change, which seems to be less certain with recent publications (in New Scientist among other places) suggesting that the globe may cool for a while before reheating, this could be an interesting debate. And perhaps one with less certain an outcome than the British experience.
Read more!
Thursday, July 30, 2009
Oil up, gas down, and Hurricane season is here
I had meant to include the weekly plot of gasoline demand in the last post, that began by talking about the hybrid, but somehow the post drifted into a different direction and I ended up not including it. The graph, from this week’s TWIP, showed that gasoline demand is really remaining fairly constant at a rate slightly above last year(and in about the same relatively flat condition), though you might want to recognize the significant difference in price. This time last year was about the time that price peaked.
 Gas demand over the past year (EIA TWIP)
 Gas prices over the last two years (EIA TWIP)
The question on where it goes from here does depend on the way the global economy goes, though as you gather, in the case of gasoline, with the spread between supply and demand now controlled by OPEC, I expect that there will be a slow but steady increase.
Natural gas, on the other hand is another story. The Natural Gas Weekly (NGW) report is out today, and shows the slow but apparently inexorable decline in prices is continuing.
 Natural gas prices against oil prices (EIA Natural Gas Weekly)
This steady decline in gas prices, which may well continue if there is the influx of LNG at year end, has the potential to significantly hurt the developing production of natural gas from the gas shales. As I previously noted, Chesapeake may well be able to produce from these formations at less than$4 a tcf, but once the price gets down to $3 or so, then I suspect that those bets are off.
The NGW is not very comforting in that regard, noting that
That difference with prediction is also evident from the subject of the TWIP front page this week, which dealt with the amount of oil from the Gulf of Mexico (GOM) that gets shut in each season due to hurricanes.
 Impact of Hurricanes on GOM production (EIA TWIP)
The slow decline in overall production is partly because of the loss of smaller and older producers following recent major hurricanes – production too small to justify the redrilling of wells, and also it is because the fields near the coast are well defined and exploited, and are in overall decline. But the risks from hurricanes are clear, when the platform locations are examined.
 6357 oil platform locations in the GOM
The question that the TWIP asks relates to the likelihood of there being strong and frequent hurricanes through the platform-intense regions this season. So far, with the cooler relative sea temperatures there has not been the activity of more damaging years, but the TWIP quotes NOAA as predicting a slightly higher than normal season, with a consequent transient outage of 4.5 million barrels over the season. However the recent identification of this as being an “El Nino” year may change that prediction, though we won’t know until next week, August 6th to be precise.
Whether storms are increasing in severity has been a subject of debate, following such a prediction in “An Inconvenient Truth” , but the data apparently does not show that there has been an increase in storm energy but rather the reverse.
 Historic trends in Cyclone Energy (Ryan Maue )
And, as far as oil and gas production from the Gulf is concerned it is only going to take one strong hurricane with the wrong path and, as historic experience has shown, production can be really impacted. (It took years to get the Thunder Horse platform back into commission after it was damaged by Hurricane Dennis in 2005, and the 250,000 bd of oil and 200 mcf of gas production temporarily lost).
The season is yet young, and we’ll just have to wait to see what transpires.
 Gas demand over the past year (EIA TWIP)
  Gas prices over the last two years (EIA TWIP)
The question on where it goes from here does depend on the way the global economy goes, though as you gather, in the case of gasoline, with the spread between supply and demand now controlled by OPEC, I expect that there will be a slow but steady increase.
Natural gas, on the other hand is another story. The Natural Gas Weekly (NGW) report is out today, and shows the slow but apparently inexorable decline in prices is continuing.
 Natural gas prices against oil prices (EIA Natural Gas Weekly)
 This steady decline in gas prices, which may well continue if there is the influx of LNG at year end, has the potential to significantly hurt the developing production of natural gas from the gas shales. As I previously noted, Chesapeake may well be able to produce from these formations at less than$4 a tcf, but once the price gets down to $3 or so, then I suspect that those bets are off.
The NGW is not very comforting in that regard, noting that
At $3.41 per MMBtu on Wednesday, July 29, prices at Henry Hub were $9.17 per MMBtu, or 63 percent, below last year’s level at this time. Current spot prices at market locations in the lower 48 States average about 62 percent below year-ago levels.As a result there has been a further increase in storage injection, significantly above the 5-year average figures. The NGW blames this on the unseasonably cool temperatures:
Relatively mild temperatures in each of the Census Divisions in the lower 48 States during the week ended July 23, 2009, likely contributed to the above-normal level of injections into storage. Based on the National Weather Service’s degree-day data, temperatures in the Lower 48 States during the week were, on average, more than 2 degrees cooler than normal and 4 degrees cooler than last year’s levels.Whether this has anything to do with the lack of sunspots, and the consequent slight drop in received sunlight is a topic for another day. (If the colder weather continues into the winter, then the drop in demand for air conditioning may be compensated by the increased need for heat). Though the stubborn refusal of the global temperature to follow the steadily increasing curve that has been predicted by the AGW models is becoming remarkable.
That difference with prediction is also evident from the subject of the TWIP front page this week, which dealt with the amount of oil from the Gulf of Mexico (GOM) that gets shut in each season due to hurricanes.
 Impact of Hurricanes on GOM production (EIA TWIP)
 The slow decline in overall production is partly because of the loss of smaller and older producers following recent major hurricanes – production too small to justify the redrilling of wells, and also it is because the fields near the coast are well defined and exploited, and are in overall decline. But the risks from hurricanes are clear, when the platform locations are examined.
 6357 oil platform locations in the GOM
 The question that the TWIP asks relates to the likelihood of there being strong and frequent hurricanes through the platform-intense regions this season. So far, with the cooler relative sea temperatures there has not been the activity of more damaging years, but the TWIP quotes NOAA as predicting a slightly higher than normal season, with a consequent transient outage of 4.5 million barrels over the season. However the recent identification of this as being an “El Nino” year may change that prediction, though we won’t know until next week, August 6th to be precise.
Whether storms are increasing in severity has been a subject of debate, following such a prediction in “An Inconvenient Truth” , but the data apparently does not show that there has been an increase in storm energy but rather the reverse.
 Historic trends in Cyclone Energy (Ryan Maue )
 And, as far as oil and gas production from the Gulf is concerned it is only going to take one strong hurricane with the wrong path and, as historic experience has shown, production can be really impacted. (It took years to get the Thunder Horse platform back into commission after it was damaged by Hurricane Dennis in 2005, and the 250,000 bd of oil and 200 mcf of gas production temporarily lost).
The season is yet young, and we’ll just have to wait to see what transpires.
Read more!
Subscribe to:
Posts (Atom)

 Posts
Posts


