Showing posts with label Venezuela. Show all posts
Sunday, September 15, 2013
Tech Talk - changes in South American exports
One of the large concerns that came up repeatedly over the years of discussions, both of the articles and of Drumbeat at The Oil Drum (TOD) was the subject of growth in domestic demand from some of the larger suppliers of oil and natural gas. This growth would be to the cost of the export market, and will, therefore, over time, reduce the amount available to importing nations. This becomes an even more painful reality to the rest of the world when the projections about future performance turn out to have been overly ambitious. Consider the countries of Latin America, where, back in 2010, the EIA drew the following baseline:
Figure 1. The largest producers of liquid fuels in South America in 2010 (EIA )
The EIA anticipated that Brazilian production would reach 2.8 mbd in 2012, and 3.0 mbd this year. However, as the latest MOMR from OPEC notes, Brazil will likely produce only 2.61 mbd this year, with the potential to rise to 2.67 mbd by the end of the year. However the rise in domestic consumption, and the failure to achieve the production goals expected has had an impact on the exports to the United States.
Figure 2. The changing volumes of US imports from Brazil (EIA )
The EIA reported that Venezuela produced some 2.47 million barrels a day in 2011, of which the USA imported roughly 1 mbd. That volume has, however, been declining for some time. (Note that in the plot below the Virgin Island imports should perhaps be included, because the crude that runs through the refineries on the islands originates in Venezuela, but they are not in this plot). At the same time a significant proportion (250 kbd in 2010) is now being shipped from Venezuela to China.
Figure 3. The changing picture of US imports from Venezuela over the years (EIA )
The situation in Argentina similarly shows that as with the other countries internal consumption is rising, while in this case overall production is falling and there is a consequent impact on exports.
Figure 4. The oil balance in Argentina (EIA )
China has been getting around 20% of Argentinian exports, while, in 2011, the USA got 40%, but the volumes of US imports have now turned negative.
Figure 5. The changing picture of oil imports to the USA from Argentina (EIA )
Of the five countries that were tabulated at the top of the post, Colombia is the exception. Production is still rising significantly, however it should be noted that, back in 2010 when the USA received some 422 kbd of crude and refined products from the country, China was financing a pipeline to carry 600 kbd to the Colombian Pacific Coast.
Figure 6. The increase in oil production with little increase in domestic production in Colombia (EIA )
The oil for the pipeline is anticipated to come from both Venezuela and Colombia, and the preliminary agreement for its construction was signed in May, 2012. Venezuelan agreement is still lacking to the deal and Venezuela, which was supposed by now to be sending natural gas to Colombia (after having received supplies for years) has still not made the switch. Volumes of exports to the USA from Colombia have fluctuated recently, while India and China have been acquiring oil wells and their production, which then ships to Asia.
Figure 7. The changing picture of oil exports to the USA from Colombia (EIA).
And that leaves Ecuador., which for those who might have forgotten, is also a member of OPEC. (It rejoined in 2007 ) It produces around 500 kbd, and with internal consumption running at around 200 kbd, exports the rest.
Figure 8. The changing picture of oil exports to the USA from Ecuador (EIA )
The recent news that the President of Ecuador is opening the rain forest to oil development, after trying to find funds for preservation of the forest without it and failing. Ecuador has an increasing debt with China (about $20 billion) and this is forcing it to use oil exports as a way of servicing that debt. One $2 billion loan, for example, carries a return agreement for some 130 million barrels of oil over six-years (60 kbd). Part of the loan from China will be spent on refineries in country.
The point to note in all five cases is that the imports to the United States have been declining. Given the increase in US domestic production that is not wholly surprising, nor is there yet any immediate cause for concern. But it is what is happening to whatever excess that these countries produce, over that consumed domestically and in the US that is significant. Because, increasingly it is going to China, and to Asia in general.
The concern that this raises is that, should US production not continue to rise at the rates that the more cornucopian of the main stream commentators suggest, then there will come a time when the US will have to go back to its suppliers from the last decade to ask for more. And at that time the odds are going to be high that either the countries won’t be able to meet the demand because their own domestic consumption has consumed the surplus, or that the surplus has been sold to China.
Given that China is making investments at the moment in the South American oil infrastructure, from wells to pipelines, means that it will control this production, and that removes a significant source of supply, at a time when it will be needed.
Figure 1. The largest producers of liquid fuels in South America in 2010 (EIA )
The EIA anticipated that Brazilian production would reach 2.8 mbd in 2012, and 3.0 mbd this year. However, as the latest MOMR from OPEC notes, Brazil will likely produce only 2.61 mbd this year, with the potential to rise to 2.67 mbd by the end of the year. However the rise in domestic consumption, and the failure to achieve the production goals expected has had an impact on the exports to the United States.
Figure 2. The changing volumes of US imports from Brazil (EIA )
The EIA reported that Venezuela produced some 2.47 million barrels a day in 2011, of which the USA imported roughly 1 mbd. That volume has, however, been declining for some time. (Note that in the plot below the Virgin Island imports should perhaps be included, because the crude that runs through the refineries on the islands originates in Venezuela, but they are not in this plot). At the same time a significant proportion (250 kbd in 2010) is now being shipped from Venezuela to China.
Figure 3. The changing picture of US imports from Venezuela over the years (EIA )
The situation in Argentina similarly shows that as with the other countries internal consumption is rising, while in this case overall production is falling and there is a consequent impact on exports.
Figure 4. The oil balance in Argentina (EIA )
China has been getting around 20% of Argentinian exports, while, in 2011, the USA got 40%, but the volumes of US imports have now turned negative.
Figure 5. The changing picture of oil imports to the USA from Argentina (EIA )
Of the five countries that were tabulated at the top of the post, Colombia is the exception. Production is still rising significantly, however it should be noted that, back in 2010 when the USA received some 422 kbd of crude and refined products from the country, China was financing a pipeline to carry 600 kbd to the Colombian Pacific Coast.
Figure 6. The increase in oil production with little increase in domestic production in Colombia (EIA )
The oil for the pipeline is anticipated to come from both Venezuela and Colombia, and the preliminary agreement for its construction was signed in May, 2012. Venezuelan agreement is still lacking to the deal and Venezuela, which was supposed by now to be sending natural gas to Colombia (after having received supplies for years) has still not made the switch. Volumes of exports to the USA from Colombia have fluctuated recently, while India and China have been acquiring oil wells and their production, which then ships to Asia.
Figure 7. The changing picture of oil exports to the USA from Colombia (EIA).
And that leaves Ecuador., which for those who might have forgotten, is also a member of OPEC. (It rejoined in 2007 ) It produces around 500 kbd, and with internal consumption running at around 200 kbd, exports the rest.
Figure 8. The changing picture of oil exports to the USA from Ecuador (EIA )
The recent news that the President of Ecuador is opening the rain forest to oil development, after trying to find funds for preservation of the forest without it and failing. Ecuador has an increasing debt with China (about $20 billion) and this is forcing it to use oil exports as a way of servicing that debt. One $2 billion loan, for example, carries a return agreement for some 130 million barrels of oil over six-years (60 kbd). Part of the loan from China will be spent on refineries in country.
The point to note in all five cases is that the imports to the United States have been declining. Given the increase in US domestic production that is not wholly surprising, nor is there yet any immediate cause for concern. But it is what is happening to whatever excess that these countries produce, over that consumed domestically and in the US that is significant. Because, increasingly it is going to China, and to Asia in general.
The concern that this raises is that, should US production not continue to rise at the rates that the more cornucopian of the main stream commentators suggest, then there will come a time when the US will have to go back to its suppliers from the last decade to ask for more. And at that time the odds are going to be high that either the countries won’t be able to meet the demand because their own domestic consumption has consumed the surplus, or that the surplus has been sold to China.
Given that China is making investments at the moment in the South American oil infrastructure, from wells to pipelines, means that it will control this production, and that removes a significant source of supply, at a time when it will be needed.
Read more!
Labels:
Argentina,
Brazil,
China,
Colombia,
domestic consumption,
Ecuador,
Export Land Model,
US oil imports,
Venezuela
Friday, March 8, 2013
OGPSS - Venezuela after Hugo Chavez
With the death of the Venezuelan President Hugo Chavez the future production, and exports of Venezuelan crude are gaining a little new attention. I had noted in the last post that there is a difference of around 400 kbd between the 2.379 mbd that outside observers report to OPEC that the country is producing, and the 2.768 mbd that Venezuela itself reported. The question now becomes one as to whether the new President will be able to resurrect an industry that has overseen a slow decline in overall production, with a more rapid decline in exports.

Figure 1. Venezuelan oil statistics (Energy Export Databrowser)
My short answer to that question is No! It is based on a number of reasons, and may be swamped by the voices that note that the country has a vast remaining pool of oil in the Orinoco Basin, that the USGS has estimated to be more than a trillion barrels in size, of which some 513 billion barrels are technically recoverable. But there have been a number of posts about those numbers and the more critical number which is that of the rate of oil production.
Colin Campbell reminded us in his 2006 Review of the country that the Venezuelan Government was one of those urging the creation of OPEC, back in 1960. Back when that piece was written Colin expected that production, which had been falling as the reserves in the Lake Maracaibo region declined, would start to wind back up, as the heavy and extra heavy oils of the Orinoco were brought into a higher level of production. And he anticipated that, by now, the country would be producing around 3 mbd, which it is not.
One of the requirements before one can market the heavy oil is to have refineries that can process the oil. The United States, which imports around 1 mbd of Venezuelan crude, has the Citgo refineries, which are wholly owned by PDVSA (the Venezuelan oil company). Whether that will influence their switch to Canadian crude if the Keystone pipeline is put in place is an open question. But easing the American demand might help with Venezuelan relations with China.

Figure 2. US Monthly imports of crude and Petroleum Products from Venezuela (EIA )
China, which has refineries that Sinopec built that can also handle the crude, has stepped in here and spent over $40 billion with much of this in loans to be repaid through increased oil exports. Back in 2007 China had made the decision to pull out of Canada, and to concentrate its investments in Venezuela instead. Since that time they loaned Venezuela over $20 billion, in return for a commitment for oil exports that were to reach 1 mbd in 2012. The date to reach that target has now slipped to 2015 as overallproduction has continued to decline.
Last August President Chavez announced a $130 billion plan for investment in the Orinoco.
Last September two joint ventures came on stream. That at Petromiranda, where PDVSA has Russian partners began producing 1,500 bd, after an investment of $800 million, with a goal of eventually reaching 45,000 bd. At the same time Petromacareo, where PDVSA is partnering with the Vietnamese, came on line at 800 bd, with an initial target production of 4,000 bd. (The project has slipped from a target start date of early 2011, and the ultimate goal of 200 kbd from Petrimacareo is in more doubt.)
The crude has to be upgraded, and TNK-BP is partnering to double the capacity of the Petromangas upgrader from 120 to 250 kbd. Until that capacity is increased Orinoco production may be limited.
There is thus a history of project slippage and missed targets that is unlikely to improve in the short term. New plans for further investment either by the Chinese, Indians or Russia are now on hold, while the Presidential election to replace President Chavez is decided, but the experience in the last couple of years is likely indicative that progress in increasing production will be difficult to achieve and when set against a rising domestic consumption (as the Export Land Model predicted) is already leading to a fall in exports.
One of the drivers for that increase in domestic consumption is that the price of gasoline in Venezuela is $0.04 per gallon (four cents). In contrast, in Saudi Arabia it is around $0.61. The low price of gas means that there has been a significant increase in demand, exceeding that domestically available. As a result the country has been importing gas at up to $100 a barrel to sell it for $5 – you can’t balance those books by increasing the volume of sales!!
Yet cutting back on domestic consumption, or increasing prices could prove difficult for the incoming President. So maybe it would be a good idea to invest in the Keystone pipeline, as a simple precaution??

Figure 1. Venezuelan oil statistics (Energy Export Databrowser)
My short answer to that question is No! It is based on a number of reasons, and may be swamped by the voices that note that the country has a vast remaining pool of oil in the Orinoco Basin, that the USGS has estimated to be more than a trillion barrels in size, of which some 513 billion barrels are technically recoverable. But there have been a number of posts about those numbers and the more critical number which is that of the rate of oil production.
Colin Campbell reminded us in his 2006 Review of the country that the Venezuelan Government was one of those urging the creation of OPEC, back in 1960. Back when that piece was written Colin expected that production, which had been falling as the reserves in the Lake Maracaibo region declined, would start to wind back up, as the heavy and extra heavy oils of the Orinoco were brought into a higher level of production. And he anticipated that, by now, the country would be producing around 3 mbd, which it is not.
One of the requirements before one can market the heavy oil is to have refineries that can process the oil. The United States, which imports around 1 mbd of Venezuelan crude, has the Citgo refineries, which are wholly owned by PDVSA (the Venezuelan oil company). Whether that will influence their switch to Canadian crude if the Keystone pipeline is put in place is an open question. But easing the American demand might help with Venezuelan relations with China.

Figure 2. US Monthly imports of crude and Petroleum Products from Venezuela (EIA )
China, which has refineries that Sinopec built that can also handle the crude, has stepped in here and spent over $40 billion with much of this in loans to be repaid through increased oil exports. Back in 2007 China had made the decision to pull out of Canada, and to concentrate its investments in Venezuela instead. Since that time they loaned Venezuela over $20 billion, in return for a commitment for oil exports that were to reach 1 mbd in 2012. The date to reach that target has now slipped to 2015 as overallproduction has continued to decline.
Last August President Chavez announced a $130 billion plan for investment in the Orinoco.
He said that there are 150 different clusters of oil wells in the Belt, but the goal in the next six years is to increase that number to 500. Before the nationalization of the Belt, there were just 37 clusters.Because the Orinoco crude is very heavy, to an API gravity of 9 degrees, it is difficult to produce and requires a considerable energy investment to extract and process the crude.
The clusters are comprised of 24 separate oil wells, each of which extract around 1,200 barrels per day. At these facilities, hydrocarbons are extracted using 45-meter drills purchased in Venezuela and assembled in Venezuela.
“All this has been nationalized, which before was the property of multinationals, and production has also been increased,” the president said. He recalled that before the government took control of the Belt, there were just 2,800 wells, while now there are more than 4,000.
Last September two joint ventures came on stream. That at Petromiranda, where PDVSA has Russian partners began producing 1,500 bd, after an investment of $800 million, with a goal of eventually reaching 45,000 bd. At the same time Petromacareo, where PDVSA is partnering with the Vietnamese, came on line at 800 bd, with an initial target production of 4,000 bd. (The project has slipped from a target start date of early 2011, and the ultimate goal of 200 kbd from Petrimacareo is in more doubt.)
The crude has to be upgraded, and TNK-BP is partnering to double the capacity of the Petromangas upgrader from 120 to 250 kbd. Until that capacity is increased Orinoco production may be limited.
There is thus a history of project slippage and missed targets that is unlikely to improve in the short term. New plans for further investment either by the Chinese, Indians or Russia are now on hold, while the Presidential election to replace President Chavez is decided, but the experience in the last couple of years is likely indicative that progress in increasing production will be difficult to achieve and when set against a rising domestic consumption (as the Export Land Model predicted) is already leading to a fall in exports.
One of the drivers for that increase in domestic consumption is that the price of gasoline in Venezuela is $0.04 per gallon (four cents). In contrast, in Saudi Arabia it is around $0.61. The low price of gas means that there has been a significant increase in demand, exceeding that domestically available. As a result the country has been importing gas at up to $100 a barrel to sell it for $5 – you can’t balance those books by increasing the volume of sales!!
Yet cutting back on domestic consumption, or increasing prices could prove difficult for the incoming President. So maybe it would be a good idea to invest in the Keystone pipeline, as a simple precaution??
Read more!
Labels:
China,
heavy crude,
Keystone XL,
Orinoco Basin,
Russia,
upgrader,
Venezuela,
Vietnam
Thursday, January 17, 2013
OGPSS - Miles travelled, gas used and OPEC
Leanan has noted the API report of the continuing drop in US oil demand. It would be wrong, I believe, to explain this purely by reference to the increased efficiency of vehicles now on the road, nor would it be realistic to expect that these changing conditions will result in a lowering of gas prices.
To explain the rationale behind these thoughts requires reference to two sets of data. The most potent is the behavior of the Kingdom of Saudi Arabia (KSA), but before discussing their actions the story begins with the changes in the miles travelled reports that are issued by the Federal Highway Administration each month. Driven by a comment on recent versions of that plot, it is worth revisiting the summary of the rolling total of miles travelled in the United States, with the October 2012 plot being the last available.
Figure 1. 12 month rolling total of miles driven on all roads in the United States (FHWA) It should be noted that this is not the amount of fuel used, but rather the distance travelled, and thus in itself this does not reflect any changes in vehicle performance because of the increased efficiency of their engines. And while there does not appear to be any great difference between the numbers for 2011 and 2012 when broken down by month, for rural and urban travel, they both lie below the values for 2010.
Figure 2. Travel on US Urban Highways by Month (FHWA)
Figure 3. Travel on US Rural Highways by month (FHWA) This shows that folk are actually driving less than they have previously, which may be reflective of the current economic condition, when combined with the high price for gasoline in relative historic terms. One can compare these curves with the demand for gasoline from This Week in Petroleum., though this has data through the end of the year and has a slightly different lower scale range.
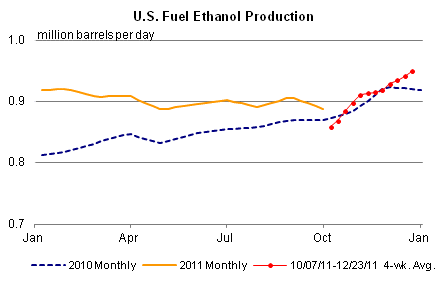
Figure 4, Demand for gasoline in the United States (EIA TWIP) Demand for gasoline, as with miles travelled, seems relatively equivalent for data for 2011 and 2012. The demand for ethanol, on the other hand, seems to be significantly less, assuming production matches that demand.
Figure 5. Production of fuel ethanol in the United States (EIA TWIP) OPEC take a keen interest in those activities in the United States that impact the demand for oil, and in their latest Monthly Oil Market Report (MOMR) have plotted the variation in oil price with miles driven:
Figure 6. US mileage plotted against the retail price of gasoline (OPEC January MOMR) Driven by increased demands for vehicular fuel OPEC anticipates continued growth in domestic demand for oil, both in the Middle East, and in Latin America.
Figure 7. Increase in domestic oil demand in the Middle East over 2012 and 2013. (OPEC January MOMR)
Figure 8. Anticipated growth in domestic demand in Latin America (OPEC MOMR) Both of these tables feed into and support the position that Westexas has discussed in regard to the drop in available exports of oil in the coming years. OPEC is not expecting to increase production in the coming year, but rather expecting that increase in demand will be met by production growth from the non-OPEC nations with numbers similar to those discussed earlier. And, as noted, most of that production growth is expected to come from America. The report confirms that OPEC, and particularly Saudi Arabia is willing to cut production, when demand falls, so that price levels are sustained. As in previous months the numbers showing production differ when the reports come from the countries themselves in contrast with reports from secondary sources.
Figure 9. OPEC crude production as reported directly. (OPEC MOMR ) There are significant drops in production reported for Iraq, Libya, Nigeria and Saudi Arabia so that the reported drop in production comes close to 1 mbd. There is not quite the same amount of sacrifice evident in the numbers from secondary sources.
Figure 10. OPEC crude production as reported from secondary sources (OPEC MOMR ) Overall production is down only around 500 kbd, with almost all of that being a reduction from Saudi Arabia. The difference between the production numbers from Nigeria (they report cutting production 120 kbd while others report they have increased production 136 kbd) are perhaps indicative of some of the problems that exist within the OPEC organization when they try and balance the supply:demand equation. However, given that KSA is willing to do the heavy lifting it seems likely that prices will continue at their current levels, despite any changes in American production levels.
Figure 1. 12 month rolling total of miles driven on all roads in the United States (FHWA) It should be noted that this is not the amount of fuel used, but rather the distance travelled, and thus in itself this does not reflect any changes in vehicle performance because of the increased efficiency of their engines. And while there does not appear to be any great difference between the numbers for 2011 and 2012 when broken down by month, for rural and urban travel, they both lie below the values for 2010.
Figure 2. Travel on US Urban Highways by Month (FHWA)
Figure 3. Travel on US Rural Highways by month (FHWA) This shows that folk are actually driving less than they have previously, which may be reflective of the current economic condition, when combined with the high price for gasoline in relative historic terms. One can compare these curves with the demand for gasoline from This Week in Petroleum., though this has data through the end of the year and has a slightly different lower scale range.
Figure 4, Demand for gasoline in the United States (EIA TWIP) Demand for gasoline, as with miles travelled, seems relatively equivalent for data for 2011 and 2012. The demand for ethanol, on the other hand, seems to be significantly less, assuming production matches that demand.
Figure 5. Production of fuel ethanol in the United States (EIA TWIP) OPEC take a keen interest in those activities in the United States that impact the demand for oil, and in their latest Monthly Oil Market Report (MOMR) have plotted the variation in oil price with miles driven:
Figure 6. US mileage plotted against the retail price of gasoline (OPEC January MOMR) Driven by increased demands for vehicular fuel OPEC anticipates continued growth in domestic demand for oil, both in the Middle East, and in Latin America.
Figure 7. Increase in domestic oil demand in the Middle East over 2012 and 2013. (OPEC January MOMR)
Figure 8. Anticipated growth in domestic demand in Latin America (OPEC MOMR) Both of these tables feed into and support the position that Westexas has discussed in regard to the drop in available exports of oil in the coming years. OPEC is not expecting to increase production in the coming year, but rather expecting that increase in demand will be met by production growth from the non-OPEC nations with numbers similar to those discussed earlier. And, as noted, most of that production growth is expected to come from America. The report confirms that OPEC, and particularly Saudi Arabia is willing to cut production, when demand falls, so that price levels are sustained. As in previous months the numbers showing production differ when the reports come from the countries themselves in contrast with reports from secondary sources.
Figure 9. OPEC crude production as reported directly. (OPEC MOMR ) There are significant drops in production reported for Iraq, Libya, Nigeria and Saudi Arabia so that the reported drop in production comes close to 1 mbd. There is not quite the same amount of sacrifice evident in the numbers from secondary sources.
Figure 10. OPEC crude production as reported from secondary sources (OPEC MOMR ) Overall production is down only around 500 kbd, with almost all of that being a reduction from Saudi Arabia. The difference between the production numbers from Nigeria (they report cutting production 120 kbd while others report they have increased production 136 kbd) are perhaps indicative of some of the problems that exist within the OPEC organization when they try and balance the supply:demand equation. However, given that KSA is willing to do the heavy lifting it seems likely that prices will continue at their current levels, despite any changes in American production levels.
Read more!
Thursday, January 5, 2012
Alaska, diesel, refining changes and Venezuelan exports
The Iditarod dog-sled race commemorates the time in 1925 when serum had to be carried from Anchorage to Nome to counter a diphtheria outbreak and dog sleds were the only way of making it through. A different problem is now beginning to face some of the remote villages in that state, as it becomes more difficult and expensive to supply fuel reserves to get them through the winter. With supplies restricted and expensive to deliver, prices can rise as high as $7.15 a gallon, gasoline was $5.44 in Nome earlier this winter. I was reminded of that this morning, as the Russian tanker, the Renda, turned back for minor repairs before essaying the trip from Dutch Harbor in the Aleutian Islands to Nome carrying a million gallons of diesel fuel (which powers the electric generators) and 400,000 gallons of gasoline. The fuel would normally have gone by barge earlier in the winter, but storms led to that delivery being cancelled. Now the tanker is being escorted by an ice-breaker since the last 300 miles of the 700 mile voyage will be through ice that can be 2 ft thick.
In other Alaskan news the November figure for oil flow down the Alaskan pipeline averaged 625 kbd, which gets the flow above the 600 kbd level which becomes a concern in winter, since it can lead to ice and wax build-up in the pipe. The December figure should be released soon.
UPDATE: As of January 9th the Renda is 140 miles from Nome, but is finding it hard to make progress through the ice, which is under considerable pressure. The "dynamic ice" has brought both vessels to an occasional halt, and the ice is thickening.
UPDATE 2: The ice has been more than 4 ft thick in places, and pressure is closing the passage some times before the Renda can make it through. It is difficult enough that the 2 vessels took a 12-hour break on Sunday night. They made 53 miles of progress on Monday, with 100 miles still to go.
Positiion of the ships (the icebreaker is the Healy) relative to Nome at 5 pm Tuesday (Central time)
Diesel fuel prices in the rest of the country are continuing to fall, as the latest TWIP notes, although at $3.70/gallon on average the price is still some $0.50 per gallon higher than last year.
Change in Diesel prices (EIA )
The US is producing around 5 million barrels of distillate (diesel) a day, up almost half a million barrels from last year, with domestic demand running around 4 million barrels. The remaining million barrels is being exported, largely to Europe and Latin America. The EPA requirement for cleaner diesel in the US has, as a perhaps unintended consequence, brought the fuel into compliance with European usage, and opened that market to the industry. Coming at a time when Russia is seeking to lower exports of low-sulfur diesel in order to keep domestic prices down, as the Export Land Model bites again, and with China banning exports, US exports have risen to exceed fuel imports.
Increasing exports is a move of necessity for some refineries since the continued decline in domestic demand for gasoline is hurting refineries. Sunoco, for example, is getting out of the business.
Decline in US gasoline demand over the past two years (EIA )
Note that there hasn’t been as much change in the domestic diesel market.
Demand for diesel in the USA over the past 2 years (EIA )
In fact Valero, one of the Gulf refiners, projects that the diesel market will continue to grow more strongly than that of gasoline.
Anticipated world growth in demand for gasoline and diesel (Valero Investor Presentation 2012 )
It has, as a result, been suggested that the additional diesel which will be generated should the Keystone XL pipeline be approved, will largely go to export. It has been pointed out that the Valero Refinery is in a Foreign Trade Zone, the diesel that is refined and exported will not pay taxes on it.
Export Market for diesel (Oil Change International )
Exports from the Valero Refineries (Valero Investor Presentation 2012 )
In passing I noted that Valero also seems to be doing well with its ethanol operations.
Recent income from ethanol for Valero (Valero Investor Presentation 2012 )
In the past 30 months Valero note that the EBITDA reached 90% of the purchase price of the 10 plants it runs, and which produce an average of 72,000 bd collectively. Collectively, in the USA, ethanol production has continued to increase.
US ethanol production (EIA )
And there was one final graph from Valero that I almost missed, but which is, in its way telling:
Venezuelan exports to the USA (Valero Investor Presentation 2012 )
It should be noted that this plot is just for refinery products, and that Venezuela has continued to export oil to the US over the past year. However the figures for the 4th Quarter show an average of 793 kbd, down 9% on last year, and the three monthly averages were October 916 kbd; November 748 kbd and December 715 kbd all significantly down on last year. In 2010 the US imported an average of 1.24 mbd, about half of Venezuelan production, but since Venezuela has fallen to become the fourth largest supplier to the USA with the average of 760 kbd much of the remaining Venezuelan production goes to China, and India. But should Venezuela continue to decline in overall production, that global shortfall will need to be made up from somewhere else.
In other Alaskan news the November figure for oil flow down the Alaskan pipeline averaged 625 kbd, which gets the flow above the 600 kbd level which becomes a concern in winter, since it can lead to ice and wax build-up in the pipe. The December figure should be released soon.
UPDATE: As of January 9th the Renda is 140 miles from Nome, but is finding it hard to make progress through the ice, which is under considerable pressure. The "dynamic ice" has brought both vessels to an occasional halt, and the ice is thickening.
UPDATE 2: The ice has been more than 4 ft thick in places, and pressure is closing the passage some times before the Renda can make it through. It is difficult enough that the 2 vessels took a 12-hour break on Sunday night. They made 53 miles of progress on Monday, with 100 miles still to go.
Positiion of the ships (the icebreaker is the Healy) relative to Nome at 5 pm Tuesday (Central time)Diesel fuel prices in the rest of the country are continuing to fall, as the latest TWIP notes, although at $3.70/gallon on average the price is still some $0.50 per gallon higher than last year.
Change in Diesel prices (EIA )The US is producing around 5 million barrels of distillate (diesel) a day, up almost half a million barrels from last year, with domestic demand running around 4 million barrels. The remaining million barrels is being exported, largely to Europe and Latin America. The EPA requirement for cleaner diesel in the US has, as a perhaps unintended consequence, brought the fuel into compliance with European usage, and opened that market to the industry. Coming at a time when Russia is seeking to lower exports of low-sulfur diesel in order to keep domestic prices down, as the Export Land Model bites again, and with China banning exports, US exports have risen to exceed fuel imports.
Increasing exports is a move of necessity for some refineries since the continued decline in domestic demand for gasoline is hurting refineries. Sunoco, for example, is getting out of the business.
Decline in US gasoline demand over the past two years (EIA ) Note that there hasn’t been as much change in the domestic diesel market.
Demand for diesel in the USA over the past 2 years (EIA ) In fact Valero, one of the Gulf refiners, projects that the diesel market will continue to grow more strongly than that of gasoline.
Anticipated world growth in demand for gasoline and diesel (Valero Investor Presentation 2012 )It has, as a result, been suggested that the additional diesel which will be generated should the Keystone XL pipeline be approved, will largely go to export. It has been pointed out that the Valero Refinery is in a Foreign Trade Zone, the diesel that is refined and exported will not pay taxes on it.
Export Market for diesel (Oil Change International )
Exports from the Valero Refineries (Valero Investor Presentation 2012 ) In passing I noted that Valero also seems to be doing well with its ethanol operations.
Recent income from ethanol for Valero (Valero Investor Presentation 2012 )In the past 30 months Valero note that the EBITDA reached 90% of the purchase price of the 10 plants it runs, and which produce an average of 72,000 bd collectively. Collectively, in the USA, ethanol production has continued to increase.
US ethanol production (EIA ) And there was one final graph from Valero that I almost missed, but which is, in its way telling:
Venezuelan exports to the USA (Valero Investor Presentation 2012 )It should be noted that this plot is just for refinery products, and that Venezuela has continued to export oil to the US over the past year. However the figures for the 4th Quarter show an average of 793 kbd, down 9% on last year, and the three monthly averages were October 916 kbd; November 748 kbd and December 715 kbd all significantly down on last year. In 2010 the US imported an average of 1.24 mbd, about half of Venezuelan production, but since Venezuela has fallen to become the fourth largest supplier to the USA with the average of 760 kbd much of the remaining Venezuelan production goes to China, and India. But should Venezuela continue to decline in overall production, that global shortfall will need to be made up from somewhere else.
Read more!
Labels:
Alaska,
diesel demand,
diesel exports,
ethanol,
oil pipelines,
refinery,
Valero,
Venezuela
Sunday, April 3, 2011
OGPSS - The top 30 oil producers, a review
These posts have been going through the EIA list of the top oil producers in the world, over the past few weeks, I thought I might just review them collectively, but briefly, before starting to look at individual countries and oilfields. Even the posts that I have written recently have become out of date with new information (Russia increased production again in February by 20 kbd over January reaching 10.23 mbd) and then fell back to 10.2 mbd in March but at this stage, rather than focusing on such details, I am trying to generate a sense of the overall picture. It should also be recognized that I am just grabbing a snapshot of data, rather than the more detailed studies that look at the longer term, which folk such as Rembrandt, Rune and Euan provide. The simplest way to do this is to place my current estimates of production for the top 30 oil producers that I have reviewed in this series against the EIA estimate of their production in 2009.
Top 30 oil producing countries (those increasing production over 2009 are shown in red). (Click on the table to enlarge it)
It is significant to note that while Saudi Arabia was producing 8.05 mbd of crude in 2009, this has risen to 8.869 mbd on average for February as the Kingdom increased production to match the shortfalls in oil exports from Libya, inter alia. (With roughly 1.8 mbd in “other liquids” this takes total KSA production to 10.67 mbd and moves it back to the top of the League. However those numbers were from the March MOMR, which reports on February, In that report Libya was still being recorded as producing around 1.3 mbd). It is now reported that overall OPEC was not able to match the Libyan decline in March, falling about 350 kbd short, while KSA production has now reached 9 mbd, (10.8 including other liquids).
Contrary to President Obama’s recent remarks the EIA are anticipating a decline in US crude oil and liquids production over the next two years, part of which has been blamed on the change in GOM regulations. As a result it would be optimistic to anticipate much more than a US production of 8.3 mbd (and the EIA project it will be down to 8.2 mbd next year). It is unlikely that US production will increase beyond that point.
US crude and liquid fuels production – (EIA )
With China, Iran, and Canada holding relatively steady in the short term, this gives an updated total of 39.83 mbd for the top six, which is about 1.4 mbd higher than when I wrote the initial post back in February, but 500 kbd below the EIA estimate for their 2009 production. (While Russia and the KSA increased, the USA and Iran declined). Of these it is likely that only the KSA can continue to increase production much more.
In the second tier, Mexican production continues to fall, and was down to 2.556 mbd in February, with reports that it will now be an oil importer well before 2020. Exports have already fallen to 1.23 mbd, which does not bode well for customers. The United Arab Emirates (UAE) have, like the KSA, increased production to help out, though so far this has only been up to 2.394 mbd from 2.3 mbd for most of last year. (They also produce roughly another 500 kbd of other liquid fuels). By 2020 they should be able to produce up to 3.5 mbd. And in similar vein Kuwait, now producing at 2.368 mbd, up from 2,3 mbd. Kuwaiti plans are to reach 3.5 mbd by 2015, and be at 4 mbd by 2020.
The current political turmoil has even persuaded Venezuela to increase production, with OPEC reporting levels of 2.39 mbd for February, a gain of around 100 kbd. Though how long that is sustained depends on the success of the many investors that have been persuaded to invest in the Venezuelan oil sands.
In the third group Norway is declining, being now at just over 2 mbd, and even though it has just announced a major new discovery that will not come on line for at least 5 – 10 years, and in the meanwhile production will continue to fall. Norway needs more discoveries similar to this, however, to be able to sustain production levels extending into the future, since without them production will collapse.
Brazil was touted, by President Obama in his remarks about the Energy Blueprint last week, though the increasing volumes of oil that they will produce remain foreign to the United States, and though they will likely increase production up to around 4 mbd by 2020, rising domestic consumption may well take much of that increase.
Which brings us into the states that has some political turmoil. Iraq has been able to bring production back to around 2.64 mbd (according to OPEC) with the hope of reaching 3 mbd by the end of this year. At the moment about 1.2 mbd of this is exported. One of the great questions of the decade is just how close to a projected 10 mbd by 2020 that Iraq will be able to get. Sadly the continuing conflicts there, though reduced in scale, make it difficult for me to see much beyond 5 mbd by 2020.
Nigeria, which has had its own internal conflicts for some time, is going to the polls as I write this, and the expected winner is planning to overhaul the oil industry. However, if stability continues, then it might be possible to resurrect some of the older fields and perhaps increase overall production by some 350 kbd.
Algeria, which has had some turmoil, but may emerge from the ongoing protests without much change, is producing around 2 mbd of liquids. That has not changed as OPEC has moved to match the decline in volumes from Libya and other countries facing protests, and may reflect the current maximum that the country can produce. In the stability stakes I suspect that Algeria may survive without much change, although the plot I put up from Energy Export Databrowser does suggest that production may have peaked.
Algerian oil statistics (Energy Export Databrowser)
Angola is currently producing 1.7 mbd but may add some 650 kbd this year, for a total of 2.35 mbd. And that brings us to Libya, where the increased fighting, particularly over the oil refinery town of Ras Lanuf, makes it increasingly unlikely that the 1.7 mbd which came from Libya will be available again soon.
The United Kingdom is in significant decline, but recent moves to further tax the oil industry have made it possible that the decline may steepen. This because the new taxes proposed will likely reduce the profitability of the field developments proposed, discouraging their development. Recently production has run at 1.35 mbd of liquids, which is scheduled to drop to 1.3 mbd this year, and 0.94 mbdoe of natural gas, anticipated to fall to 0.85 mbdoe this year. The criticality of investment is shown in the projected production over the next 5 years, with the different colors showing the likelihood of success. Note that the grey of current production is declining at about 10%.
UK Projected Oil production (2011 UK Oil and Gas Activity Survey )
UK Projected Natural Gas production (2011 UK Oil and Gas Activity Survey )
Moving to the next tier down, Kazakhstan is now at 1.6 mbd and slowly increasing production toward a target of 3 mbd by 2020. Qatar is running at 1.4 mbd, but with almost 0.6 mbd of that in NGL. Indonesia is producing right around 1 mbd and may maintain that in the short term. It is being challenged in rank by Azerbaijan which has just incremented up to 1 mbd, a volume that is expected to continue to rise until it reaches about 1.25 mbd in 2014.
The tier that lies below 1 mbd starts with India, which is currently holding a production of around 878 kbd, and having to import increasing amounts of oil to meet demand. Given that the country also subsidizes the price, this is becoming an increasingly expensive consideration for the government. India is followed by Argentina, which is post peak and declined to 0.76 mbd most recently. Egypt is similarly declining, now to 660 kbd, but as one of the early nations to change under the most recent protests, and with the situation still somewhat fluid, it is difficult to predict how much the country will have both for itself, and for external customers, a year from now.
Oman will likely weather the current storms, and is also increasing oil production, to the point that it is moving up to pass India, with an Omani production of 863 kbd, some of which is tied to NGL production.
In the final four that produce more than 500 kbd Malaysia is barely maintaining production at 700 kbd, while Australia has fallen from 588 kbd to 540 kbd. Both are now being passed in production by Colombia, one of the “hotter” places for development at the moment, with production rising to possibly 920 kbd this year. Ecuador, which closes out the top 30, has recently increased production from 485 to 504 kbd.
That completes the top 30, and accounts for some 76.7 mbd of production. Those same countries back in 2009 were reported by the EIA as producing some 79.23 mbd of oil. Remember that world demand is anticipated to increase by somewhere between 1.4 and 1.6 mbd this year, and that of this list of 30 only 13 increased production, and the rest declined and the concern for the future becomes thus more clearly defined. (The difference between the two totals is partially explained by the loss in Libyan oil - we will see within the month how well OPEC covers that).
But it is not the overall production from the world that can be estimated that accurately, but by looking at individual countries and, in some cases, individual oilfields that we can get some better sense of what is to come. So the next step will be looking at these nations in more detail, in the weeks ahead.
Top 30 oil producing countries (those increasing production over 2009 are shown in red). (Click on the table to enlarge it)It is significant to note that while Saudi Arabia was producing 8.05 mbd of crude in 2009, this has risen to 8.869 mbd on average for February as the Kingdom increased production to match the shortfalls in oil exports from Libya, inter alia. (With roughly 1.8 mbd in “other liquids” this takes total KSA production to 10.67 mbd and moves it back to the top of the League. However those numbers were from the March MOMR, which reports on February, In that report Libya was still being recorded as producing around 1.3 mbd). It is now reported that overall OPEC was not able to match the Libyan decline in March, falling about 350 kbd short, while KSA production has now reached 9 mbd, (10.8 including other liquids).
Contrary to President Obama’s recent remarks the EIA are anticipating a decline in US crude oil and liquids production over the next two years, part of which has been blamed on the change in GOM regulations. As a result it would be optimistic to anticipate much more than a US production of 8.3 mbd (and the EIA project it will be down to 8.2 mbd next year). It is unlikely that US production will increase beyond that point.
US crude and liquid fuels production – (EIA ) With China, Iran, and Canada holding relatively steady in the short term, this gives an updated total of 39.83 mbd for the top six, which is about 1.4 mbd higher than when I wrote the initial post back in February, but 500 kbd below the EIA estimate for their 2009 production. (While Russia and the KSA increased, the USA and Iran declined). Of these it is likely that only the KSA can continue to increase production much more.
In the second tier, Mexican production continues to fall, and was down to 2.556 mbd in February, with reports that it will now be an oil importer well before 2020. Exports have already fallen to 1.23 mbd, which does not bode well for customers. The United Arab Emirates (UAE) have, like the KSA, increased production to help out, though so far this has only been up to 2.394 mbd from 2.3 mbd for most of last year. (They also produce roughly another 500 kbd of other liquid fuels). By 2020 they should be able to produce up to 3.5 mbd. And in similar vein Kuwait, now producing at 2.368 mbd, up from 2,3 mbd. Kuwaiti plans are to reach 3.5 mbd by 2015, and be at 4 mbd by 2020.
The current political turmoil has even persuaded Venezuela to increase production, with OPEC reporting levels of 2.39 mbd for February, a gain of around 100 kbd. Though how long that is sustained depends on the success of the many investors that have been persuaded to invest in the Venezuelan oil sands.
In the third group Norway is declining, being now at just over 2 mbd, and even though it has just announced a major new discovery that will not come on line for at least 5 – 10 years, and in the meanwhile production will continue to fall. Norway needs more discoveries similar to this, however, to be able to sustain production levels extending into the future, since without them production will collapse.
Brazil was touted, by President Obama in his remarks about the Energy Blueprint last week, though the increasing volumes of oil that they will produce remain foreign to the United States, and though they will likely increase production up to around 4 mbd by 2020, rising domestic consumption may well take much of that increase.
Which brings us into the states that has some political turmoil. Iraq has been able to bring production back to around 2.64 mbd (according to OPEC) with the hope of reaching 3 mbd by the end of this year. At the moment about 1.2 mbd of this is exported. One of the great questions of the decade is just how close to a projected 10 mbd by 2020 that Iraq will be able to get. Sadly the continuing conflicts there, though reduced in scale, make it difficult for me to see much beyond 5 mbd by 2020.
Nigeria, which has had its own internal conflicts for some time, is going to the polls as I write this, and the expected winner is planning to overhaul the oil industry. However, if stability continues, then it might be possible to resurrect some of the older fields and perhaps increase overall production by some 350 kbd.
Algeria, which has had some turmoil, but may emerge from the ongoing protests without much change, is producing around 2 mbd of liquids. That has not changed as OPEC has moved to match the decline in volumes from Libya and other countries facing protests, and may reflect the current maximum that the country can produce. In the stability stakes I suspect that Algeria may survive without much change, although the plot I put up from Energy Export Databrowser does suggest that production may have peaked.
Algerian oil statistics (Energy Export Databrowser) Angola is currently producing 1.7 mbd but may add some 650 kbd this year, for a total of 2.35 mbd. And that brings us to Libya, where the increased fighting, particularly over the oil refinery town of Ras Lanuf, makes it increasingly unlikely that the 1.7 mbd which came from Libya will be available again soon.
The United Kingdom is in significant decline, but recent moves to further tax the oil industry have made it possible that the decline may steepen. This because the new taxes proposed will likely reduce the profitability of the field developments proposed, discouraging their development. Recently production has run at 1.35 mbd of liquids, which is scheduled to drop to 1.3 mbd this year, and 0.94 mbdoe of natural gas, anticipated to fall to 0.85 mbdoe this year. The criticality of investment is shown in the projected production over the next 5 years, with the different colors showing the likelihood of success. Note that the grey of current production is declining at about 10%.
UK Projected Oil production (2011 UK Oil and Gas Activity Survey )
UK Projected Natural Gas production (2011 UK Oil and Gas Activity Survey )Moving to the next tier down, Kazakhstan is now at 1.6 mbd and slowly increasing production toward a target of 3 mbd by 2020. Qatar is running at 1.4 mbd, but with almost 0.6 mbd of that in NGL. Indonesia is producing right around 1 mbd and may maintain that in the short term. It is being challenged in rank by Azerbaijan which has just incremented up to 1 mbd, a volume that is expected to continue to rise until it reaches about 1.25 mbd in 2014.
The tier that lies below 1 mbd starts with India, which is currently holding a production of around 878 kbd, and having to import increasing amounts of oil to meet demand. Given that the country also subsidizes the price, this is becoming an increasingly expensive consideration for the government. India is followed by Argentina, which is post peak and declined to 0.76 mbd most recently. Egypt is similarly declining, now to 660 kbd, but as one of the early nations to change under the most recent protests, and with the situation still somewhat fluid, it is difficult to predict how much the country will have both for itself, and for external customers, a year from now.
Oman will likely weather the current storms, and is also increasing oil production, to the point that it is moving up to pass India, with an Omani production of 863 kbd, some of which is tied to NGL production.
In the final four that produce more than 500 kbd Malaysia is barely maintaining production at 700 kbd, while Australia has fallen from 588 kbd to 540 kbd. Both are now being passed in production by Colombia, one of the “hotter” places for development at the moment, with production rising to possibly 920 kbd this year. Ecuador, which closes out the top 30, has recently increased production from 485 to 504 kbd.
That completes the top 30, and accounts for some 76.7 mbd of production. Those same countries back in 2009 were reported by the EIA as producing some 79.23 mbd of oil. Remember that world demand is anticipated to increase by somewhere between 1.4 and 1.6 mbd this year, and that of this list of 30 only 13 increased production, and the rest declined and the concern for the future becomes thus more clearly defined. (The difference between the two totals is partially explained by the loss in Libyan oil - we will see within the month how well OPEC covers that).
But it is not the overall production from the world that can be estimated that accurately, but by looking at individual countries and, in some cases, individual oilfields that we can get some better sense of what is to come. So the next step will be looking at these nations in more detail, in the weeks ahead.
Read more!
Sunday, February 13, 2011
OGPSS - Second tier oil producers
The current series of Tech Talks is aimed at discussing, in gradually increasing detail, where we are, and will be getting our oil and natural gas from over the next two decades. It is relatively easy to do a little hand-waving and say, as for example the BP review did, that Russia and Saudi Arabia are expected to continue to provide 12% each of the world’s oil supply through 2030 . It becomes a little more difficult to see that future if one accepts the rest of the BP argument that global supply will rise to over 102 mbd, requiring both Russia and Saudi Arabia to produce at about 12 mbd each through that time frame. It is a little easier to check the validity of the projections if the totals are broken down into smaller pieces, and then examined by looking at both current and projected production from the different countries that supply significant amounts of oil and natural gas, not forgetting the increasing amount that each country is setting aside for its own consumption. We can also check on how that demand is growing. For example gains in the global economy has caused OPEC, in their February 2011 Monthly Oil Market Report (MOMR), to increase their projection of oil demand in 2011, anticipating a rise of 1.4 mbd to average 87.7 mbd.
OPEC anticipated growth in oil demand (OPEC February MOMR)
While the key questions are often focused on countries such as Russia and Saudi Arabia, however, it is in the second tier that more evident changes may be seen. And as a reminder, we are reviewing the countries that were listed by the EIA as the top world oil producers, initially in 2008.
Source EIA
And so we will begin today with a look at the case of Mexico, which ranked 7th in overall oil production, at 3.186 mbd, in 2008, is illustrative of the need to examine future projections with a little caution.
Change in Mexican production from 2004 to 2009, (EIA )
Between those two dates Mexico’s overall production peaked, and started into decline. In December 2010 it produced an average 2.57 mbd of crude. The giant Cantarell field, which at peak production reached 2.12 mbd, fell below 500 kbd last May. Mexico, remains one of the two largest importers of crude to the United States (the other being Canada) , but may well become an importer of crude by 2015. Which leaves one wondering where the US might make up that 1 .3 mbd ?
Leading importers of petroleum products to the United States (EIA )
Mexico consumed internally an average of 2.08 mbd in 2009. One reason to start with Mexico, which has now fallen to 8th, and to use it as an example is that if we go back to 2007, Sam Foucher at TOD was pointing to the predictions of both the EIA and IEA which foresaw Mexico maintaining production of around 4 mbd in 2010. His projection, that Mexican production would drop by 30% from the 2004 figure by 2012, i.e. to 2.59 mbd turns out to be much closer to reality. (Though as with some of these numbers one needs to be sure that apples are being compared with apples, since there are different values depending on whether NGLs are included in the totals. OPEC, for example, is still reporting that Mexico is producing at 2.9 mbd ). Mexico produces some 7 bcf of natural gas, but uses this internally, and more, so that it is an importer of natural gas, and likely to increasingly be so.
Mexican natural gas production, use and imports (Energy Export Databrowser)
Moving from the troubled conditions in Mexico, the next country down the 2008 list was the United Arab Emirates, which in 2008 had averaged a production of 3.046 mbd. Remembering the decline in demand in 2009, it is not surprising that their output (as part of OPEC) fell in 2009 to average 2.795 mbd, OPEC reports that they produced some 2.35 mbd of crude in December 2010. There was an additional production of NGLs and condensate to give a total liquids production averaging 2.81 mbd in 2010. Consumption within the country has been steadily rising (435 kbd in 2009), and as a result, net exports have been declining.
United Arab Emirates oil production and consumption (EIA )
The UAE are one of the OPEC partners who can and do adjust oil flow to balance the market, and can thus potentially help with coming shortages elsewhere. However the UAE anticipates being able to increase oil production to 3.5 mbd,, though not before 2018. One way of achieving this is through extended reach drilling, and the hope of thus being able to increase the ORR to 70%. Current production capability is estimated at 2.7 mbd.
The UAE at present largely exports to Japan, South Korea and Thailand.
The UAE has the seventh largest reserves of natural gas (at 214 Tcf ) However in 2007 domestic demand surpassed production. Part of the reason for this is that the UAE injects the natural gas into oil bearing formations to improve oil recovery. The demand is partly seasonal, with the use of air conditioning driving summer use to over 7 bcf. Up to 3 bcf of this is imported in the summer from Qatar, with only 4.5 bcf being produced by the UAE. While production is to be increased there is also the likelihood that greater supply will substantially further increase domestic consumption, so that the UAE are unlikely to be exporting in the near future.
In much the same way as with UAE, Kuwait, as a member of OPEC has been controlling its production levels to ensure that prices stay “stable.” Back in 2008 Kuwait was producing 2.74 mbd and was 9th in the production stakes. It also has the second largest oilfield in the world, the Greater Burgan, after Ghawar in Saudi Arabia.. The EIA consider that it has the fifth largest oil reserves.
EIA ranking of proven oil reserves (EIA)
In January 2011 OPEC reported that Kuwait was producing 2.35 mbd, virtually all of which was exported. This in the month when OPEC production returned to the levels of December 2008. Last March Abdulaziz Alattar gave a talk on Kuwaiti oil strategies. The Kuwaiti goal is to reach a production capacity of 3.5 mbd by 2015, and to raise this to 4 mbd by 2020 and maintain it at that level. Concurrently they wish to raise the production of natural gas to 1.2 bcf/day by 2015, which will reduce the amount of natural gas that they currently flare off. In order to achieve this goal they will need to improve EOR capabilities and make the required investment in them. It should be noted that they recognize a difference between capability and actual production. And further they recognize that an increasing percentage of their production will be consumed internally.
Anticipated Kuwaiti internal hydrocarbon consumption (Abdulaziz Alattar)
It was interesting to see this table of relative exploration and production costs, which was being used to encourage investment help in meeting Kuwaiti goals.
Relative E& P costs per barrel (RSA is a Risk Sharing Agreement, PSA is a Production Sharing Agreement) (Abdulaziz Alattar)
Natural gas increases are needed as much to provide for the domestic market as any other reason, as the plot above shows. For, at the moment Kuwait imports half the natural gas that it consumes. Additional supplies are needed to meet water and electricity needs, and so, instead of largely relying on the gas recovered from oil operations there is a new emphasis on producing natural gas directly.
The next country down the list is Venezuela, but having posted on that country at some length recently, I think I will call a halt on the discussion for the evening.
OPEC anticipated growth in oil demand (OPEC February MOMR) While the key questions are often focused on countries such as Russia and Saudi Arabia, however, it is in the second tier that more evident changes may be seen. And as a reminder, we are reviewing the countries that were listed by the EIA as the top world oil producers, initially in 2008.
Source EIA And so we will begin today with a look at the case of Mexico, which ranked 7th in overall oil production, at 3.186 mbd, in 2008, is illustrative of the need to examine future projections with a little caution.
Change in Mexican production from 2004 to 2009, (EIA ) Between those two dates Mexico’s overall production peaked, and started into decline. In December 2010 it produced an average 2.57 mbd of crude. The giant Cantarell field, which at peak production reached 2.12 mbd, fell below 500 kbd last May. Mexico, remains one of the two largest importers of crude to the United States (the other being Canada) , but may well become an importer of crude by 2015. Which leaves one wondering where the US might make up that 1 .3 mbd ?
Leading importers of petroleum products to the United States (EIA ) Mexico consumed internally an average of 2.08 mbd in 2009. One reason to start with Mexico, which has now fallen to 8th, and to use it as an example is that if we go back to 2007, Sam Foucher at TOD was pointing to the predictions of both the EIA and IEA which foresaw Mexico maintaining production of around 4 mbd in 2010. His projection, that Mexican production would drop by 30% from the 2004 figure by 2012, i.e. to 2.59 mbd turns out to be much closer to reality. (Though as with some of these numbers one needs to be sure that apples are being compared with apples, since there are different values depending on whether NGLs are included in the totals. OPEC, for example, is still reporting that Mexico is producing at 2.9 mbd ). Mexico produces some 7 bcf of natural gas, but uses this internally, and more, so that it is an importer of natural gas, and likely to increasingly be so.
Mexican natural gas production, use and imports (Energy Export Databrowser) Moving from the troubled conditions in Mexico, the next country down the 2008 list was the United Arab Emirates, which in 2008 had averaged a production of 3.046 mbd. Remembering the decline in demand in 2009, it is not surprising that their output (as part of OPEC) fell in 2009 to average 2.795 mbd, OPEC reports that they produced some 2.35 mbd of crude in December 2010. There was an additional production of NGLs and condensate to give a total liquids production averaging 2.81 mbd in 2010. Consumption within the country has been steadily rising (435 kbd in 2009), and as a result, net exports have been declining.
United Arab Emirates oil production and consumption (EIA ) The UAE are one of the OPEC partners who can and do adjust oil flow to balance the market, and can thus potentially help with coming shortages elsewhere. However the UAE anticipates being able to increase oil production to 3.5 mbd,, though not before 2018. One way of achieving this is through extended reach drilling, and the hope of thus being able to increase the ORR to 70%. Current production capability is estimated at 2.7 mbd.
The UAE at present largely exports to Japan, South Korea and Thailand.
The UAE has the seventh largest reserves of natural gas (at 214 Tcf ) However in 2007 domestic demand surpassed production. Part of the reason for this is that the UAE injects the natural gas into oil bearing formations to improve oil recovery. The demand is partly seasonal, with the use of air conditioning driving summer use to over 7 bcf. Up to 3 bcf of this is imported in the summer from Qatar, with only 4.5 bcf being produced by the UAE. While production is to be increased there is also the likelihood that greater supply will substantially further increase domestic consumption, so that the UAE are unlikely to be exporting in the near future.
In much the same way as with UAE, Kuwait, as a member of OPEC has been controlling its production levels to ensure that prices stay “stable.” Back in 2008 Kuwait was producing 2.74 mbd and was 9th in the production stakes. It also has the second largest oilfield in the world, the Greater Burgan, after Ghawar in Saudi Arabia.. The EIA consider that it has the fifth largest oil reserves.
EIA ranking of proven oil reserves (EIA) In January 2011 OPEC reported that Kuwait was producing 2.35 mbd, virtually all of which was exported. This in the month when OPEC production returned to the levels of December 2008. Last March Abdulaziz Alattar gave a talk on Kuwaiti oil strategies. The Kuwaiti goal is to reach a production capacity of 3.5 mbd by 2015, and to raise this to 4 mbd by 2020 and maintain it at that level. Concurrently they wish to raise the production of natural gas to 1.2 bcf/day by 2015, which will reduce the amount of natural gas that they currently flare off. In order to achieve this goal they will need to improve EOR capabilities and make the required investment in them. It should be noted that they recognize a difference between capability and actual production. And further they recognize that an increasing percentage of their production will be consumed internally.
Anticipated Kuwaiti internal hydrocarbon consumption (Abdulaziz Alattar) It was interesting to see this table of relative exploration and production costs, which was being used to encourage investment help in meeting Kuwaiti goals.
Relative E& P costs per barrel (RSA is a Risk Sharing Agreement, PSA is a Production Sharing Agreement) (Abdulaziz Alattar) Natural gas increases are needed as much to provide for the domestic market as any other reason, as the plot above shows. For, at the moment Kuwait imports half the natural gas that it consumes. Additional supplies are needed to meet water and electricity needs, and so, instead of largely relying on the gas recovered from oil operations there is a new emphasis on producing natural gas directly.
The next country down the list is Venezuela, but having posted on that country at some length recently, I think I will call a halt on the discussion for the evening.
Read more!
Labels:
crude oil production,
Kuwait,
Mexico,
natural gas supply,
Russia,
Saudi Arabia,
UAE,
Venezuela
Monday, January 24, 2011
OGPSS - Some closing (for now) thoughts on Venezuela
I had not intended to start my new series of Tech Talks by looking at Venezuela, but that is how is has worked out, with three posts now on their crude oil and natural gas prospects. But Venezuelan production is not just tied in the oils of the Orinoco, most of it still comes from the more conventional oilfields of the country. As Jonathan Callahan noted, Colin Campbell has previously written on the geology, and equally important history and politics of Venezuelan production in his newsletter of July 2006. He takes us back to the first well that was drilled south of Lake Maracaibo in 1878, and outlines developments since that time. I looked through Daniel Yergin’s “The Prize” to see if it could cast a bit more light on the development of production through the country – but it is really a book more about the politics than the geology.
The book did, however, suggest that perhaps some of the developments of the industry were due to steps imposed on Venezuela and others. Thus, for example, up to 1932 Venezuela was supplying between 9 and 12% of US demand, but Congress then imposed a tariff on imports, leading to their being cut in half, and initially playing havoc in Venezuela, since about 55% of its production had been sent to the US. Within a few years they had, however, found an alternate market in Europe, and pre-war (WW2) were supplying 40% of the UK oil demand. In 1943 they decided that they weren’t getting a fair share of the profits and passed a law initially to nominally split the profit from the oil 50:50 with the oil companies. When President Betancourt came to power he first adjusted the rule to ensure that it really was 50:50 (and not realistically 40:60) and then was the first to ask for his percentage in oil, which the country could sell itself. Since the profit was set by the sales price of the oil, when Standard Oil of New Jersey on August 9, 1960 unilaterally cut the price of oil by fourteen cents, this led others to also cut their prices, and the economies of the oil exporting countries immediately suffered. The year before representatives of Venezuela, Saudi Arabia, Kuwait, Iran, and Iraq had met and signed a “Gentlemen’s Agreement” at the Arab Oil Congress in Cairo, which included language agreeing to “defend the price structure” and with the hope of switching the profit ratio to 60:40 in their favor. The drop in the posted price led to a meeting of the five initial signatories in Baghdad on September 10th, and by September 14th OPEC was formed. The oil companies then apologized and tried to re-establish control, but from such small beginnings . . . . (And The Prize was written in 1991). Venezuela nationalized their oil industry in 1975-76, creating Petroleos de Venezuela S.A. (PdVSA) as the operating company.
Well, with that bit of history behind us, and moving forward to 2006, when Colin wrote his piece, at that time the conventional fields in Venezuela were producing around 1.8 mbd, largely from the Lake Maracaibo conventional wells, and he anticipated that they could hold this level until about 2015, when it would drop to around 1.6 mbd. The unconventional production from the Orinoco was producing at around 650 kbd, for a total of around 2.45 mbd. He expected that the Orinoco flow would be stable until 2015, and would then rise at 3% pa through a peak in 2030, and then decline at 2% a year.
Venezuela claims to now have the world’s largest oil reserves, at 297 billion barrels, mainly in the Orinoco. In seeking to develop that oil, Venezuela is now actively working with Chinese companies (as I mentioned earlier) to the tune of a $40 billion investment, and the intent to raise production from the Orinoco by perhaps 800 kbd (with Venezuela still retaining that 60:40 split) . This gives Venezuela a target of producing 4 mbd by 2015. However that assumes that they are producing the “official volume” which is 3 mbd at the moment. The EIA put it closer to Colin’s total, or around 2.5 mbd in 2008, averaged 2.2 mbd in 2009, and it was falling. OPEC, in their January 2011 Monthly Oil Market Report notes that Venezuela has a production of 2.26 mbd in December. However this may not include the NGLs that are produced with the natural gas, and this has been estimated at around 300 kbd by the EIA. At the end of the year rains hit the Paraguana Refining Center refineries that process half of Venezuela’s crude, collectively around 1 mbd. The Amuay refinery (which processes around 650 kbd) was closed for a couple of days, while the Cardon refinery was closed for about two weeks.
If the Chinese loan of $20 billion last April is requiring Venezuela to ramp up deliveries to them from 400 kbd last summer, to 1 mbd by 2012 then this may explain why they are now having some difficulty making promised deliveries elsewhere, and are needing the helping hand that I mentioned in earlier posts. It might also explain why deliveries to the US have been falling off.
One way in which energy might be saved is to use renewable power to replace oil in the refineries. With most of the electric power in the country coming from hydro, it would have been thought that this could be a source of replacement. Unfortunately there are significant problems in the power systems of Venezuela – which I am going to forego discussing, other than giving the reference to a more comprehensive story. Cuba has, however, been instrumental in helping out with some of those problems, which were exacerbated by the severe drought. As a result thermal power stations were used to generate electricity, and it is this that Venezuela is considering to replace with wind energy.
The idea of using wind to provide some power for the refinery and thus release oil, was first bruited in 2005, it has apparently not yet worked out.
It was not until March 2010 that an agreement with the Spanish firm Gamesa was reached to build the first wind farm, And while plans for a significant development of some 100 MW in Falcon have been announced , this is partly now to reduce the reliance on hydropower. The overall intent is to generate 1500 MW in the next five years, but construction of that first farm, initially slated for last year, is now not projected to start until this July.
It is quite difficult to get accurate numbers on oil and gas production from Venezuela, so perhaps it is time to move on to a different place.
The book did, however, suggest that perhaps some of the developments of the industry were due to steps imposed on Venezuela and others. Thus, for example, up to 1932 Venezuela was supplying between 9 and 12% of US demand, but Congress then imposed a tariff on imports, leading to their being cut in half, and initially playing havoc in Venezuela, since about 55% of its production had been sent to the US. Within a few years they had, however, found an alternate market in Europe, and pre-war (WW2) were supplying 40% of the UK oil demand. In 1943 they decided that they weren’t getting a fair share of the profits and passed a law initially to nominally split the profit from the oil 50:50 with the oil companies. When President Betancourt came to power he first adjusted the rule to ensure that it really was 50:50 (and not realistically 40:60) and then was the first to ask for his percentage in oil, which the country could sell itself. Since the profit was set by the sales price of the oil, when Standard Oil of New Jersey on August 9, 1960 unilaterally cut the price of oil by fourteen cents, this led others to also cut their prices, and the economies of the oil exporting countries immediately suffered. The year before representatives of Venezuela, Saudi Arabia, Kuwait, Iran, and Iraq had met and signed a “Gentlemen’s Agreement” at the Arab Oil Congress in Cairo, which included language agreeing to “defend the price structure” and with the hope of switching the profit ratio to 60:40 in their favor. The drop in the posted price led to a meeting of the five initial signatories in Baghdad on September 10th, and by September 14th OPEC was formed. The oil companies then apologized and tried to re-establish control, but from such small beginnings . . . . (And The Prize was written in 1991). Venezuela nationalized their oil industry in 1975-76, creating Petroleos de Venezuela S.A. (PdVSA) as the operating company.
Well, with that bit of history behind us, and moving forward to 2006, when Colin wrote his piece, at that time the conventional fields in Venezuela were producing around 1.8 mbd, largely from the Lake Maracaibo conventional wells, and he anticipated that they could hold this level until about 2015, when it would drop to around 1.6 mbd. The unconventional production from the Orinoco was producing at around 650 kbd, for a total of around 2.45 mbd. He expected that the Orinoco flow would be stable until 2015, and would then rise at 3% pa through a peak in 2030, and then decline at 2% a year.
Venezuela claims to now have the world’s largest oil reserves, at 297 billion barrels, mainly in the Orinoco. In seeking to develop that oil, Venezuela is now actively working with Chinese companies (as I mentioned earlier) to the tune of a $40 billion investment, and the intent to raise production from the Orinoco by perhaps 800 kbd (with Venezuela still retaining that 60:40 split) . This gives Venezuela a target of producing 4 mbd by 2015. However that assumes that they are producing the “official volume” which is 3 mbd at the moment. The EIA put it closer to Colin’s total, or around 2.5 mbd in 2008, averaged 2.2 mbd in 2009, and it was falling. OPEC, in their January 2011 Monthly Oil Market Report notes that Venezuela has a production of 2.26 mbd in December. However this may not include the NGLs that are produced with the natural gas, and this has been estimated at around 300 kbd by the EIA. At the end of the year rains hit the Paraguana Refining Center refineries that process half of Venezuela’s crude, collectively around 1 mbd. The Amuay refinery (which processes around 650 kbd) was closed for a couple of days, while the Cardon refinery was closed for about two weeks.
If the Chinese loan of $20 billion last April is requiring Venezuela to ramp up deliveries to them from 400 kbd last summer, to 1 mbd by 2012 then this may explain why they are now having some difficulty making promised deliveries elsewhere, and are needing the helping hand that I mentioned in earlier posts. It might also explain why deliveries to the US have been falling off.
One way in which energy might be saved is to use renewable power to replace oil in the refineries. With most of the electric power in the country coming from hydro, it would have been thought that this could be a source of replacement. Unfortunately there are significant problems in the power systems of Venezuela – which I am going to forego discussing, other than giving the reference to a more comprehensive story. Cuba has, however, been instrumental in helping out with some of those problems, which were exacerbated by the severe drought. As a result thermal power stations were used to generate electricity, and it is this that Venezuela is considering to replace with wind energy.
The idea of using wind to provide some power for the refinery and thus release oil, was first bruited in 2005, it has apparently not yet worked out.
Venezuela's state oil company PDVSA aims to boost fuel oil exports by about 100,000 barrels a month through the increased use of wind for electric power generation, Nervis Villalobos, the president of state-owned electricity firm Cadafe and deputy energy and oil minister, told BNamericas
It was not until March 2010 that an agreement with the Spanish firm Gamesa was reached to build the first wind farm, And while plans for a significant development of some 100 MW in Falcon have been announced , this is partly now to reduce the reliance on hydropower. The overall intent is to generate 1500 MW in the next five years, but construction of that first farm, initially slated for last year, is now not projected to start until this July.
It is quite difficult to get accurate numbers on oil and gas production from Venezuela, so perhaps it is time to move on to a different place.
Read more!
Labels:
China,
crude oil,
natural gas supply,
OPEC oil production,
Venezuela
Sunday, January 16, 2011
OGPSS - Natural Gas finds and production in Venezuela
In the last two Tech talks I have been discussing the production of heavy oil from the deposits in the Orinoco Basin in Venezuela. Production of that oil requires, in part, the injection of large quantities of natural gas. In writing about the resources that the country has, it would be remiss not to concurrently note the recent discoveries of additional volumes of natural gas offshore Venezuela, and the volumes that are thus available, not only for the oil fields, but also for a rising domestic consumption.
In November 2009, Repsol announced that the Perla 1X well had found the equivalent of between 1 and 1.4 boe of natural gas, said to be the fifth largest hydrocarbon discovery in 2009. (The other four, in debatable rank are Miran West (Iraq), Poseidon (Australia); Abare West in the Santos Basin (Brazil) and Tamar (Israel). You can argue about the size of some of the others – such as the Keathley Canyon discoveries in the GOM, since it depends on whose list (see slide 11) or other list you use.
Location of the initial Repsol natural gas discoveries off Venezuela.
Since then additional drilling reported by ENI, in the same Cardon IV block, has confirmed that this is a giant field, with a potential size of 2.5 billion boe (14 Tcf of natural gas). To clarify who owns what:
Source Energy Export Databrowser
That import comes about because of the Antonio Ricaurte gas pipeline that was constructed between Venezuela and Colombia. Begun in 2006, at a cost of $467 million to PdVSA, the 140-mile long pipeline was finished in 2007 with the initial idea that natural gas would first flow from Colombia to Venezuela, but then, within four to seven years, as the infrastructure in Venezuela improved, and the Guajira gas fields in Colombia decline, it would flow the other way. It has not had a totally smooth history, since just over a year ago Colombia reduced the flow, in part due to a rise in local demand.
Oil (green) and natural gas (red) pipelines in Venezuela. (Source Theodora)
The fields that are supposed to provide the surplus natural gas and thus to allow the flow to Colombia after 2012 included those of the Mariscal Sucre project to the East.
Location of the Mariscal Sucre project
However when, most recently, bids were first issued for that project last January there were no bids. As Wiki-leaks found, this was somewhat upsetting to the Venezuelan government, who need the natural gas to pump into the oilfields and maintain the pressure needed for production. The problem appeared to relate to the price to be paid for the natural gas, relative to the $8 billion development cost.
In the end PdVSA decided to go forward with the project themselves, using the Aban Pearl semi-submersible owned by an Indian-based company . But, back in May the semi-submersible sank, a week after igniting the gas flare at the beginning of the development. Initially, back in 2002, that project was to have been run by a partnership between PdVSA, Shell and Misubishi, as part of an LNG project. This was scaled back and PdVSA began to develop the project alone. At the time of the sinking the rig was drilling in the Dragon area of the project, slated to produce between 600 and 700 mcf/day, with an ultimate target for the project of 1.2 bcf/day. The field (ultimately possibly of 8 wells) would deliver to shore through a 70-mile undersea pipeline. Since the sinking of the rig, PdVSA has contracted with Technip to build a production platform for the field, with construction planned so that the original target of production by 2012 could still be met.
Venezuela still has a large potential for producing natural gas, and from time to time has talked of developing LNG facilities to export some of this. The EIA cites three possible developments that were discussed in 2008, with the trains supplied from fields at Plataforma Deltana, Mariscal Sucre, and Blanquilla-Tortuga. Two years later Iran has just signed an agreement to help with the Delta Caribe project (which covers the first two trains) but while scheduled for 2014 it is interesting to note (along the lines of the swap arrangement that I mentioned in regard to Venezuelan oil last week) the first paragraph in the following release.
In November 2009, Repsol announced that the Perla 1X well had found the equivalent of between 1 and 1.4 boe of natural gas, said to be the fifth largest hydrocarbon discovery in 2009. (The other four, in debatable rank are Miran West (Iraq), Poseidon (Australia); Abare West in the Santos Basin (Brazil) and Tamar (Israel). You can argue about the size of some of the others – such as the Keathley Canyon discoveries in the GOM, since it depends on whose list (see slide 11) or other list you use.
Location of the initial Repsol natural gas discoveries off Venezuela.Since then additional drilling reported by ENI, in the same Cardon IV block, has confirmed that this is a giant field, with a potential size of 2.5 billion boe (14 Tcf of natural gas). To clarify who owns what:
The Cardon IV Block is currently licensed and operated by a Joint Operating Company named Cardon IV S.A. which is 50% owned by Eni and 50% by Repsol. The Venezuelan state company Petroleos de Venezuela S.A. (PDVSA) owns a 35% back-in right to be exercised in the development phase, and at that time Eni and Repsol will each hold a 32.5% interest in the project, which will then be jointly operated by the three companies.Given that the field is in relatively shallow water (70 m) it is anticipated that an initial production of some 300 mcf/day can be brought ashore and pipelined, by 2013. Now this may sound quite a bit, but Venezuelan production has been declining, to the point that the country has started to import natural gas.
Source Energy Export DatabrowserThat import comes about because of the Antonio Ricaurte gas pipeline that was constructed between Venezuela and Colombia. Begun in 2006, at a cost of $467 million to PdVSA, the 140-mile long pipeline was finished in 2007 with the initial idea that natural gas would first flow from Colombia to Venezuela, but then, within four to seven years, as the infrastructure in Venezuela improved, and the Guajira gas fields in Colombia decline, it would flow the other way. It has not had a totally smooth history, since just over a year ago Colombia reduced the flow, in part due to a rise in local demand.
Oil (green) and natural gas (red) pipelines in Venezuela. (Source Theodora) The fields that are supposed to provide the surplus natural gas and thus to allow the flow to Colombia after 2012 included those of the Mariscal Sucre project to the East.
Location of the Mariscal Sucre projectHowever when, most recently, bids were first issued for that project last January there were no bids. As Wiki-leaks found, this was somewhat upsetting to the Venezuelan government, who need the natural gas to pump into the oilfields and maintain the pressure needed for production. The problem appeared to relate to the price to be paid for the natural gas, relative to the $8 billion development cost.
In the end PdVSA decided to go forward with the project themselves, using the Aban Pearl semi-submersible owned by an Indian-based company . But, back in May the semi-submersible sank, a week after igniting the gas flare at the beginning of the development. Initially, back in 2002, that project was to have been run by a partnership between PdVSA, Shell and Misubishi, as part of an LNG project. This was scaled back and PdVSA began to develop the project alone. At the time of the sinking the rig was drilling in the Dragon area of the project, slated to produce between 600 and 700 mcf/day, with an ultimate target for the project of 1.2 bcf/day. The field (ultimately possibly of 8 wells) would deliver to shore through a 70-mile undersea pipeline. Since the sinking of the rig, PdVSA has contracted with Technip to build a production platform for the field, with construction planned so that the original target of production by 2012 could still be met.
Venezuela still has a large potential for producing natural gas, and from time to time has talked of developing LNG facilities to export some of this. The EIA cites three possible developments that were discussed in 2008, with the trains supplied from fields at Plataforma Deltana, Mariscal Sucre, and Blanquilla-Tortuga. Two years later Iran has just signed an agreement to help with the Delta Caribe project (which covers the first two trains) but while scheduled for 2014 it is interesting to note (along the lines of the swap arrangement that I mentioned in regard to Venezuelan oil last week) the first paragraph in the following release.
The official added that Venezuela has long-term contracts with Argentina and Cuba to supply the countries with their required gas by 2013, noting that under the agreements inked between Tehran and Caracas part of their gas needs will be procured by Iran's LNG plant.Whether the LNG terminals get built is still likely a dubious question. The world market for LNG is becoming more readily supplied, though to a degree that depends on how the domestic production in the USA shakes out. (And the development of shale gas in countries such as Argentina). As a result though Venezuela continues to find large quantities of natural resources, it will be the investment that brings these products to market in a timely manner that will validate the continuing promise of increased production at some future date.
Kheirandish stated that 40 percent of the project to construct Iran LNG plant is completed, expressing hope that the project will be half complete by the end of the current Iranian calendar year (March 20, 2011).
According to the Letter of Intent signed between Iran and Venezuela, Tehran will help Caracas to build an LNG plant in Delta Caribe area, and Venezuela will also cooperate with the Islamic Republic to build an Iranian LNG plant in Venezuela with an annual production capacity of 5.4 million tons.
Read more!
Subscribe to:
Posts (Atom)