Showing posts with label USA. Show all posts
Sunday, July 13, 2014
Tech Talk - Here we go again, again
A couple of posts or so ago I mentioned that there are three major problems sitting relatively un-noticed as we head into the mess of Peak Oil. Of these, perhaps the one that gets the least attention is the steady decline in production from existing wells. We are just about at the point where the Alaskan Pipeline will tip over into feeding less than half-a-million barrels a day down from the North Slope. (It sent 501 kbd down the pipe in June with a 98.6% reliability factor). At the same time those in control of the oilfields in the Russia are reporting that Russian exports have fallen to the lowest level in 6 years. This brings back the relatively unrecognized reality of the Export Land Model which Jeffrey Brown first introduced on The Oil Drum back in 2007.
It is worth resurrecting that thinking (which time has proven to be only too true) as we look at the continued declines in production from the UK, as an example. It is not easily discernable from the official Department of Energy and Climate Change, which plots oil production on a monthly basis (with different months having a variety of days):
Figure 1. Monthly production of oil from the fields of the UK continental shelf (DECC ).
Euan Mearns has, however, done the necessary arithmetic and clearly shows the reality of the situation once one converts it back to barrels per day:
Figure 2. UK production of oil and natural gas over the past decade (Euan Mearns)
The steady decline has also been noted by the EIA who commented that UK production fell by 9% from 2012 to 2013. There was a time, back in the days of The Oil Drum, where we debated whether an estimate of 5% for field decline rates was or was not too high. Obviously those days are now behind us, and reality is starting to show numbers that far exceed the rates that, at the time, some thought rather pessimistic. To continue the UK numbers, as OPEC recently anticipated, the decline this year will take the total down to 800 kbd with an 8% decline expected for this year.
The Export Land Model, in its simplest form, can be illustrated with the following plot:
Figure 3. A simplified illustration of the changing production, internal use and exports for an oil producing country, once it reaches a peak in production (Sam Foucher )
The argument that produces the above plot goes along the lines that, as an oil producer (think for a moment of Russia for eg) produces larger volumes of oil, so the economy of that country starts to grow. As that growth continues it demands an increasing amount of energy to sustain the increased internal demand (the green line). However, once production stabilizes or starts to decline (the blue line above) so the amount available for export becomes reduced (the red line).
The three top producers of petroleum products in the world are the United States, Russia and the Kingdom of Saudi Arabia. The United States consumes far more than it produces, and thus is already a net importer of petroleum products, although in the short term, as I noted earlier production gains from the Bakken and Eagle Ford are hiding the problems of decline rate. It is increasingly unlikely that any significant volume of US oil will make it onto the world market.
Saudi Arabia has, for years, controlled the amount of oil that it puts on the market, based on the anticipated global demand, and the supply available from the rest of the world - so that the global price remains at a level to sustain OPEC economies. That has been illustrated over the past couple of years by the increase in production from the KSA to cover the decline from Libya as about a million barrels a day disappeared from the global market. The gains in production from the US helped in meeting global demand and the strain in supply was thus relatively easily hidden. But the KSA has an imminent problem that has largely disappeared from public view now that the eyes of The Oil Drum correspondents have lost that focus.
The major oilfields of the Kingdom are old, and to sustain production perimeter wells were located around the oilfields that injected millions of barrels of seawater a day, to drive the oil towards the center of the fields, where it could be relatively easily recovered from Maximum Reservoir Contact wells drilled along the very top of the reservoirs. But as folk such as JoulesBurn have noted, those wells slowly change in nature, over time, as the oil migration continues, and water injection must move inwards to ensure continued production.
Figure 4. Layout of initial wells at the Haradh III development in the Ghawar oilfield in Saudi Arabia (JoulesBurn at The Oil Drum)
He noted, in the original post, that Aramco had to drill some 52 wells, rather than the estimated 32, to get the production they needed, and that was back in 2010. Since then Ghawar has continued to produce for the Kingdom, but with daily levels of up around 10 mbd, the volumes in the crests of the anticlines along which the oil wells sit within the Ghawar field have been steadily contracting, and although they have carried out some of the most advanced oilwell engineering to sustain production from the attic oil in the older parts of the fields, there are only so many ways you can squeeze a rock before you get out all the oil that you will – and those days are approaching fast.
At the same time (relating back to the ELM) while Saudi production has remained at just under 10 mbd for the past few years, internal demand has been rising at a steadily more rapid rate.
Figure 5. Internal consumption of oil in Saudi Arabia (Index Mundi ).
Hoping to transition some of the current internal demands to natural gas, the KSA has been looking for internal resources to allow it to move away from oil. However the search has not been as successful as hoped, particularly with the search for natural gas, Shell having backed out of the program as a result of the poor results to date.
With internal consumption continuing to rise at more than twice the rate anticipated by the ELM shown in Figure 3, and, at best, stable production, global exports from the Kingdom are of increasing concern.
Which brings us back to Russia, where the new fields that must be exploited to sustain production are in remote parts of Eastern Siberia and the Yamal Peninsula – if not offshore in the Arctic.
Russian oil production has been peaking for some time (falling from 3.4% growth in 2012 to 1.3% in 2013) and is now reported to likely fall by 6.3% over the next two years. Since this implies that Russia is now at peak, the decline in overall production initially will fall below that of Figure 3, though likely only for a year or so, before the rate will be, at minimum, that shown. (The reason for this conclusion comes from the lack of enough investment in the fields where growth can be expected). At the same time internal demand is rising at around 100 kbd or 3% pa slightly above the value assumed for Figure 3.
If none of the three largest producers can even sustain exports, and the ELM explains why they can’t, and world demand continues to rise at the rates projected, then, in even the short-term, something is going to have to give. The logical weakest link is price, with the consequence, that invalidates a lot of the other arguments, of a significant impact on global economic health. As we have seen before, significant increases in price lowers the demand for oil, and thus demand from the various nations will become even more skewed.
The only problem, with this next iteration, is that there isn’t another Bakken or Eagle Ford conveniently sitting waiting to be tapped.
It is worth resurrecting that thinking (which time has proven to be only too true) as we look at the continued declines in production from the UK, as an example. It is not easily discernable from the official Department of Energy and Climate Change, which plots oil production on a monthly basis (with different months having a variety of days):
Figure 1. Monthly production of oil from the fields of the UK continental shelf (DECC ).
Euan Mearns has, however, done the necessary arithmetic and clearly shows the reality of the situation once one converts it back to barrels per day:
Figure 2. UK production of oil and natural gas over the past decade (Euan Mearns)
The steady decline has also been noted by the EIA who commented that UK production fell by 9% from 2012 to 2013. There was a time, back in the days of The Oil Drum, where we debated whether an estimate of 5% for field decline rates was or was not too high. Obviously those days are now behind us, and reality is starting to show numbers that far exceed the rates that, at the time, some thought rather pessimistic. To continue the UK numbers, as OPEC recently anticipated, the decline this year will take the total down to 800 kbd with an 8% decline expected for this year.
The Export Land Model, in its simplest form, can be illustrated with the following plot:
Figure 3. A simplified illustration of the changing production, internal use and exports for an oil producing country, once it reaches a peak in production (Sam Foucher )
The argument that produces the above plot goes along the lines that, as an oil producer (think for a moment of Russia for eg) produces larger volumes of oil, so the economy of that country starts to grow. As that growth continues it demands an increasing amount of energy to sustain the increased internal demand (the green line). However, once production stabilizes or starts to decline (the blue line above) so the amount available for export becomes reduced (the red line).
The three top producers of petroleum products in the world are the United States, Russia and the Kingdom of Saudi Arabia. The United States consumes far more than it produces, and thus is already a net importer of petroleum products, although in the short term, as I noted earlier production gains from the Bakken and Eagle Ford are hiding the problems of decline rate. It is increasingly unlikely that any significant volume of US oil will make it onto the world market.
Saudi Arabia has, for years, controlled the amount of oil that it puts on the market, based on the anticipated global demand, and the supply available from the rest of the world - so that the global price remains at a level to sustain OPEC economies. That has been illustrated over the past couple of years by the increase in production from the KSA to cover the decline from Libya as about a million barrels a day disappeared from the global market. The gains in production from the US helped in meeting global demand and the strain in supply was thus relatively easily hidden. But the KSA has an imminent problem that has largely disappeared from public view now that the eyes of The Oil Drum correspondents have lost that focus.
The major oilfields of the Kingdom are old, and to sustain production perimeter wells were located around the oilfields that injected millions of barrels of seawater a day, to drive the oil towards the center of the fields, where it could be relatively easily recovered from Maximum Reservoir Contact wells drilled along the very top of the reservoirs. But as folk such as JoulesBurn have noted, those wells slowly change in nature, over time, as the oil migration continues, and water injection must move inwards to ensure continued production.
Figure 4. Layout of initial wells at the Haradh III development in the Ghawar oilfield in Saudi Arabia (JoulesBurn at The Oil Drum)
He noted, in the original post, that Aramco had to drill some 52 wells, rather than the estimated 32, to get the production they needed, and that was back in 2010. Since then Ghawar has continued to produce for the Kingdom, but with daily levels of up around 10 mbd, the volumes in the crests of the anticlines along which the oil wells sit within the Ghawar field have been steadily contracting, and although they have carried out some of the most advanced oilwell engineering to sustain production from the attic oil in the older parts of the fields, there are only so many ways you can squeeze a rock before you get out all the oil that you will – and those days are approaching fast.
At the same time (relating back to the ELM) while Saudi production has remained at just under 10 mbd for the past few years, internal demand has been rising at a steadily more rapid rate.
Figure 5. Internal consumption of oil in Saudi Arabia (Index Mundi ).
Hoping to transition some of the current internal demands to natural gas, the KSA has been looking for internal resources to allow it to move away from oil. However the search has not been as successful as hoped, particularly with the search for natural gas, Shell having backed out of the program as a result of the poor results to date.
With internal consumption continuing to rise at more than twice the rate anticipated by the ELM shown in Figure 3, and, at best, stable production, global exports from the Kingdom are of increasing concern.
Which brings us back to Russia, where the new fields that must be exploited to sustain production are in remote parts of Eastern Siberia and the Yamal Peninsula – if not offshore in the Arctic.
Russian oil production has been peaking for some time (falling from 3.4% growth in 2012 to 1.3% in 2013) and is now reported to likely fall by 6.3% over the next two years. Since this implies that Russia is now at peak, the decline in overall production initially will fall below that of Figure 3, though likely only for a year or so, before the rate will be, at minimum, that shown. (The reason for this conclusion comes from the lack of enough investment in the fields where growth can be expected). At the same time internal demand is rising at around 100 kbd or 3% pa slightly above the value assumed for Figure 3.
If none of the three largest producers can even sustain exports, and the ELM explains why they can’t, and world demand continues to rise at the rates projected, then, in even the short-term, something is going to have to give. The logical weakest link is price, with the consequence, that invalidates a lot of the other arguments, of a significant impact on global economic health. As we have seen before, significant increases in price lowers the demand for oil, and thus demand from the various nations will become even more skewed.
The only problem, with this next iteration, is that there isn’t another Bakken or Eagle Ford conveniently sitting waiting to be tapped.
Read more!
Thursday, June 28, 2012
OGPSS - The Harvard Energy Report, another cough
The OGPSS posts of the last few months have been following a path of looking in a relatively realistic manner at crude oil production with emphasis on that coming from the United States, Russia and Saudi Arabia – the current focus of the weekly pieces. An earlier piece, looked at a Citigroup report of considerable optimism, and the post explained why, in reality, it is impractical to anticipate much increase in US production this decade. Since then, after reviewing the production from Russia, several posts have shown why their current lead in daily crude oil production is likely to be soon over, and that Russian production will then decline, as the oil companies are not bringing new fields on line as fast as the old ones are running out. Saudi Arabia, as the current section of posts are in the process of explaining, is unlikely to increase production much beyond 10 mbd, since Ghawar, the major field on which its current production level is built, is reaching the end of its major contribution, though it will continue to produce at a lower rate into the future. The bottom line, at least to date, is that there is no evidence from the top 3 producers that their production will be even close, in total, to current levels by the end of the decade.
So, (h/t Leanan) there now comes an Energy Study from Harvard which boldly states that this is rubbish, and that by 2020 global production will be at 110.6 mbd and these concerns that most of us have at The Oil Drum (inter alia) are chimeras of the imagination.
Figure 1. Anticipated Growth in global oil production by the end of the decade (Maugeri, Leonardo. “Oil: The Next Revolution” Discussion Paper 2012-10, Belfer Center for Science and International Affairs, Harvard Kennedy School, June 2012. )
It is therefore pertinent to begin with examining where the study (which was prepared with BP assistance) anticipates that the growth in supply will come from.
That too is shown as a plot:
Figure 2. Anticipated sources of the growth in global production by 2020 (showing only the top 23 producers). ((Maugeri, Leonardo. “Oil: The Next Revolution” Discussion Paper 2012-10, Belfer Center for Science and International Affairs, Harvard Kennedy School, June 2012.)
It is instructive, in reading this plot, to first recognize that it is a plot of anticipated production capacity, rather than projected actual production. The reason for this can perhaps be illustrated by an example. Within the current production capacity that Saudi Arabia claims adds up to 12 mbd is the 900 kbd that will come from Manifa as it is further developed and comes on line within the next few years. However at that time the increase in production is going, to some degree, to offset the declines in existing wells and producing fields that will become more severe as more of existing horizontal wells water out. Manifa is not currently in significant production, and is unlikely to be at such a level for at least another 18-months, with production being tied to the construction of the two new refineries being built to handle the oil. It is not therefore a currently instantaneously available source of oil. At a relatively normal 5% per year decline in production from existing fields, Saudi Arabia will have to bring on line (and sustain) at least 500 kbd per year of new production, and while it is likely that it can do this for a year or two more, betting that it will be able to do this and to raise production 2 mbd or more in 2020 is on the far side of optimistic. Just because a reserve exists does not mean that it can be brought on line without the physical facilities in place to produce it.
It is interesting, however, to note the report’s view on field declines in production:
The amount of oil in the region tapped by the well is finite, and when it is gone it is gone, whether from a vertical well that shows that gradual decline with time, or from the horizontal well that holds the production level until the water hits the well and it stops. I am not sure that the author of the report understands this.
The point concerning support logistics is critical in a number of instances. The political difficulties in increasing production from the oil sands in Alberta, through constraints on pipeline construction either South or West, are at least as likely to restrict future growth of that deposit as any technical challenge. The four countries that the report sees contributing most to future oil supplies are (in the ranked order) Iraq; the United States; Canada and Brazil. For Iraq he sees production possibly coming from the following fields, within the next eight years.
Figure 3. Anticipated production gains in Iraq in the next eight years. (Maugeri, Leonardo. “Oil: The Next Revolution” Discussion Paper 2012-10, Belfer Center for Science and International Affairs, Harvard Kennedy School, June 2012. )
I understand that one ought to show some optimism at some point over Iraq, but it has yet to reach the levels of production that it achieved before the Iran:Iraq War, and that was over some time ago. The EIA has shown that it is possible to get a total of over 13 mbd of production, but it requires investment and time, and some degree of political stability in the country. That is still somewhat lacking. Prior to that war Iraq was producing at 3.5 mbd, the production curve since then has not been encouraging:
Figure 4. History of Iraqi Production since the start of the Iran:Iraq War. (EIA)
Recognizing that the country has problems, the report still expects that there will be a growth in production of some 5.125 mbd by the end of the decade. This appears to be a guess as to being some 50% of the 10.425 mbd that the country could potentially achieve.
As for US production, this is tied to increasing production from all the oil shales in the country, which will see spurts in growth similar to that seen in the Bakken and Eagle Ford.
It seems pertinent to close with the report’s list of assumptions on which the gain in oil production from the Bakken is based:
Figure 5. Typical Bakken well production (ND DMR )
Oh, on a related note the Alaskan pipeline was running at an average of 571,462 bd in May.
So, (h/t Leanan) there now comes an Energy Study from Harvard which boldly states that this is rubbish, and that by 2020 global production will be at 110.6 mbd and these concerns that most of us have at The Oil Drum (inter alia) are chimeras of the imagination.

Figure 1. Anticipated Growth in global oil production by the end of the decade (Maugeri, Leonardo. “Oil: The Next Revolution” Discussion Paper 2012-10, Belfer Center for Science and International Affairs, Harvard Kennedy School, June 2012. )
It is therefore pertinent to begin with examining where the study (which was prepared with BP assistance) anticipates that the growth in supply will come from.
That too is shown as a plot:
Figure 2. Anticipated sources of the growth in global production by 2020 (showing only the top 23 producers). ((Maugeri, Leonardo. “Oil: The Next Revolution” Discussion Paper 2012-10, Belfer Center for Science and International Affairs, Harvard Kennedy School, June 2012.)
It is instructive, in reading this plot, to first recognize that it is a plot of anticipated production capacity, rather than projected actual production. The reason for this can perhaps be illustrated by an example. Within the current production capacity that Saudi Arabia claims adds up to 12 mbd is the 900 kbd that will come from Manifa as it is further developed and comes on line within the next few years. However at that time the increase in production is going, to some degree, to offset the declines in existing wells and producing fields that will become more severe as more of existing horizontal wells water out. Manifa is not currently in significant production, and is unlikely to be at such a level for at least another 18-months, with production being tied to the construction of the two new refineries being built to handle the oil. It is not therefore a currently instantaneously available source of oil. At a relatively normal 5% per year decline in production from existing fields, Saudi Arabia will have to bring on line (and sustain) at least 500 kbd per year of new production, and while it is likely that it can do this for a year or two more, betting that it will be able to do this and to raise production 2 mbd or more in 2020 is on the far side of optimistic. Just because a reserve exists does not mean that it can be brought on line without the physical facilities in place to produce it.
It is interesting, however, to note the report’s view on field declines in production:
Throughout recent history, there is empirical evidence of depletion overestimation. From 2000 on, for example, crude oil depletion rates gauged by most forecasters have ranged between 6 and 10 percent: yet even the lower end of this range would involve the almost complete loss of the world’s “old” production in 10 years (2000 crude production capacity = about 70 mbd). By converse, crude oil production capacity in 2010 was more than 80 mbd. To make up for that figure, a new production of 80 mbd or so would have come on-stream over that decade. This is clearly untrue: in 2010, 70 percent of crude oil production came from oilfields that have been producing oil for decades. As shown in Section 4, my analysis indicates that only four of the current big oil suppliers (big oil supplier = more than 1 mbd of production capacity) will face a net reduction of their production capacity by 2020: they are Norway, the United Kingdom, Mexico, and Iran. Apart from these countries, I did not find evidence of a global depletion rate of crude production higher than 2-3 percent when correctly adjusted for reserve growth.Sigh! I explained last time that with the change in well orientation from vertical to horizontal, that there was a change in the apparent decline rates. This is because when the wells run horizontally at the top of the reservoir that they are no longer reduced in productive length each year, as vertical wells are, as the driving water flood slowly fills the reservoir below the oil as it is displaced. This does not mean that though the apparent decline rate from the well has fallen that it will, in the ultimate, produce more oil.
The amount of oil in the region tapped by the well is finite, and when it is gone it is gone, whether from a vertical well that shows that gradual decline with time, or from the horizontal well that holds the production level until the water hits the well and it stops. I am not sure that the author of the report understands this.
The point concerning support logistics is critical in a number of instances. The political difficulties in increasing production from the oil sands in Alberta, through constraints on pipeline construction either South or West, are at least as likely to restrict future growth of that deposit as any technical challenge. The four countries that the report sees contributing most to future oil supplies are (in the ranked order) Iraq; the United States; Canada and Brazil. For Iraq he sees production possibly coming from the following fields, within the next eight years.
Figure 3. Anticipated production gains in Iraq in the next eight years. (Maugeri, Leonardo. “Oil: The Next Revolution” Discussion Paper 2012-10, Belfer Center for Science and International Affairs, Harvard Kennedy School, June 2012. )
I understand that one ought to show some optimism at some point over Iraq, but it has yet to reach the levels of production that it achieved before the Iran:Iraq War, and that was over some time ago. The EIA has shown that it is possible to get a total of over 13 mbd of production, but it requires investment and time, and some degree of political stability in the country. That is still somewhat lacking. Prior to that war Iraq was producing at 3.5 mbd, the production curve since then has not been encouraging:
Figure 4. History of Iraqi Production since the start of the Iran:Iraq War. (EIA) Recognizing that the country has problems, the report still expects that there will be a growth in production of some 5.125 mbd by the end of the decade. This appears to be a guess as to being some 50% of the 10.425 mbd that the country could potentially achieve.
As for US production, this is tied to increasing production from all the oil shales in the country, which will see spurts in growth similar to that seen in the Bakken and Eagle Ford.
I estimate that additional unrestricted production from shale/tight oil might reach 6.6 mbd by 2020, or an additional adjusted production of 4.1 mbd after considering risk factors (by comparison, U.S. shale/tight oil production was about 800,000 bd in December 2011). To these figures, I added an unrestricted additional production of 1 mbd from sources other than shale oil that I reduced by 40 percent considering risks, thus obtaining a 0.6 mbd in terms of additional adjusted production by 2020. In particular, I am more confident than others on the prospects of a faster-than-expected recovery of offshore drilling in the Gulf of Mexico after the Deepwater Horizon disaster in 2010.As I noted in my review of the Citicorp report this optimism flies in the face of the views of the DMR in North Dakota – who ought to know, since they have the data. The report further seems a little confused on how horizontal wells work in these reservoirs. As Aramco has noted, one cannot keep drilling longer and longer holes and expect the well production to double with that increase in length. Because of the need to maintain differential pressures between the reservoir and the well, there are optimal lengths for any given formation. And, as I have also noted, the report flies in the face of the data on field production from the deeper wells of the Gulf of Mexico.
It seems pertinent to close with the report’s list of assumptions on which the gain in oil production from the Bakken is based:
*A price of oil (WTI) equal to or greater than $ 70 per barrel through 2020
*A constant 200 drilling rigs per week;
*An estimated ultimate recovery rate of 10 percent per individual producing well (which in most cases has already been exceeded) and for the overall formation;
*An OOP calculated on the basis of less than half the mean figure of Price’s 1999 assessment (413 billion barrels of OOP, 100 billion of proven reserves, including Three Forks). Consequently, I expect 300 billion barrels of OOP and 45 billion of proven oil reserves, including Three Forks;
*A combined average depletion rate for each producing well of 15 percent over the first five years, followed by a 7 percent depletion rate;
*A level of porosity and permeability of the Bakken/Three Forks formation derived from those experienced so far by oil companies engaged in the area.
Based on these assumptions, my simulation yields an additional unrestricted oil production from the Bakken and Three Forks plays of around 2.5 mbd by 2020, leading to a total unrestricted production of more than 3 mbd by 2020.Enough, already! There are too many unrealistic assumptions to make this worth spending more time on. To illustrate but one of the critical points - this is the graph that I have shown in earlier posts of the decline rate of a typical well in the Bakken. You can clearly see that the decline rate is much steeper than 15% in the first five years.
Figure 5. Typical Bakken well production (ND DMR ) Oh, on a related note the Alaskan pipeline was running at an average of 571,462 bd in May.
Read more!
Labels:
Bakken,
BP,
crude oil production,
Eagle Ford shale,
Harvard,
Iraq,
Russian production,
USA
Sunday, April 3, 2011
OGPSS - The top 30 oil producers, a review
These posts have been going through the EIA list of the top oil producers in the world, over the past few weeks, I thought I might just review them collectively, but briefly, before starting to look at individual countries and oilfields. Even the posts that I have written recently have become out of date with new information (Russia increased production again in February by 20 kbd over January reaching 10.23 mbd) and then fell back to 10.2 mbd in March but at this stage, rather than focusing on such details, I am trying to generate a sense of the overall picture. It should also be recognized that I am just grabbing a snapshot of data, rather than the more detailed studies that look at the longer term, which folk such as Rembrandt, Rune and Euan provide. The simplest way to do this is to place my current estimates of production for the top 30 oil producers that I have reviewed in this series against the EIA estimate of their production in 2009.
Top 30 oil producing countries (those increasing production over 2009 are shown in red). (Click on the table to enlarge it)
It is significant to note that while Saudi Arabia was producing 8.05 mbd of crude in 2009, this has risen to 8.869 mbd on average for February as the Kingdom increased production to match the shortfalls in oil exports from Libya, inter alia. (With roughly 1.8 mbd in “other liquids” this takes total KSA production to 10.67 mbd and moves it back to the top of the League. However those numbers were from the March MOMR, which reports on February, In that report Libya was still being recorded as producing around 1.3 mbd). It is now reported that overall OPEC was not able to match the Libyan decline in March, falling about 350 kbd short, while KSA production has now reached 9 mbd, (10.8 including other liquids).
Contrary to President Obama’s recent remarks the EIA are anticipating a decline in US crude oil and liquids production over the next two years, part of which has been blamed on the change in GOM regulations. As a result it would be optimistic to anticipate much more than a US production of 8.3 mbd (and the EIA project it will be down to 8.2 mbd next year). It is unlikely that US production will increase beyond that point.
US crude and liquid fuels production – (EIA )
With China, Iran, and Canada holding relatively steady in the short term, this gives an updated total of 39.83 mbd for the top six, which is about 1.4 mbd higher than when I wrote the initial post back in February, but 500 kbd below the EIA estimate for their 2009 production. (While Russia and the KSA increased, the USA and Iran declined). Of these it is likely that only the KSA can continue to increase production much more.
In the second tier, Mexican production continues to fall, and was down to 2.556 mbd in February, with reports that it will now be an oil importer well before 2020. Exports have already fallen to 1.23 mbd, which does not bode well for customers. The United Arab Emirates (UAE) have, like the KSA, increased production to help out, though so far this has only been up to 2.394 mbd from 2.3 mbd for most of last year. (They also produce roughly another 500 kbd of other liquid fuels). By 2020 they should be able to produce up to 3.5 mbd. And in similar vein Kuwait, now producing at 2.368 mbd, up from 2,3 mbd. Kuwaiti plans are to reach 3.5 mbd by 2015, and be at 4 mbd by 2020.
The current political turmoil has even persuaded Venezuela to increase production, with OPEC reporting levels of 2.39 mbd for February, a gain of around 100 kbd. Though how long that is sustained depends on the success of the many investors that have been persuaded to invest in the Venezuelan oil sands.
In the third group Norway is declining, being now at just over 2 mbd, and even though it has just announced a major new discovery that will not come on line for at least 5 – 10 years, and in the meanwhile production will continue to fall. Norway needs more discoveries similar to this, however, to be able to sustain production levels extending into the future, since without them production will collapse.
Brazil was touted, by President Obama in his remarks about the Energy Blueprint last week, though the increasing volumes of oil that they will produce remain foreign to the United States, and though they will likely increase production up to around 4 mbd by 2020, rising domestic consumption may well take much of that increase.
Which brings us into the states that has some political turmoil. Iraq has been able to bring production back to around 2.64 mbd (according to OPEC) with the hope of reaching 3 mbd by the end of this year. At the moment about 1.2 mbd of this is exported. One of the great questions of the decade is just how close to a projected 10 mbd by 2020 that Iraq will be able to get. Sadly the continuing conflicts there, though reduced in scale, make it difficult for me to see much beyond 5 mbd by 2020.
Nigeria, which has had its own internal conflicts for some time, is going to the polls as I write this, and the expected winner is planning to overhaul the oil industry. However, if stability continues, then it might be possible to resurrect some of the older fields and perhaps increase overall production by some 350 kbd.
Algeria, which has had some turmoil, but may emerge from the ongoing protests without much change, is producing around 2 mbd of liquids. That has not changed as OPEC has moved to match the decline in volumes from Libya and other countries facing protests, and may reflect the current maximum that the country can produce. In the stability stakes I suspect that Algeria may survive without much change, although the plot I put up from Energy Export Databrowser does suggest that production may have peaked.
Algerian oil statistics (Energy Export Databrowser)
Angola is currently producing 1.7 mbd but may add some 650 kbd this year, for a total of 2.35 mbd. And that brings us to Libya, where the increased fighting, particularly over the oil refinery town of Ras Lanuf, makes it increasingly unlikely that the 1.7 mbd which came from Libya will be available again soon.
The United Kingdom is in significant decline, but recent moves to further tax the oil industry have made it possible that the decline may steepen. This because the new taxes proposed will likely reduce the profitability of the field developments proposed, discouraging their development. Recently production has run at 1.35 mbd of liquids, which is scheduled to drop to 1.3 mbd this year, and 0.94 mbdoe of natural gas, anticipated to fall to 0.85 mbdoe this year. The criticality of investment is shown in the projected production over the next 5 years, with the different colors showing the likelihood of success. Note that the grey of current production is declining at about 10%.
UK Projected Oil production (2011 UK Oil and Gas Activity Survey )
UK Projected Natural Gas production (2011 UK Oil and Gas Activity Survey )
Moving to the next tier down, Kazakhstan is now at 1.6 mbd and slowly increasing production toward a target of 3 mbd by 2020. Qatar is running at 1.4 mbd, but with almost 0.6 mbd of that in NGL. Indonesia is producing right around 1 mbd and may maintain that in the short term. It is being challenged in rank by Azerbaijan which has just incremented up to 1 mbd, a volume that is expected to continue to rise until it reaches about 1.25 mbd in 2014.
The tier that lies below 1 mbd starts with India, which is currently holding a production of around 878 kbd, and having to import increasing amounts of oil to meet demand. Given that the country also subsidizes the price, this is becoming an increasingly expensive consideration for the government. India is followed by Argentina, which is post peak and declined to 0.76 mbd most recently. Egypt is similarly declining, now to 660 kbd, but as one of the early nations to change under the most recent protests, and with the situation still somewhat fluid, it is difficult to predict how much the country will have both for itself, and for external customers, a year from now.
Oman will likely weather the current storms, and is also increasing oil production, to the point that it is moving up to pass India, with an Omani production of 863 kbd, some of which is tied to NGL production.
In the final four that produce more than 500 kbd Malaysia is barely maintaining production at 700 kbd, while Australia has fallen from 588 kbd to 540 kbd. Both are now being passed in production by Colombia, one of the “hotter” places for development at the moment, with production rising to possibly 920 kbd this year. Ecuador, which closes out the top 30, has recently increased production from 485 to 504 kbd.
That completes the top 30, and accounts for some 76.7 mbd of production. Those same countries back in 2009 were reported by the EIA as producing some 79.23 mbd of oil. Remember that world demand is anticipated to increase by somewhere between 1.4 and 1.6 mbd this year, and that of this list of 30 only 13 increased production, and the rest declined and the concern for the future becomes thus more clearly defined. (The difference between the two totals is partially explained by the loss in Libyan oil - we will see within the month how well OPEC covers that).
But it is not the overall production from the world that can be estimated that accurately, but by looking at individual countries and, in some cases, individual oilfields that we can get some better sense of what is to come. So the next step will be looking at these nations in more detail, in the weeks ahead.
Top 30 oil producing countries (those increasing production over 2009 are shown in red). (Click on the table to enlarge it)It is significant to note that while Saudi Arabia was producing 8.05 mbd of crude in 2009, this has risen to 8.869 mbd on average for February as the Kingdom increased production to match the shortfalls in oil exports from Libya, inter alia. (With roughly 1.8 mbd in “other liquids” this takes total KSA production to 10.67 mbd and moves it back to the top of the League. However those numbers were from the March MOMR, which reports on February, In that report Libya was still being recorded as producing around 1.3 mbd). It is now reported that overall OPEC was not able to match the Libyan decline in March, falling about 350 kbd short, while KSA production has now reached 9 mbd, (10.8 including other liquids).
Contrary to President Obama’s recent remarks the EIA are anticipating a decline in US crude oil and liquids production over the next two years, part of which has been blamed on the change in GOM regulations. As a result it would be optimistic to anticipate much more than a US production of 8.3 mbd (and the EIA project it will be down to 8.2 mbd next year). It is unlikely that US production will increase beyond that point.
US crude and liquid fuels production – (EIA ) With China, Iran, and Canada holding relatively steady in the short term, this gives an updated total of 39.83 mbd for the top six, which is about 1.4 mbd higher than when I wrote the initial post back in February, but 500 kbd below the EIA estimate for their 2009 production. (While Russia and the KSA increased, the USA and Iran declined). Of these it is likely that only the KSA can continue to increase production much more.
In the second tier, Mexican production continues to fall, and was down to 2.556 mbd in February, with reports that it will now be an oil importer well before 2020. Exports have already fallen to 1.23 mbd, which does not bode well for customers. The United Arab Emirates (UAE) have, like the KSA, increased production to help out, though so far this has only been up to 2.394 mbd from 2.3 mbd for most of last year. (They also produce roughly another 500 kbd of other liquid fuels). By 2020 they should be able to produce up to 3.5 mbd. And in similar vein Kuwait, now producing at 2.368 mbd, up from 2,3 mbd. Kuwaiti plans are to reach 3.5 mbd by 2015, and be at 4 mbd by 2020.
The current political turmoil has even persuaded Venezuela to increase production, with OPEC reporting levels of 2.39 mbd for February, a gain of around 100 kbd. Though how long that is sustained depends on the success of the many investors that have been persuaded to invest in the Venezuelan oil sands.
In the third group Norway is declining, being now at just over 2 mbd, and even though it has just announced a major new discovery that will not come on line for at least 5 – 10 years, and in the meanwhile production will continue to fall. Norway needs more discoveries similar to this, however, to be able to sustain production levels extending into the future, since without them production will collapse.
Brazil was touted, by President Obama in his remarks about the Energy Blueprint last week, though the increasing volumes of oil that they will produce remain foreign to the United States, and though they will likely increase production up to around 4 mbd by 2020, rising domestic consumption may well take much of that increase.
Which brings us into the states that has some political turmoil. Iraq has been able to bring production back to around 2.64 mbd (according to OPEC) with the hope of reaching 3 mbd by the end of this year. At the moment about 1.2 mbd of this is exported. One of the great questions of the decade is just how close to a projected 10 mbd by 2020 that Iraq will be able to get. Sadly the continuing conflicts there, though reduced in scale, make it difficult for me to see much beyond 5 mbd by 2020.
Nigeria, which has had its own internal conflicts for some time, is going to the polls as I write this, and the expected winner is planning to overhaul the oil industry. However, if stability continues, then it might be possible to resurrect some of the older fields and perhaps increase overall production by some 350 kbd.
Algeria, which has had some turmoil, but may emerge from the ongoing protests without much change, is producing around 2 mbd of liquids. That has not changed as OPEC has moved to match the decline in volumes from Libya and other countries facing protests, and may reflect the current maximum that the country can produce. In the stability stakes I suspect that Algeria may survive without much change, although the plot I put up from Energy Export Databrowser does suggest that production may have peaked.
Algerian oil statistics (Energy Export Databrowser) Angola is currently producing 1.7 mbd but may add some 650 kbd this year, for a total of 2.35 mbd. And that brings us to Libya, where the increased fighting, particularly over the oil refinery town of Ras Lanuf, makes it increasingly unlikely that the 1.7 mbd which came from Libya will be available again soon.
The United Kingdom is in significant decline, but recent moves to further tax the oil industry have made it possible that the decline may steepen. This because the new taxes proposed will likely reduce the profitability of the field developments proposed, discouraging their development. Recently production has run at 1.35 mbd of liquids, which is scheduled to drop to 1.3 mbd this year, and 0.94 mbdoe of natural gas, anticipated to fall to 0.85 mbdoe this year. The criticality of investment is shown in the projected production over the next 5 years, with the different colors showing the likelihood of success. Note that the grey of current production is declining at about 10%.
UK Projected Oil production (2011 UK Oil and Gas Activity Survey )
UK Projected Natural Gas production (2011 UK Oil and Gas Activity Survey )Moving to the next tier down, Kazakhstan is now at 1.6 mbd and slowly increasing production toward a target of 3 mbd by 2020. Qatar is running at 1.4 mbd, but with almost 0.6 mbd of that in NGL. Indonesia is producing right around 1 mbd and may maintain that in the short term. It is being challenged in rank by Azerbaijan which has just incremented up to 1 mbd, a volume that is expected to continue to rise until it reaches about 1.25 mbd in 2014.
The tier that lies below 1 mbd starts with India, which is currently holding a production of around 878 kbd, and having to import increasing amounts of oil to meet demand. Given that the country also subsidizes the price, this is becoming an increasingly expensive consideration for the government. India is followed by Argentina, which is post peak and declined to 0.76 mbd most recently. Egypt is similarly declining, now to 660 kbd, but as one of the early nations to change under the most recent protests, and with the situation still somewhat fluid, it is difficult to predict how much the country will have both for itself, and for external customers, a year from now.
Oman will likely weather the current storms, and is also increasing oil production, to the point that it is moving up to pass India, with an Omani production of 863 kbd, some of which is tied to NGL production.
In the final four that produce more than 500 kbd Malaysia is barely maintaining production at 700 kbd, while Australia has fallen from 588 kbd to 540 kbd. Both are now being passed in production by Colombia, one of the “hotter” places for development at the moment, with production rising to possibly 920 kbd this year. Ecuador, which closes out the top 30, has recently increased production from 485 to 504 kbd.
That completes the top 30, and accounts for some 76.7 mbd of production. Those same countries back in 2009 were reported by the EIA as producing some 79.23 mbd of oil. Remember that world demand is anticipated to increase by somewhere between 1.4 and 1.6 mbd this year, and that of this list of 30 only 13 increased production, and the rest declined and the concern for the future becomes thus more clearly defined. (The difference between the two totals is partially explained by the loss in Libyan oil - we will see within the month how well OPEC covers that).
But it is not the overall production from the world that can be estimated that accurately, but by looking at individual countries and, in some cases, individual oilfields that we can get some better sense of what is to come. So the next step will be looking at these nations in more detail, in the weeks ahead.
Read more!
Monday, February 21, 2011
Revolution - the threat to American imports
The countries of the Middle East and North Africa (MENA) are currently in the middle of a series of popular uprisings. While it is not possible to see the outcome in any of these countries at the moment, it is certain that some are likely going to end with a set of different governments and philosophies. This is not just of academic interest, since the countries involved produce collectively a significant amount of oil and natural gas, a lot of which is exported to North America and Western Europe. Looking just to the oil imports to the United States, and the natural gas imports (LNG) and averaging the volumes for October and November 2010, since there can be some wide variation month-to-month I came up with the following table, using the EIA information.
Average imports into the United States from MENA countries, averaged from October and November 2010 (EIA).
The largest concern at the moment is likely with Libya, since they supply Europe with needed oil.
Algeria, as I noted in my last Tech Talk, plays a similar role in the supply of natural gas
While it is too early at this stage to determine what the outcomes of the different struggles will be, it is realistic to expect some disruption of the current production in at least some countries, and the possibility of a reduced investment in future production, as the economies of the nations are restructured. And the consequence of that will be an increase in the price - Did somebody mention $147 a barrel?
Average imports into the United States from MENA countries, averaged from October and November 2010 (EIA).The largest concern at the moment is likely with Libya, since they supply Europe with needed oil.
Libya, a member of the Organization of Petroleum Exporting Countries, produced around 1.6 million b/d of crude oil during 2010, of which approximately 1.5 million b/d were exported, mostly to Europe. Therefore, unlike Egypt the situation in Libya has the potential to have a big impact on global oil supply. Latest news that has emerged is that oil output has stopped at Libya’s Nafoora field as workers have gone on strike.”
Algeria, as I noted in my last Tech Talk, plays a similar role in the supply of natural gas
The part of the Algerian gas in the gas balances in some European countries is significant. 86% for Portugal, 61% for Spain, 49% for Italy, 26% for Belgium, 25% for France and 21% for Turkey. Today about 97% of Algerian gas exports supply the European market next to Russia, and Norway, one of the main suppliers of the Europe. Algeria accounts for 29 percent of European Union gas imports and 15% of gas consumption
While it is too early at this stage to determine what the outcomes of the different struggles will be, it is realistic to expect some disruption of the current production in at least some countries, and the possibility of a reduced investment in future production, as the economies of the nations are restructured. And the consequence of that will be an increase in the price - Did somebody mention $147 a barrel?
Read more!
Labels:
Algeria,
Bahrain,
crude oil imports,
Egypt,
Iraq,
Kuwait,
Libya,
Morocco,
natural gas supply,
Oman,
Qatar,
Saudi Arabia,
UAE,
USA,
Yemen
Wednesday, January 26, 2011
The Mayor and the Monthly OPEC Oil Report
A couple of days ago Boris Johnson, the Mayor of London, had a column in the Biritish Telegraph about his shock at having to pay just over 80 English Pounds (EP) ($126), to fill up his Toyota Previa (at roughly $7.75 a US gallon). With the UK Treasury taking about 60% of that, he notes that the costs are likely soon (as they continue to rise) to have a significant impact o the growth of the UK economy.
The January Monthly Oil Market report (MOMR) from OPEC aims to predict the changes in the world market this year, rather than taking the longer view of either API or BP. However, since OPEC are the folks that potentially have the additional oil to bring to the market to match the growing levels of demand, their views, even in the short term, are critical.
They do expect demand to continue to grow, and just as we saw, in their estimate, a growth of 1.6 mbd in demand in 2010, they now see an additional growth of 1.2 mbd in 2011. However, in 2010, most of the growth (1.1 mbd) came from non-OPEC sources, whereas in 2011 the growth in that supply (to an average of 87.3 mbd) is expected to be only 0.4 mbd. They see demand for OPEC crude rising to 29.4 mbd from 20 mbd, for an increment of 0.4 mbd for y-o-y average changes. Which leaves the interesting question, , as to where that additional 0.4 mbd is going to come from? And the answer is that it is expected to come from an increase in the NGL from OPEC of that volume.
The OPEC executive believe that there is some 6 mbd in spare capacity within the member countries of the organization, and that this could “quickly” be made available to the market. They see OPEC production currently totaling 29.2 mbd, but expect that while that level will be sustained as we move into the spring, end user demand will fall below that level so that stocks will rise, in the short term. (They expect second quarter demand to be the lowest of the year). Looking back at last year, they report that the largest growth in demand was for diesel, with gasoline as second.
OPEC summary of global consumption for 2010.
Interestingly OPEC notes that sales of diesel powered vehicles have risen in Europe from 22% to just over 52% of all sales in 2010, though there was a drop of around 6% in the total number of cars registered in Europe.
Part of the need for a revision in the original estimates comes from the more severe winter that has happened this winter, beyond initial predictions. This has led to higher heating fuel demands.
Change in heating degree-days as a percentage of a normal winter (OPEC)
In India, because of a switch to natural gas from fuel oil, there has been an overall drop in oil demand, and while gasoline demand held steady other fuels fell.
Changes in Indian consumption over 2010 (OPEC)
Note that the above plot shows changes in demand over the year, the total Indian consumption is around 3.3 mbd.
Consumption within the Middle East, which tends to detract from exports, was seen as rising, overall by 2.3% or 160 kbd in 2010. That may rise to 200 kbd in 2011, largely driven by increased use in Saudi Arabia.
China, consumed some 8.7 mbd in November 2010. OPEC sees that for 2011 demand will average 8.8 mbd a growth of 0.6 mbd over the 2010 annual average, ending the year with a demand of 9.34 mbd. But they admit that the growth in Chinese demand has been significantly greater than their analysts had anticipated. Car sales in 2010 were an increase of 31% over 2009 numbers (some 13 million vehicles).
And in the countries of the FSU, where oil production is significantly increasing, so also is demand, with growth in demand of 2.2% being expected for 2010, or 0.1 mbd. Overall as the world economies recover OPEC anticipates that demand will also strengthen, and has had to raise its estimate both of consumption over the past year, and that predicted, in consequence.
Turning to the growth in supply, the largest increments in 2010 came from Russia (0.33 mbd), and the United States (0.44 mbd) but in 2011 those growths will sensibly be over. OPEC are also more inclined to assess future supplies with a degree of risk assigned to the estimates, and they see the risk of the estimates for Russia being erroneous as higher than for other non-OPEC countries. And they are not optimistic, at this time, over seeing large gains in production from Azerbaijan (40,000 bd) and Kazakhstan (70,000 bd), which is where BP anticipates growth.
OPEC supply relative to global demand
OPEC noted the relative inputs of petroleum products to the United States, and (going to the EIA ) that list, for last October, is:
Origin of US imports (in thousands of barrels/day (EIA)
Imports to China were led by Saudi Arabia, at 0.88 mbd, followed by Angola at 0.81 mbd and Iran at 0.43 mbd.
It's not just that it's inflationary. If Britain's businesses cannot afford to run their vans, then they will stop hiring, they will stop expanding, and tax yields will go down. It is not just for environmental reasons but for cost reasons that I am starting physically to ache for the age of the electric car. In theory, it should all be kicking off this year. Mitsubishi, Peugeot and Smart are offering electric models this month; next month it is Citroën; in March, Nissan and Tata come to market, and in April we in London are launching our Source London network of charging points.As I mentioned last week, BP does not think that the market for electric and hybrid vehicles will have a material impact of liquid fuel demand within the next 20 years. And, despite the Mayor of London putting charging points around the town, and a friend of mine telling me that condo’s in Florida are already rewriting their bye-laws so that electric car owners will be billed for charging (at present power is within the condo fee) I suspect that they may be right. But BP also said that we must, increasingly, rely on OPEC. And, since OPEC puts out a monthly report on the situation, I thought it might be interesting to look at the most Monthly Oil Market Report.
The January Monthly Oil Market report (MOMR) from OPEC aims to predict the changes in the world market this year, rather than taking the longer view of either API or BP. However, since OPEC are the folks that potentially have the additional oil to bring to the market to match the growing levels of demand, their views, even in the short term, are critical.
They do expect demand to continue to grow, and just as we saw, in their estimate, a growth of 1.6 mbd in demand in 2010, they now see an additional growth of 1.2 mbd in 2011. However, in 2010, most of the growth (1.1 mbd) came from non-OPEC sources, whereas in 2011 the growth in that supply (to an average of 87.3 mbd) is expected to be only 0.4 mbd. They see demand for OPEC crude rising to 29.4 mbd from 20 mbd, for an increment of 0.4 mbd for y-o-y average changes. Which leaves the interesting question, , as to where that additional 0.4 mbd is going to come from? And the answer is that it is expected to come from an increase in the NGL from OPEC of that volume.
The OPEC executive believe that there is some 6 mbd in spare capacity within the member countries of the organization, and that this could “quickly” be made available to the market. They see OPEC production currently totaling 29.2 mbd, but expect that while that level will be sustained as we move into the spring, end user demand will fall below that level so that stocks will rise, in the short term. (They expect second quarter demand to be the lowest of the year). Looking back at last year, they report that the largest growth in demand was for diesel, with gasoline as second.
OPEC summary of global consumption for 2010.Interestingly OPEC notes that sales of diesel powered vehicles have risen in Europe from 22% to just over 52% of all sales in 2010, though there was a drop of around 6% in the total number of cars registered in Europe.
Part of the need for a revision in the original estimates comes from the more severe winter that has happened this winter, beyond initial predictions. This has led to higher heating fuel demands.
Change in heating degree-days as a percentage of a normal winter (OPEC)In India, because of a switch to natural gas from fuel oil, there has been an overall drop in oil demand, and while gasoline demand held steady other fuels fell.
Changes in Indian consumption over 2010 (OPEC)Note that the above plot shows changes in demand over the year, the total Indian consumption is around 3.3 mbd.
Consumption within the Middle East, which tends to detract from exports, was seen as rising, overall by 2.3% or 160 kbd in 2010. That may rise to 200 kbd in 2011, largely driven by increased use in Saudi Arabia.
China, consumed some 8.7 mbd in November 2010. OPEC sees that for 2011 demand will average 8.8 mbd a growth of 0.6 mbd over the 2010 annual average, ending the year with a demand of 9.34 mbd. But they admit that the growth in Chinese demand has been significantly greater than their analysts had anticipated. Car sales in 2010 were an increase of 31% over 2009 numbers (some 13 million vehicles).
And in the countries of the FSU, where oil production is significantly increasing, so also is demand, with growth in demand of 2.2% being expected for 2010, or 0.1 mbd. Overall as the world economies recover OPEC anticipates that demand will also strengthen, and has had to raise its estimate both of consumption over the past year, and that predicted, in consequence.
Turning to the growth in supply, the largest increments in 2010 came from Russia (0.33 mbd), and the United States (0.44 mbd) but in 2011 those growths will sensibly be over. OPEC are also more inclined to assess future supplies with a degree of risk assigned to the estimates, and they see the risk of the estimates for Russia being erroneous as higher than for other non-OPEC countries. And they are not optimistic, at this time, over seeing large gains in production from Azerbaijan (40,000 bd) and Kazakhstan (70,000 bd), which is where BP anticipates growth.
OPEC supply relative to global demandOPEC noted the relative inputs of petroleum products to the United States, and (going to the EIA ) that list, for last October, is:
Origin of US imports (in thousands of barrels/day (EIA)Imports to China were led by Saudi Arabia, at 0.88 mbd, followed by Angola at 0.81 mbd and Iran at 0.43 mbd.
Read more!
Labels:
China,
crude oil price,
India,
OPEC oil production,
Saudi Arabia,
USA
Friday, May 7, 2010
Flying around the Iceland ash cloud
Yesterday I flew back from the United Kingdom through Chicago. After takeoff I glanced at the flight indicator and saw the following picture:
Screen aboard flight to the US
This caught my attention, since the flight usually goes from London up over southern Scotland and fairly close to Iceland, before coming in over Newfoundland, and through Canada into Chicago. We were obviously following a considerable detour.
Irish airports have been closed again for the fourth day this week, as the volcano transitions from just flowing lava into explosive eruptions again.
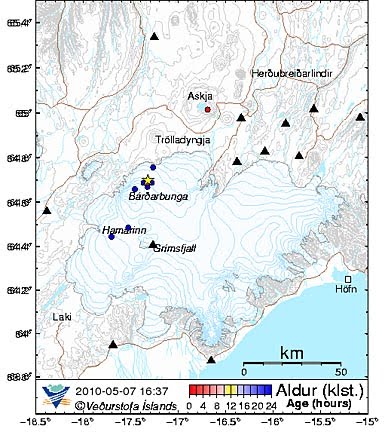
Looking at the earthquake pattern that has been taking place in Iceland, there are a couple of areas of concern:
General view of recent earthquakes in Iceland
The first is the increase in the earthquake activity at Eyafjyallajokull and the spread to Myrdalsjokull (under which sits Katla).
The second is the increasing activity up around Loki.
Note that the stars are for earthquakes above a level 3. Interesting that this is at a depth of around 1.1 km, while the last over 3 one there was at a depth of 3.3 km.
There is still not much activity in the area of Laki – which may or may not be a good sign. But since we are dealing with geological events here, with the difference in scale that they have, even an instant response can be measured in months and years, rather than hours.
This caught my attention, since the flight usually goes from London up over southern Scotland and fairly close to Iceland, before coming in over Newfoundland, and through Canada into Chicago. We were obviously following a considerable detour.
Irish airports have been closed again for the fourth day this week, as the volcano transitions from just flowing lava into explosive eruptions again.
Late Thursday, Icelandic meteorologists and geophysicists warned Eyjafjoell would emit a larger ash cloud after renewed activity, though Oddson said it had stabilised overnight.The problem is large enough that is has spread down to affect flights out of Portugal.
"Right now, we're not seeing nearly as much ash fall as in the first few days of the eruption", which paralysed European flight traffic for a week from April 14, he said.
The ash, at sufficient concentrations, poses a hazard for plane engines.
Looking at the earthquake pattern that has been taking place in Iceland, there are a couple of areas of concern:
General view of recent earthquakes in IcelandThe first is the increase in the earthquake activity at Eyafjyallajokull and the spread to Myrdalsjokull (under which sits Katla).
The second is the increasing activity up around Loki.
Note that the stars are for earthquakes above a level 3. Interesting that this is at a depth of around 1.1 km, while the last over 3 one there was at a depth of 3.3 km.
There is still not much activity in the area of Laki – which may or may not be a good sign. But since we are dealing with geological events here, with the difference in scale that they have, even an instant response can be measured in months and years, rather than hours.
Read more!
Labels:
Eyjafjallajokull,
flying,
UK,
USA,
volcanic dust
Saturday, August 8, 2009
Richard Heinberg’s “Blackout - Coal, Climate and the Last Energy Crisis”
When this new book was about to be published the editors at The Oil Drum were offered a review copy, and I was offered the chance to provide that review. Yet in a way providing that review gives me a bit of a puzzle, because the underlying premise on which the book is based is that, as David Rutledge has propounded, the world will run out of realistic coal reserves much faster than most folk anticipate. It is a point of view that I don’t completely accept, and I have posted on my disagreements with Dr. Rutledge over some of his assumptions and conclusions in the past. So I could fill this review with another regurgitation of my points of disagreement, but were I to do so I don’t think it would be a fair review.
The book sets out to collect together in sequential order a compilation of those views that state that the world will run out of coal faster than expected (including one source that disagrees); then looks at the coal remaining in the major consumers the United States; China; Russia and India; and then looks at potential exporters Australia, South Africa, Europe, South America, Indonesia and Canada, as it rounds out the major global patterns of coal trade of the world. The interplay with coal and climate is then reviewed and three different paths forward are then offered, with some closing remarks. It thus provides a relatively concise, yet comprehensive review of the coal supply future from one perspective. That is a very useful thing to have, and (perhaps I shouldn’t admit this) had I not been given a copy for review I would have bought one. Would I have got my money’s worth? Well it depends on what you are looking for. And to explain that remark let me discuss, very briefly what is in the Chapters and what I would argue about.
The fundamental questions come down to the difference between reserves and resources, and the rate at which reserves are used up. However because use changes as production declines and product cost rises, there needs to be some model of declining production. The references that the book cites rely on Hubbert Linearization, and this forms the basis then for the estimates. The text explains how it works and notes that it has often, historically, been applied to estimating how long oilfields will last. This model is then used to predict how long the current reserves of the different countries will last, based on current reserves. The resulting numbers are quite dramatic. China is shown, for example, to see a peak in production around 2020. Given that China produces, and consumes, around 40% of world production – twice that of the United States – the impact on overall world use is likely to be significant. For while, for example, Russia is quoted as having the second largest reserves, the book estimates that “Russia could well cease being an exporter within only a few years.” (Part of the problem rises because some of the eastern resources have yet to be tapped, and even when they are the coal has to be moved to the west where the demand is. Russian transportation services are considered currently inadequate to the task.)
In looking at India the author did give me my one mention, when looking at the potential increases in production that might be achieved by Coal India. But he points out (as I have) that India has a serious current fuels crisis and that increasing coal use is one way to solve it, at least transiently. I did think it a little odd that Pakistan, which also has serious supply problems, and is right next door, only got the courtesy of a passing reference “While the situation in India is not yet as bad as that in neighboring Pakistan, . .” The situation in India is not getting better – as an aside - and remembering that Bangalore is where a lot of India’s IT is located:
The situation for both India and Pakistan is that they are therefore going to be increasingly reliant on coal, and as the author points out, India is not yet set up to produce enough for its own needs, which as the above quote from this week shows, are becoming more critical.
And so these nations must turn to imports, and thus Chapter 5 deals with those countries that are most likely to provide that coal (Australia, South Africa, Europe, South America, Indonesia and Canada). Sadly it is this chapter that is the most disappointing, since the question as to whether the world will continue to have enough coal, is going to depend on the ability of the global production units to supply it. The book only recognizes South Africa (the country) as being capable of coal production in Southern Africa (the region) and being the only country there with significant reserves. However when South Africa started defaulting on power to neighboring countries at the beginning of 2008 those countries had to look to what they can do with their own resources, and in Botswana, and Zimbabwe, among others, this will mean coal. Chinese engineers have already been engaged to increase production, and there is talk of the country matching or exceeding its diamond income with the income from coal, based on a 200 billion ton reserve. (In the book South Africa is quoted as having 48 billion tons of reserves. The Botswana reserve was only a resource until S. Africa cut off supplies). Admittedly there are currently some problems getting that program going, since initial plans for electricity production exceed local needs for power.
Europe gets similar short shrift, with UK reserves and production being written off in just less than a page. And so we come to the chapter on climate impacts, that begins
I am tempted to quote the shortest sentence in the Bible. Of course, if you pick your sources, you can get a consensus on anything. For the record I objected to David Rutledge’s point of view, not only at ASPO, but later in The Oil Drum. (I wrote both about the National Academy report on coal, and the known coal reserves in the UK (determined by measurement and observation) not theoretically, and as defined in Trueman’s Coalfields of Great Britain. I listed the tonnages available from that text (though putting Scotland inexplicably in England for the table). That coal has not gone away, and some of it was being mined up to the time that North Sea Oil and Gas came ashore and turned it all (and this is key) temporarily from a reserve into only a resource.
This is not the place to get into more debate on the causes and status of climate change – or of the arguments that Richard Heinberg makes – if you believe they will reinforce that belief, if you don’t you can nit-pick over those he got wrong. But that isn’t the purpose of the chapter, rather it is to look at how the impact of an early peak in coal production will affect carbon dioxide levels. Recognizing that there is going to be a peak in the production (and use) of all three of the major fossil fuels (oil, natural gas and coal) that may be very imminent means, as the author points out, that most of the IPCC models overstate the levels of carbon dioxide that we face in the next century. And thus, initially, the news is good in that the limits of concern will not be reached.
However the author questions the consequences of further warming, being concerned over, for example, the thawing of the permafrost and the release of methane as an additional forcing to the climate, and foreseeing additional problems beyond those currently anticipated. Thus he concludes that the peaking of the fuels won’t solve the problem. On the other hand he notes that climate change concerns are reducing the number of coal-fired power plants being considered in Europe and the United States. Thus perhaps climate change will influence Peak Coal?
One way of solving both problems relies on the introduction of new technology. So in the penultimate chapter there are short reviews of IGCC; CTL; UCG; and CCS though without any projection of hope that they will do much good in resolving the problem of carbon dioxide emissions. And so, in the final chapter three scenarios for the future – one which sees no coordinated plan for the future sees the global economy in ruins by 2040; one that sees a massive investment in CCS and IGCC but yet again, despite that effort the world energy demands are not met and global ruin again arrives; and then there is a third scenario where, through strong central government action (and a declining world population) the world is saved. (I will let you buy the book to see how that happens).
Yes, I am going to keep the book around, not on my desk, but somewhere so that, in five years or so I can pull it back out and see how the world did move on. I have a number of books from the 70’s (including a couple by Daniel Yergin) that predicted the then future 20-years of growth, and how without following certain paths we would be doomed. They proved to be quite wrong, each in their own separate way, as this might prove to be. Natural gas, for example, at the moment may play a stronger role in the future than is currently projected.
But that is the fun of future projection – this book gives you some insight into the debate about the future of coal – I disagree with many of the assumptions and projections, but it does define the arguments of a given viewpoint that is receiving increasing levels of attention. So, yeah, I’m glad I read it.
The book sets out to collect together in sequential order a compilation of those views that state that the world will run out of coal faster than expected (including one source that disagrees); then looks at the coal remaining in the major consumers the United States; China; Russia and India; and then looks at potential exporters Australia, South Africa, Europe, South America, Indonesia and Canada, as it rounds out the major global patterns of coal trade of the world. The interplay with coal and climate is then reviewed and three different paths forward are then offered, with some closing remarks. It thus provides a relatively concise, yet comprehensive review of the coal supply future from one perspective. That is a very useful thing to have, and (perhaps I shouldn’t admit this) had I not been given a copy for review I would have bought one. Would I have got my money’s worth? Well it depends on what you are looking for. And to explain that remark let me discuss, very briefly what is in the Chapters and what I would argue about.
The fundamental questions come down to the difference between reserves and resources, and the rate at which reserves are used up. However because use changes as production declines and product cost rises, there needs to be some model of declining production. The references that the book cites rely on Hubbert Linearization, and this forms the basis then for the estimates. The text explains how it works and notes that it has often, historically, been applied to estimating how long oilfields will last. This model is then used to predict how long the current reserves of the different countries will last, based on current reserves. The resulting numbers are quite dramatic. China is shown, for example, to see a peak in production around 2020. Given that China produces, and consumes, around 40% of world production – twice that of the United States – the impact on overall world use is likely to be significant. For while, for example, Russia is quoted as having the second largest reserves, the book estimates that “Russia could well cease being an exporter within only a few years.” (Part of the problem rises because some of the eastern resources have yet to be tapped, and even when they are the coal has to be moved to the west where the demand is. Russian transportation services are considered currently inadequate to the task.)
In looking at India the author did give me my one mention, when looking at the potential increases in production that might be achieved by Coal India. But he points out (as I have) that India has a serious current fuels crisis and that increasing coal use is one way to solve it, at least transiently. I did think it a little odd that Pakistan, which also has serious supply problems, and is right next door, only got the courtesy of a passing reference “While the situation in India is not yet as bad as that in neighboring Pakistan, . .” The situation in India is not getting better – as an aside - and remembering that Bangalore is where a lot of India’s IT is located:
The situation is going to be grim across rural Karnataka. People in the rural areas will get electricity just for 10 hours, of which the three phase supply will be available for only five hours. It will be 14 hours of darkness in rural parts over the next 12 months. That is only if the authorities do not take recourse to unscheduled load-shedding as they have often has done in the past.
Energy Minister K S Eshwarappa on Thursday announced that Bangalore would have to bear with two hours of regulated load-shedding –– an hour in the morning (anytime between 6 am and 10 am) and another hour in the evening (anytime between 6 and 10 pm).
The situation for both India and Pakistan is that they are therefore going to be increasingly reliant on coal, and as the author points out, India is not yet set up to produce enough for its own needs, which as the above quote from this week shows, are becoming more critical.
And so these nations must turn to imports, and thus Chapter 5 deals with those countries that are most likely to provide that coal (Australia, South Africa, Europe, South America, Indonesia and Canada). Sadly it is this chapter that is the most disappointing, since the question as to whether the world will continue to have enough coal, is going to depend on the ability of the global production units to supply it. The book only recognizes South Africa (the country) as being capable of coal production in Southern Africa (the region) and being the only country there with significant reserves. However when South Africa started defaulting on power to neighboring countries at the beginning of 2008 those countries had to look to what they can do with their own resources, and in Botswana, and Zimbabwe, among others, this will mean coal. Chinese engineers have already been engaged to increase production, and there is talk of the country matching or exceeding its diamond income with the income from coal, based on a 200 billion ton reserve. (In the book South Africa is quoted as having 48 billion tons of reserves. The Botswana reserve was only a resource until S. Africa cut off supplies). Admittedly there are currently some problems getting that program going, since initial plans for electricity production exceed local needs for power.
Europe gets similar short shrift, with UK reserves and production being written off in just less than a page. And so we come to the chapter on climate impacts, that begins
Recent reports on global coal reserves, surveyed in the previous chapter, generally point to the likelihood of supply limits appearing relatively soon – within the next two decades (a contrary view is represented solely by the BGR report). According to this near-consensus, coal output in China, the world’s foremost producer, could begin to decline within just a few years.”
I am tempted to quote the shortest sentence in the Bible. Of course, if you pick your sources, you can get a consensus on anything. For the record I objected to David Rutledge’s point of view, not only at ASPO, but later in The Oil Drum. (I wrote both about the National Academy report on coal, and the known coal reserves in the UK (determined by measurement and observation) not theoretically, and as defined in Trueman’s Coalfields of Great Britain. I listed the tonnages available from that text (though putting Scotland inexplicably in England for the table). That coal has not gone away, and some of it was being mined up to the time that North Sea Oil and Gas came ashore and turned it all (and this is key) temporarily from a reserve into only a resource.
This is not the place to get into more debate on the causes and status of climate change – or of the arguments that Richard Heinberg makes – if you believe they will reinforce that belief, if you don’t you can nit-pick over those he got wrong. But that isn’t the purpose of the chapter, rather it is to look at how the impact of an early peak in coal production will affect carbon dioxide levels. Recognizing that there is going to be a peak in the production (and use) of all three of the major fossil fuels (oil, natural gas and coal) that may be very imminent means, as the author points out, that most of the IPCC models overstate the levels of carbon dioxide that we face in the next century. And thus, initially, the news is good in that the limits of concern will not be reached.
However the author questions the consequences of further warming, being concerned over, for example, the thawing of the permafrost and the release of methane as an additional forcing to the climate, and foreseeing additional problems beyond those currently anticipated. Thus he concludes that the peaking of the fuels won’t solve the problem. On the other hand he notes that climate change concerns are reducing the number of coal-fired power plants being considered in Europe and the United States. Thus perhaps climate change will influence Peak Coal?
One way of solving both problems relies on the introduction of new technology. So in the penultimate chapter there are short reviews of IGCC; CTL; UCG; and CCS though without any projection of hope that they will do much good in resolving the problem of carbon dioxide emissions. And so, in the final chapter three scenarios for the future – one which sees no coordinated plan for the future sees the global economy in ruins by 2040; one that sees a massive investment in CCS and IGCC but yet again, despite that effort the world energy demands are not met and global ruin again arrives; and then there is a third scenario where, through strong central government action (and a declining world population) the world is saved. (I will let you buy the book to see how that happens).
Yes, I am going to keep the book around, not on my desk, but somewhere so that, in five years or so I can pull it back out and see how the world did move on. I have a number of books from the 70’s (including a couple by Daniel Yergin) that predicted the then future 20-years of growth, and how without following certain paths we would be doomed. They proved to be quite wrong, each in their own separate way, as this might prove to be. Natural gas, for example, at the moment may play a stronger role in the future than is currently projected.
But that is the fun of future projection – this book gives you some insight into the debate about the future of coal – I disagree with many of the assumptions and projections, but it does define the arguments of a given viewpoint that is receiving increasing levels of attention. So, yeah, I’m glad I read it.
Read more!
Labels:
Australia,
China,
climate change,
coal demand,
coal resources,
India,
Indonesia,
Russia,
USA,
utility usage
Wednesday, April 8, 2009
2009 Energy Conference - Meeting the growing demand for liquids
The third session of the conference dealt with either electrical power generation or transportation fluids. In reality that meant, for the second topic, that the topic was crude oil. Moderated by Glen Sweetnam the panel included Eduardo Gonzalez-Pier of PEMEX, DavidKnapp of the Energy Intelligence Group and Fareed Mohamedi of PFC Energy.
The panel moved around the world looking at the prospects for increasing production from the major producers of oil, dividing them into those whose production can be anticipated to increase, and those who are known to be declining in production. The list of those increasing included the USA, Saudi Arabia, Brazil, Canada, Algeria, Nigeria Iraq and Kuwait. For those who are wondering if time has moved backwards, or question whether the world has changed enough that this site is no longer dealing with a real concern – the anticipated increase in production in the United States is relatively small and transient. It is coming from the increase in production that is being achieved by the rigs in the deep water of the Gulf, and is sadly not going to take us back to the days when the country produced more than anyone else. The panel also looked at the change in the nature of production since IOCs were replaced in the scale of greatest production by NOCs. The panel did not seem to feel that this would, in itself, make much difference since, in the end, as oil fields decline the NOCs would have to engage with the IOCs in order to acquire the technology (see closing story at the end of the post) that would allow them to enhance recovery from their remaining reserve.
I started out in the other panel (which was talking about transmission lines) and did not come into the room until they were talking about Mexican production. I did not initially know the background of the speaker, (it was Eduardo) who, shortly after I arrived, commented that Pemex expected to stabilize production at existing levels for the next several years. He and the other two speakers talked about the increase in production from KMZ that would offset the Cantarell decline, and that there would be the longer term production from Chicontepec that would continue this stable production for the next few years. Somehow my concentration wandered after this, and so my reporting on this session (that occurred just after a brisk walk and lunch) may be a little less that all that was said.
The panel opinion on Venezuela was not promising (pessimistic was the word used) with significant questions on sustainability, although there is the hope that the majors would be reinvited back with renegotiations to bring production back to a more reasonable level. (Taken with the discussion on Mexico this also encouraged me to enter a dream-like state).
They generally viewed Brazil, and Petrobras, as a success. Nigeria was described as a failed state, though there were some attempts to distinguish the success of some of the production from the troubles that were occurring because of the insurrection in the country. Looking at Algeria the debate focused on the natural gas business and there was some debate on the hydrocarbon law in that country.
Libya is a different case. Having grown accustomed to a lack of external funds and lower levels of income, the country is quite able to weather the current cut back in oil prices and the Government has enough revenue at the moment and thus is not under pressure to export more. Because of a lack of investment over the past decades, the opportunities to increase production, particularly through secondary and tertiary recovery is considered gigantic, and thus the overall view of Libyan production has to be optimistic. (It is interesting to note that China is reported to be going after the Canadian interests in Libya).
Looking at the countries of the Middle East, Iraq and Kuwait can be expected to remain relatively stable in production, though with some potential for increase. However, as with a countries in the region, the questionability of the reserve values quoted keeps coming up. (In a later question the panel felt no compunction in accepting Saudi figures for their reserves and had no concern that the values had not changed over the years. They did recognize, however, that in contrast to other countries in the Middle East they counted proved and probable in reserves, not just proved). Kuwait is “muddling through.” The damage done to the Burgan field by the Iraqi army in their retreat after the first Gulf War did more damage to the field than was at first realized. Instead of this being a field that produced under its own pressure, pressure now has to be supplied to the field to get the production out, and this has opened a need for new technology that has not yet been realized. Kuwait can, however, live on $20 oil prices.
But once one has gone through these producers, with their limited capacities to increase production, then all the other countries that were considered are in decline. They were, for example, somewhat more pessimistic than I expected about future Russian production. They felt that the inability to develop in a timely fashion some of their Eastern fields was now hurting, though their recent willingness to work again with the majors (for example Shell in their recent production) may denote a change in attitude. There is just not much happening in Central Eastern Siberia, and while they just shipped (April 1) the first LNG cargo from Sakhalin Island, it is a bit of a stretch to see overall production increasing given the declines in some of the mature fields. Although they were reassured that Statoil is going to be working with Shtokman overall they felt that the atmosphere over there was still somewhat poor for investment. Financial pressures may also act as a lever to induce change, but with the example of Gazprom held up before us, there was not a lot of optimism.
China was considered to be an interesting case, since all the news of developments from the west has gone silent, and the thought is that perhaps there are some problems with the geology in those fields, and the group would be surprised if grown was reprised in that area of the country. There was some optimism expressed, however for the chance of improving the natural gas position, particularly perhaps with coal bed methane (CBM).
Looking at Kazakhstan, this may be a country with some potential for the future, but with pipelines taking that future to China and Russia and the country having borrowed a great deal when oil prices were higher, that promise is likely to end up in one of those two countries. There is apparently some problem between the Kazakhs and the Russians.
The volumes of additional gas that have become available through the technologies that are being applied in the Barnett Haynesville and the other US gas shale deposits may also change the reserves in other countries. The panel felt that there should be some production become available in China and in Europe as a result of such fields, but the size of that gain is not yet evident, since no-one has probably yet gone and looked.
The longer term outlook for Saudi Arabia is difficult to tell, since it all depends on the succession to the king, and that is a bit of a worry, but there is so much geopolitical froth in the air, that it is hard to see the actual current situation.
In developments since the paper, and relative to the need to find new technology, I notice that PEMEX is talking of a new technology to get some additional production from Cantarell. In this idea a foam will be injected into the formation and will displace any remaining oil, with the hope of recovering an additional 3 billion barrels from the reservoir. It is a technology being developed at CSM, Stanford, the U of Texas and the University of Houston. While injecting carbon dioxide reduces viscocity and adhesion of the oil, it does not work well in providing a mechanism to move the released to to the well, and the original mechanisms have been weakened due to the water flood. In this technique the foam acts to provide that sweep mechanism.
The panel moved around the world looking at the prospects for increasing production from the major producers of oil, dividing them into those whose production can be anticipated to increase, and those who are known to be declining in production. The list of those increasing included the USA, Saudi Arabia, Brazil, Canada, Algeria, Nigeria Iraq and Kuwait. For those who are wondering if time has moved backwards, or question whether the world has changed enough that this site is no longer dealing with a real concern – the anticipated increase in production in the United States is relatively small and transient. It is coming from the increase in production that is being achieved by the rigs in the deep water of the Gulf, and is sadly not going to take us back to the days when the country produced more than anyone else. The panel also looked at the change in the nature of production since IOCs were replaced in the scale of greatest production by NOCs. The panel did not seem to feel that this would, in itself, make much difference since, in the end, as oil fields decline the NOCs would have to engage with the IOCs in order to acquire the technology (see closing story at the end of the post) that would allow them to enhance recovery from their remaining reserve.
I started out in the other panel (which was talking about transmission lines) and did not come into the room until they were talking about Mexican production. I did not initially know the background of the speaker, (it was Eduardo) who, shortly after I arrived, commented that Pemex expected to stabilize production at existing levels for the next several years. He and the other two speakers talked about the increase in production from KMZ that would offset the Cantarell decline, and that there would be the longer term production from Chicontepec that would continue this stable production for the next few years. Somehow my concentration wandered after this, and so my reporting on this session (that occurred just after a brisk walk and lunch) may be a little less that all that was said.
The panel opinion on Venezuela was not promising (pessimistic was the word used) with significant questions on sustainability, although there is the hope that the majors would be reinvited back with renegotiations to bring production back to a more reasonable level. (Taken with the discussion on Mexico this also encouraged me to enter a dream-like state).
They generally viewed Brazil, and Petrobras, as a success. Nigeria was described as a failed state, though there were some attempts to distinguish the success of some of the production from the troubles that were occurring because of the insurrection in the country. Looking at Algeria the debate focused on the natural gas business and there was some debate on the hydrocarbon law in that country.
Libya is a different case. Having grown accustomed to a lack of external funds and lower levels of income, the country is quite able to weather the current cut back in oil prices and the Government has enough revenue at the moment and thus is not under pressure to export more. Because of a lack of investment over the past decades, the opportunities to increase production, particularly through secondary and tertiary recovery is considered gigantic, and thus the overall view of Libyan production has to be optimistic. (It is interesting to note that China is reported to be going after the Canadian interests in Libya).
Looking at the countries of the Middle East, Iraq and Kuwait can be expected to remain relatively stable in production, though with some potential for increase. However, as with a countries in the region, the questionability of the reserve values quoted keeps coming up. (In a later question the panel felt no compunction in accepting Saudi figures for their reserves and had no concern that the values had not changed over the years. They did recognize, however, that in contrast to other countries in the Middle East they counted proved and probable in reserves, not just proved). Kuwait is “muddling through.” The damage done to the Burgan field by the Iraqi army in their retreat after the first Gulf War did more damage to the field than was at first realized. Instead of this being a field that produced under its own pressure, pressure now has to be supplied to the field to get the production out, and this has opened a need for new technology that has not yet been realized. Kuwait can, however, live on $20 oil prices.
But once one has gone through these producers, with their limited capacities to increase production, then all the other countries that were considered are in decline. They were, for example, somewhat more pessimistic than I expected about future Russian production. They felt that the inability to develop in a timely fashion some of their Eastern fields was now hurting, though their recent willingness to work again with the majors (for example Shell in their recent production) may denote a change in attitude. There is just not much happening in Central Eastern Siberia, and while they just shipped (April 1) the first LNG cargo from Sakhalin Island, it is a bit of a stretch to see overall production increasing given the declines in some of the mature fields. Although they were reassured that Statoil is going to be working with Shtokman overall they felt that the atmosphere over there was still somewhat poor for investment. Financial pressures may also act as a lever to induce change, but with the example of Gazprom held up before us, there was not a lot of optimism.
China was considered to be an interesting case, since all the news of developments from the west has gone silent, and the thought is that perhaps there are some problems with the geology in those fields, and the group would be surprised if grown was reprised in that area of the country. There was some optimism expressed, however for the chance of improving the natural gas position, particularly perhaps with coal bed methane (CBM).
Looking at Kazakhstan, this may be a country with some potential for the future, but with pipelines taking that future to China and Russia and the country having borrowed a great deal when oil prices were higher, that promise is likely to end up in one of those two countries. There is apparently some problem between the Kazakhs and the Russians.
The volumes of additional gas that have become available through the technologies that are being applied in the Barnett Haynesville and the other US gas shale deposits may also change the reserves in other countries. The panel felt that there should be some production become available in China and in Europe as a result of such fields, but the size of that gain is not yet evident, since no-one has probably yet gone and looked.
The longer term outlook for Saudi Arabia is difficult to tell, since it all depends on the succession to the king, and that is a bit of a worry, but there is so much geopolitical froth in the air, that it is hard to see the actual current situation.
In developments since the paper, and relative to the need to find new technology, I notice that PEMEX is talking of a new technology to get some additional production from Cantarell. In this idea a foam will be injected into the formation and will displace any remaining oil, with the hope of recovering an additional 3 billion barrels from the reservoir. It is a technology being developed at CSM, Stanford, the U of Texas and the University of Houston. While injecting carbon dioxide reduces viscocity and adhesion of the oil, it does not work well in providing a mechanism to move the released to to the well, and the original mechanisms have been weakened due to the water flood. In this technique the foam acts to provide that sweep mechanism.
Read more!
Monday, March 30, 2009
Why we aren't buying a new car (yet)
I have mentioned earlier this year that we are thinking of buying a car. In fact we are planning on replacing an eleven-year old vehicle with a new hybrid. Last year we bought, for my use, a Camry Hybrid, with which I have been quite happy, both in around the town driving and in trips from Missouri to Maine. It introduced me to the joys of Hypermiling. Motivated by a post from Robert Rapier, this time we decided to look into the Ford Fusion for the Actress. It purportedly gets better mileage that the Camry (so that we could get to Maine in 2 tanks of gas, rather than 3), and promised many of the features that we like in the Camry. We aren’t however there yet, and this is perhaps a message to the Administration about what they are doing to the car buying public.
When we started the process we recognized that there is a difference in price between the pure gasoline model (starts at $19,270) and the Hybrid (starts at $27,270). Some, but not all, of that can be made up by the better mileage (from 34 to 47 mpg on the highway). But if we drive the car for 100,000 miles, even if gas gets up to $5 a gallon (on average over that life) we would only save around $4,000 on gas. (I actually believe that, with the likely impact of Peak Oil being felt within a couple of years the $5 price is optimistic, but I might be accused of padding the argument if I went much higher). There is, however an additional incentive. Because this is a new hybrid, there is a tax incentive or credit, if one buys the Fusion. At the moment it is $3,400. Which, given that there are some other benefits, brings the price of the two models to being sensibly the same. So we get on the phone and chat with a local dealer, or two. Ah, but here is the rub; that tax credit expires at the end of March. Yup! That’s right, tomorrow night! After that, the tax credit drops to $1,700, and in October it drops further, to $850.
So we re-call our closest Ford dealer, a very nice lady, and trying to be very helpful – but she hadn’t heard of the tax credit. (A little odd, but never mind). And so we asked about seeing one. She did some checking on the Internet and there is apparently one in Kansas City, and maybe another in Indiana, but those are the closest two, and one is sold. She will get back to us as soon as she has a model that we can test drive, but has no idea when this will be. So there goes $1,700 through the window – and I suspect that there are several folks in the MidWest, who, like us, never even got a look-in at that particular incentive.
But wait, in today’s New York Times, there is a report of President Obama’s ultimatum to the car makers, in which appears the following paragraph
The only thing is, as we sit here waiting, is that we don’t know what the new plan is going to be, and when it is going to be implemented. So, in the meanwhile, we won’t be buying that car after all. And I suspect, as word gets out, that we won’t be the only ones. So if the Administration and Congress want a hint, they might decide one way or another what is going to happen with this, since if it is at the level of the European deal (2,500 euros or $3,284) then it will be worth the wait. Particularly if we can also get the hybrid credit. But until they decide, we won’t.
.
When we started the process we recognized that there is a difference in price between the pure gasoline model (starts at $19,270) and the Hybrid (starts at $27,270). Some, but not all, of that can be made up by the better mileage (from 34 to 47 mpg on the highway). But if we drive the car for 100,000 miles, even if gas gets up to $5 a gallon (on average over that life) we would only save around $4,000 on gas. (I actually believe that, with the likely impact of Peak Oil being felt within a couple of years the $5 price is optimistic, but I might be accused of padding the argument if I went much higher). There is, however an additional incentive. Because this is a new hybrid, there is a tax incentive or credit, if one buys the Fusion. At the moment it is $3,400. Which, given that there are some other benefits, brings the price of the two models to being sensibly the same. So we get on the phone and chat with a local dealer, or two. Ah, but here is the rub; that tax credit expires at the end of March. Yup! That’s right, tomorrow night! After that, the tax credit drops to $1,700, and in October it drops further, to $850.
So we re-call our closest Ford dealer, a very nice lady, and trying to be very helpful – but she hadn’t heard of the tax credit. (A little odd, but never mind). And so we asked about seeing one. She did some checking on the Internet and there is apparently one in Kansas City, and maybe another in Indiana, but those are the closest two, and one is sold. She will get back to us as soon as she has a model that we can test drive, but has no idea when this will be. So there goes $1,700 through the window – and I suspect that there are several folks in the MidWest, who, like us, never even got a look-in at that particular incentive.
But wait, in today’s New York Times, there is a report of President Obama’s ultimatum to the car makers, in which appears the following paragraph
Other salient features of the latest plan to pull Detroit out of its decades-long skid include a tax break, being started by the Internal Revenue Service at once, for auto purchases made between Feb. 16 and the end of 2009; incentives for people to turn in older, less fuel-efficient vehicles and buy more energy-efficient cars, and government-backed warrants to assure customers that they have nothing to fear by buying a car from G.M. or Chrysler.I commented favorably when I first heard of this as a means of improving German car sales, that Chancellor Merkel had introduced. And noted that Russia had also adopted the idea. In Germany, in February, it spurred a 21% sales increase (y-o-y), while U.S. sales fell 41%. So it sounds as though it is a good idea.
The concept of encouraging people to buy more fuel-efficient cars, which has been tried with considerable success in Europe, will require the cooperation of Congress. Mr. Obama said he would work with lawmakers to identify portions of the recently enacted multibillion-dollar stimulus package that could be trimmed to finance the purchase-incentive idea — and make it effective at once.
The only thing is, as we sit here waiting, is that we don’t know what the new plan is going to be, and when it is going to be implemented. So, in the meanwhile, we won’t be buying that car after all. And I suspect, as word gets out, that we won’t be the only ones. So if the Administration and Congress want a hint, they might decide one way or another what is going to happen with this, since if it is at the level of the European deal (2,500 euros or $3,284) then it will be worth the wait. Particularly if we can also get the hybrid credit. But until they decide, we won’t.
.
Read more!
Labels:
auto prices,
Germany,
hybrids,
Russia,
tax credit,
USA
Thursday, February 26, 2009
P44. Pick Points
Half-a-dozen or so stories of interest.
Well the new Administration now has a new budget, and there are significant changes for the fossil fuel industries. Oil and gas “preferences” will be eliminated for a total of $31.5 billion by 2019, and, as I noted earlier, there is the hope for carbon credit income of around another $80 billion. This is not a single shot proposal
.
The decision of the new Administration to reject Yucca Mountain as a nuclear waste repository is now final. Both the President and Energy Secretary Chu are opposed and the funding has been removed from the budget. Which is an interesting time for a company to propose processing Italian nuclear waste in Utah. Currently the case is before a federal judge in Salt Lake. However if any of this waste is shipped through Missouri it will now cost a new set of fees.
The Philippines have mandated a percentage of ethanol in their gasoline, and now are looking for ways to produce the ethanol. Cassava is the new feed crop and plans are moving ahead, against local opposition, to install some 20 plants by 2011. China has found that it is cheaper to produce ethanol from cassava than from corn or wheat where it can be grown.
Up in Canada the Ontario government is encouraging investment in solar and wind energies through the Green Energy and Green Economy Act . The concern is that to have a significant impact on need, the scale of new farms must be large, and there are still some technical issues to be resolved. There is a map of existing wind farms in Canada. In California utilities are taking a more pro-active role in encouraging solar, looking to fund 250 MW of construction over the next 5 years. The plan is to use eSolar solar thermal technology, using small tracking mirrors to focus the sunlight. Meanwhile Kender Energy is promoting a solar thermal system that heats helium as the energy transfer fluid.
In Indonesia investment is going ahead to develop a number of Geothermal Energy projects. In Georgia home owners can take the 30% credit promised in the stimulus package and add $2,000 from the state to help pay for ground source heat pumps (or geothermal heat pumps as they are called there) . It is hoped that this will allow the investment to be recouped in about 4 years., with drops in heating and cooling bills predicted to be up to 50%. (This implies an installation cost of around $20,000).
There is some suggestion that a floor has been found for oil prices, though no sooner had that been posted, then the price dropped on news of Japanese fiscal problems. Meanwhile the low price is giving Iraq some concern, since they need the revenue and are anxious to bring partners in to produce more oil.
More stories can be found at The Energy Bulletin and Drumbeat at The Oil Drum.
Well the new Administration now has a new budget, and there are significant changes for the fossil fuel industries. Oil and gas “preferences” will be eliminated for a total of $31.5 billion by 2019, and, as I noted earlier, there is the hope for carbon credit income of around another $80 billion. This is not a single shot proposal
It also recommended repealing the enhanced oil recovery credit, the marginal well tax credit, the expensing of tangible drilling costs, the deduction for tertiary injectants, and the passive loss exception for working interests in oil and gas properties.The proposals have not gone un-noticed and there is the anticipated set of reactions. There is a difficult balance to be achieved between encouraging new production and extracting justifiable revenue. Unfortunately, relative to other industries the fossil fuel industries have one awkward catch attached to them. If we don’t have the fuel, we don’t have a resurgent economy. And, paraphrasing the remarks of the Saudi Oil Minister, “we cannot abandon the energy supplies from an old fuel, before we have achieved the supplies from the new.” And we are a long way from getting that amount of energy from sun and wind. So while we can take some money from the old, and give it to the new I sure hope someone has the balance properly evaluated. West Virginia, on the other hand, is just simplifying their tax structure While taxes have a habit, in the end, of being paid by the consumers, in Russia the government has just allowed the oil companies to increase charges, at a time that production costs are falling. The rationale falls back on the need for revenue if one is to continue investing in new fields.
.
The decision of the new Administration to reject Yucca Mountain as a nuclear waste repository is now final. Both the President and Energy Secretary Chu are opposed and the funding has been removed from the budget. Which is an interesting time for a company to propose processing Italian nuclear waste in Utah. Currently the case is before a federal judge in Salt Lake. However if any of this waste is shipped through Missouri it will now cost a new set of fees.
The Philippines have mandated a percentage of ethanol in their gasoline, and now are looking for ways to produce the ethanol. Cassava is the new feed crop and plans are moving ahead, against local opposition, to install some 20 plants by 2011. China has found that it is cheaper to produce ethanol from cassava than from corn or wheat where it can be grown.
Up in Canada the Ontario government is encouraging investment in solar and wind energies through the Green Energy and Green Economy Act . The concern is that to have a significant impact on need, the scale of new farms must be large, and there are still some technical issues to be resolved. There is a map of existing wind farms in Canada. In California utilities are taking a more pro-active role in encouraging solar, looking to fund 250 MW of construction over the next 5 years. The plan is to use eSolar solar thermal technology, using small tracking mirrors to focus the sunlight. Meanwhile Kender Energy is promoting a solar thermal system that heats helium as the energy transfer fluid.
In Indonesia investment is going ahead to develop a number of Geothermal Energy projects. In Georgia home owners can take the 30% credit promised in the stimulus package and add $2,000 from the state to help pay for ground source heat pumps (or geothermal heat pumps as they are called there) . It is hoped that this will allow the investment to be recouped in about 4 years., with drops in heating and cooling bills predicted to be up to 50%. (This implies an installation cost of around $20,000).
There is some suggestion that a floor has been found for oil prices, though no sooner had that been posted, then the price dropped on news of Japanese fiscal problems. Meanwhile the low price is giving Iraq some concern, since they need the revenue and are anxious to bring partners in to produce more oil.
More stories can be found at The Energy Bulletin and Drumbeat at The Oil Drum.
Read more!
Labels:
Canada,
Cassava ethanol,
China,
geothermal,
Indonesia,
nuclear waste,
oil taxes,
Russia,
solar,
USA,
wind,
Yucca Mountain
P43. Pick Points
Half-a-dozen or so stories of interest:
I wrote earlier today about the pickup in gasoline demand that EIA had reported, and this was also noted by other folk, and the resurgence has led to a rise in the price of crude to $42 a barrel. . EIA aren’t the only ones trying to explain the situation, the Canadians also have some words on gas prices. Then there is the Rolling Stone interpretation. But rather that the technical explanation others are just blaming the rise on inflation.
.
U.S. production of crude has slightly increased in the recent past, and industry are urging Congress and the Obama administration to expand drilling offshore, because although renewable energy sources will provide some future volume, at present we still need to grow basic oil production to meet the existing need. However that argument is not strong enough to stop Interior Secretary Ken Salazar from withdrawing leases for oil shale production on federal land, while he works out a plan for higher royalty rates. The Administration is however offering a second round of leases but there is opposition from local mayors near the operations. The techniques used in getting gas out of shale in the US has proved quite successful in generating production from shales that were thought impractical, and so now the Europeans are considering using them over there . Gas from shale is still only 5% of production in the USA though it is expected to reach levels of up to 50% before too long. The Canadians are now trying it, and proving along the way that just because the technique works doesn’t means it will make money. On the other side of the country, however, shale production is already making money .
It does appear that the Shotkman field is finally going to start development, with the initial engineering work being awarded to Aker Solutions who with Technip France and SBM Offshore been awarded a 25 million EUR contract on the development of a concept definition and engineering design for the project floating production unit. Recognizing that a business opportunity lies out there Russian authorities are now ready to elaborate a new EU-Russia energy agreement, to regulate relations and help speed up progress in projects like Shtokman, the Russians say. Royal Dutch Shell however remain to be convinced. They need to be sure that they will receive production rights after exploration and development, and in Russia this is no safe bet even with a local partner.
One example of potential problem comes from the Karachaganak field, where Gazprom and the Kazakhstan Government are thinking of suspending the joint venture Of course not all projects fail for political reasons Chevron has just pulled out of Northern Taiga Neftegaz a venture with Gazprom Neft after reserves in the Pyakutinsky and Aikhettinsky fields in the Yamalo-Nenets Autonomous Area, did not meet the original projections of some 45 million tons of oil.
The latest scheme is for Total to join with Gazprom and fund a pipeline to carry Nigerian gas through the Sahara to Europe, some 2,580 miles away.
As the planting season starts in South Asia the Bangladesh Prime Minister has directed authorities to ensure power to agriculture to protect food production. The ministry of power, energy and mineral resources has stated that 130 MW of additional electricity has been added to the national grid and 700 MW more will be added by June. However the demand from the people of Bangladesh is that the government should cut the price of fuel oils. This year the price is 10% up on the last Boro season when the price was Tk 40. Bangladesh is still trying to find ways to economically exploit its high quality coal reserve . The proven gas resource are widely believed to soon be exhausted. In the absence of a decision the energy deficit is widening. This summer will witness massive load shedding.
Iranian and Russian technicians are conducting a test run of Iran’s first nuclear plant, a major step toward full operations. Work on Bushehr started 34 years ago, during the reign of the shah with the help of the German contractor Siemens but was suspended after the 1979 revolution. Pilot operations at the 1,000-megawatt light-water reactor, built with Russian assistance under a $1 billion contract, have long been delayed and it's unclear when the reactor could be switched on. Wednesday's tests were a computer run to ensure that the reactor's processes work properly. For the tests, technicians loaded a "virtual fuel" of lead into the reactor to imitate the density of enriched uranium, said Iranian nuclear spokesman Mohsen Shirazi.
There is an interest to form strong bilateral relations between Bulgaria and Italy to move forward with the South Stream gas pipeline.
More stories can be found at The Energy Bulletin and Drumbeat at The Oil Drum.
I wrote earlier today about the pickup in gasoline demand that EIA had reported, and this was also noted by other folk, and the resurgence has led to a rise in the price of crude to $42 a barrel. . EIA aren’t the only ones trying to explain the situation, the Canadians also have some words on gas prices. Then there is the Rolling Stone interpretation. But rather that the technical explanation others are just blaming the rise on inflation.
.
U.S. production of crude has slightly increased in the recent past, and industry are urging Congress and the Obama administration to expand drilling offshore, because although renewable energy sources will provide some future volume, at present we still need to grow basic oil production to meet the existing need. However that argument is not strong enough to stop Interior Secretary Ken Salazar from withdrawing leases for oil shale production on federal land, while he works out a plan for higher royalty rates. The Administration is however offering a second round of leases but there is opposition from local mayors near the operations. The techniques used in getting gas out of shale in the US has proved quite successful in generating production from shales that were thought impractical, and so now the Europeans are considering using them over there . Gas from shale is still only 5% of production in the USA though it is expected to reach levels of up to 50% before too long. The Canadians are now trying it, and proving along the way that just because the technique works doesn’t means it will make money. On the other side of the country, however, shale production is already making money .
It does appear that the Shotkman field is finally going to start development, with the initial engineering work being awarded to Aker Solutions who with Technip France and SBM Offshore been awarded a 25 million EUR contract on the development of a concept definition and engineering design for the project floating production unit. Recognizing that a business opportunity lies out there Russian authorities are now ready to elaborate a new EU-Russia energy agreement, to regulate relations and help speed up progress in projects like Shtokman, the Russians say. Royal Dutch Shell however remain to be convinced. They need to be sure that they will receive production rights after exploration and development, and in Russia this is no safe bet even with a local partner.
One example of potential problem comes from the Karachaganak field, where Gazprom and the Kazakhstan Government are thinking of suspending the joint venture Of course not all projects fail for political reasons Chevron has just pulled out of Northern Taiga Neftegaz a venture with Gazprom Neft after reserves in the Pyakutinsky and Aikhettinsky fields in the Yamalo-Nenets Autonomous Area, did not meet the original projections of some 45 million tons of oil.
The latest scheme is for Total to join with Gazprom and fund a pipeline to carry Nigerian gas through the Sahara to Europe, some 2,580 miles away.
As the planting season starts in South Asia the Bangladesh Prime Minister has directed authorities to ensure power to agriculture to protect food production. The ministry of power, energy and mineral resources has stated that 130 MW of additional electricity has been added to the national grid and 700 MW more will be added by June. However the demand from the people of Bangladesh is that the government should cut the price of fuel oils. This year the price is 10% up on the last Boro season when the price was Tk 40. Bangladesh is still trying to find ways to economically exploit its high quality coal reserve . The proven gas resource are widely believed to soon be exhausted. In the absence of a decision the energy deficit is widening. This summer will witness massive load shedding.
Iranian and Russian technicians are conducting a test run of Iran’s first nuclear plant, a major step toward full operations. Work on Bushehr started 34 years ago, during the reign of the shah with the help of the German contractor Siemens but was suspended after the 1979 revolution. Pilot operations at the 1,000-megawatt light-water reactor, built with Russian assistance under a $1 billion contract, have long been delayed and it's unclear when the reactor could be switched on. Wednesday's tests were a computer run to ensure that the reactor's processes work properly. For the tests, technicians loaded a "virtual fuel" of lead into the reactor to imitate the density of enriched uranium, said Iranian nuclear spokesman Mohsen Shirazi.
There is an interest to form strong bilateral relations between Bulgaria and Italy to move forward with the South Stream gas pipeline.
More stories can be found at The Energy Bulletin and Drumbeat at The Oil Drum.
Read more!
Labels:
Bangladesh,
Canada,
gas prices,
Gazprom,
Iran,
Karachaganak,
leases,
Natural gas,
nuclear power,
Sahara,
shales,
Shtokman,
South Stream pipeline,
Total,
USA
Subscribe to:
Posts (Atom)