Thursday, April 8, 2010

More explanations of coal mine gas and coal dust explosions

I have been asked whether it would be possible to make mines safer from methane explosions than they currently are. Firstly it has to be recognized that methane is generated with the coal as it turns from the original vegetation into the different varieties of coal, but it depends on how well the coal was sealed into the surrounding rock as to whether that methane is still there. If the overlying rock did not provide a seal, then the gas may have migrated to the surface over the millennia that it took the coal to form. Some of the topic was covered in the article by Tom Maugh discussing methane generation, but I thought it would also help to discuss two different aspects of the story. How a gas explosion could be so devastating, and how one might get the methane out, if possible before mining. If not then how to extract it from the coal before the machines get there.

Because methane is often present in coal mines, miners learned early in their career how to check and see whether there was any around. They usually did this by looking at the flame of the candle or other light they were using to work by. When there was gas present, then the yellow normal flame would be surrounded by a blue cone, the size of which depended on the gas amount present.

Methane caps on a safety lamp flame (Colliery Deputy’s Handbook) (One of the first tests I had as a miner was to be able to recognize the size and meaning of these cones)

When the miner saw the flame cone, he would first wave a shirt or towel to stir the methane into the air, hoping that the concentration would fall below 1%, but if the level built up, he might have to leave, or call for more drastic measures to get rid of it. Back in Medieval times there was an individual called The Penitent, who would wrap himself in wet rags and crawl into the mine with a candle on a long stick. Raising the candle to the roof, he would ignite the layers of methane that would gather there, before the rest of the miners came back into the working. Methane, being lighter than air would gather in the roof, when the air currents were not strong enough to mix it into the air and remove it.

The Penitent – an etching by Hildebrand

Obviously with the gas diluted and layered it would burn, but not explode –what makes the difference? Firstly it is concentration, when the concentration gets above 5% (but below about 15% since above that there is not enough oxygen in the mix) the gas will explode. And so if the gas is desorbing from the coal, or has previously desorbed into cracks in the coal structure, which are suddenly exposed by the mining process, then the gas can come out in an explosive mix with the air. Because the air currents along the face are high, that concentration is not held for long, but it is one of the two necessary conditions.

The second is that a flame source is also needed, and this would most likely be created by the action of the picks on the mining machine as they rotate through the coal, grinding it from the surface.

Picks backed away from the face so that the full pattern can be seen(ACS).

When the shearer is moving down the face that full set of picks will be set into the coal. The coal is broken free by the picks and moved over to the conveyor by the shape of the scroll that is carrying the picks that you see in the picture above. But because of the shape of the picks, as they cut into and break out the coal, they will also crush some of it to a fine powder. Some of this is fine enough (between 2 and 10 microns that it can be breathed in by the miners, and to prevent this the cutting head is surrounded by spraying jets of water that are located and operated to capture and knock down the dust onto the floor of the mine. Thus by both wetting the coal and by ventilation with a lot of air, the mines develop plans to make the area safe.

The problem however is that within the immediate area after the machine has mined the coal, and while the large coal has been carried away by the adjacent conveyor belt, the fine coal is left on the floor. Now when there is an explosion, there is a blast wave that moves down the tunnel faster than the flame front itself. This blast wave can lift up the dust that is lying on the floor and scatter it across the path of the flame front before it gets to that point. Thus a small pocket of methane exploding can generate a cloud of coal dust ahead of itself, which then ignites with a much more powerful explosion, that is self-sustaining as it keeps lifting the coal dust ahead of the blast to continue fueling the propagating flame front.

In order to stop the blast there are two precautions that mines take. The first is to cover the walls and floor with stone dust. This is usually a limestone, and so when you go down a mine you will find that instead of the surfaces being black they are white. Now if the blast lifts the dust, it also lifts the stone dust into the passage, and this stone dust quenches the flame front when it arrives. Near the face they can also place stone dust piles on planks that are set in the upper part of the passage way. This dust has to be fine enough to pass through a 240 mesh sieve. When the blast wave hits the barrier it knocks it over spilling the dust into the air, and again quenching the following flame front. In some mines the dust barrier has been replaced with water troughs that serve the same function.

The barriers are placed in the tunnels close to the face, since this is the area where stone dust can’t be laid onto the floor and walls, since the mining operation prevents it.

While there are a couple of ways of getting rid of the risk (I mentioned last time that using high pressure waterjets to cut the coal instead of picks obviates the heat source required to initiate the explosion) the process that is being increasingly used is to drain the methane from the coal before the mining process begins.

Par of the historic problem with introducing this methane drainage is that it is a different fuel resource than the coal is, and thus the mineral rights to the two may be different. But getting the methane from the coal first, provides the Coal Bed Methane (CBM) that has become an additional source of natural gas. There is a video on recovery that lasts 8 minutes on Youtube, showing how much of the drilling uses the long horizontal drilling that is becoming common for recovering gas and oil in more conventional deposits. It is that process that EPA has already decided does not threaten surface drinking water quality. Already it provides about 7% of natural gas production in the U.S. But it is not always possible to do this drainage from the surface, particularly in mountainous terrain, where it is difficult to get the necessary drilling rigs in place.

And so the gas is often still there when the coal mine is put into production? And at this point, again, based on how much gas there is, and whether it can be economically recovered for sale an analysis will likely be made on whether it would be worthwhile putting in a methane drainage network.

What is most useful is to drill long horizontal holes into the coal before the coal is mined, since in this way there are fewer problems, and the gas recovered is generally of better quality. If these weren’t drilled before mining they can be drilled from the developing tunnels of the mine, though typically these will not reach out as far as those from a dedicated surface drilling operation.

Even if there is not enough gas to make it economic to sell, with higher volumes in the coal it can be cost effective to drain the gas from the seam before it is mined, or as part of the mining process, since this can increase the safety of the mining process itself. In this case drainage holes must be drilled not only into the coal. Because the advancing face causes the coal to crack about 9 to 15 ft ahead of the longwall face itself, these cracks also work their way into the roof. So that gas can be desorbed into the cracks, and is then carried in the fractures that open around the mining operation, not only into but also over the mining operation and into the collapsing rock pile behind the face. Thus to get all the methane out of the vicinity exhaust holes need to be drilled not only into the coal ahead of the face, but also into the overlying rock, to capture all this methane, before it causes a risk.

These exhaust holes are increasingly fitted with monitoring instruments that feed data to a central computer and software that monitors levels of the dangerous gases within the mine so that, when dangerous levels are detected, then the operations may be closed down.

Sadly, however, the instruments are not sensitive enough or in enough places that they can capture any release of gas from small pockets that can ignite, with tragic results. Our thoughts and prayers remain with those who have lost loved ones in West Virginia, and in other recent disasters of this type around the world.

Read more!

A correction on the Icelandic earthquake location

Hmm! One of the problems with quoting different sources for information is that sometimes I don’t notice when they get things wrong. Thus it was yesterday when I wrote about the location of earthquakes near the Katya volcano. Let me correct the geography, since while there is some concern it is not quite at the stage yet that I thought it was.

Let’s start with an overall map of Iceland from the Icelandic Meteorological Office. This is the overall map of Iceland, which can be accessed to show where earthquakes have happened over the last 2 days.

Map of Iceland showing recent Earthquakes, stars mark those over magnitude 3.

Now zooming in to the area of most activity down near the bottom, one comes to two ice fields, the Mýrdalsjökull and the Eytafyallajokull, with the recent eruption being at the north side of the latter.


You will notice relative to the plot that I showed from Icenews yesterday


That the field that they had marked as Katla is, in fact Eytafyallajokull and that the recent quakes, while progressing toward Katla, which eruption would be the worrying one, is not quite as severe as I had described. (Katla is under Myrdalsjokull. )

Katla location (Google Earth)

The most severe eruptions have come from Laki, which is the orange flag at Skaftareldar in the following, and it is a bit North of the current eruption.

There is a line of eruption calderas from Katla up to Laki, which is up around Skaftareldar.

This should give some better location sense to the eruption and earthquake patterns:

Latest earthquake locations (note that this is changed since the uppermost figure, the site refreshes regularly)

My apologies for the inaccuracy of the previous report, the sense of concern was appropriate, the location of the site was wrong. I will try to do better.

UPDATES
I am going to park subsequent earthquake locations here for a while - yhose bigger than a 3, and where they are, since there was a second one today (13th April) and to see how this might progress I am going to give latitudes and longitudes

So the info is date, latitude, longitude and magnitude (the web site has more information including depth)

1) 4-12-2010, 63.636, -19.544, 3.1 (East side of Eytafyallajokull, apparently under the snow cap, about the same place as the first one).

2) 4-13-2010, 63.627, -19.636 3.0 (depth of 9.6 km)

3) 4-14-2010, 64.413, -17.225, 3.5 (this one is up at the other range of the likely range of erupting volcanoes)

4) 4-16-2010, 66.471, -17.588 3.6 (depth 4.5 km this one is North of the Island)

5) 04-16-2010, 66.47, -17.583 3.0, depth 4.1 km (very close to the one before it so can't be seen on the map.)

6) 04-26-2010 64.78 -17.285 3.3 (depth 2.8 km up around Loki)

7) 04-27-2010 66.396 -18.773 3.5 (depth 7.1 km offshore N of Iceland)

Oh, and while it is relatively minor, there was one on the 28th at Katla - only a 1.5, but it was at a depth of 0.8 km. Let's see if anything else develops around there.

8) 05-06-2010 64.697 -17.322 3.2 (depth 1.1 km this is around Loki again)

9) 05-07-2010 63.697 -23.244 3.3 (depth of 10.5 km off the South western tip of the island)

There were 3 significant earthquakes in the days before 19 May along the fault line North of Iceland followed by

10) 05-19-2010 66.308 -18.852 4.0 (depth 5.9 km)

11) 05-19-2010 66.144 -18.286 3.3 (depth 1.1 km)

12) 05-19-2010 66.321 -18.599 3.4 (depth 4.2 km)

13) 05-21-2010 64.073 -20.562 3.1 (depth 4.5 km)

14) 06-06-2010 66.618 -17.865 3.0 (depth 3.1 km) (offshore North)

15) 06-06-2010 66.482 -17.562 3.4 (depth 9.5 km) (offshore North)

16) 06-21-2010 64.815 -17.281 3.0 (depth 5.8 km) Kistufell which is up near Loki, north of Grimsfjall

17) 06-27-2010 66.721 -17.721 3.7 (depth 1.1 km offshore North)

18) 06-28 - 2010 64.669 -17.353 3.1 (depth 1 km NE of Bardarbunga - up by Loki)

19) 07-17-2010 64.672 -17.426 3.0 (depth 1.8 km, 6 km NE of Bardarbunga - up by Loki)

20) 07-21-2010 66.673 -17.991 3.1 9depth of 12.4 offshore Grimsey - with a whole slew of adjacent smaller ones)

21) 07-22-2010 66.395 -17.822 3.0 (Depth of 1.2 km offshore Grimsey as with the surrounding ones)

22) 07-23-2010 66.650 -17.946 4.1 ( depth of 22.5 offshore Grimsey - continuing lots of little ones)

23) 07-23-2010 66.656 -17.997 4.1 (Depth of 13.4 km offshore Grimsey - near last two)

24) 07-24-2010 64.038 - 21.231 6.4 (depth of 1.3 SSW of Hromundartindi)

25) 07-26-2010 66.676 -17.983 3.4 (depth of 12.7 km 15 km N of Grimsey)

26) 07-26-2010 66.649 -17.933 3.0 9depth of 13.4 km 12.4 km NNE of Grimsey)

27) 08-03-2010 64.429 -17.225 3.0 (1.1 km deep NE of Grimsfjall - near Loki)

28) 08-03-2010 66.689 -17.988 3.6 (14.9 km deep N of Grimsey)

29) 08-04-2010 66.636 -17.961 3.0 (10.7 km deep NNE of Grimsey)

30) 08-12-2010 64.492 -17.741 3.0 (1.7 km deep 3.3 km E of Hamarinn)

31) 08-19-2010 64.741 -17.266 3.4 (2 KM Deep 5.2 km SSW of Kistufell)

32) 08-19-2010 64.742 -17.244 3.1 (3.6 km deep 4.6 km SSW of Kistufell)

33) 08-19-2010 64.749 -17.234 3.2 (depth 2.3 km 3.7 km SSW of Kistafull)

34) 08-19-2010 64.740 -17.24 3.0 (depth 2.9 km 4.8 km SSW of Kistafull) (I.e. N of Bardarbunga near Loki)

35) 08-23-2010 64.705 -17.281 3.4 (depth 0.7 km 9.1 km SSW of Kistafull)

36) 09-14-2010 66.529 -17.808 3.6 (depth of 13.3 km 9.0 km E of Grimsey)

37) 09-14-2010 66.530 -17.812 3.4 (depth of 11 km 9.1 km ESE of Grimsey)

38) 09-14-2010 66.506 -17.794 3.0 (depth of 8.4 km 10.3 km ESE of Grimsey)
All these last 3 were offshore and within 90 minutes of one another. They were followed by a bunch of shallower and weaker ones.

39) 09-19-2010 64,694 -17,309 3,5 (depth of 1 km, 10,8 km SSW of Kistufell)

40) 09-19-2010 65,105 -16,488 3,0 (depth of 1.1 km 5,1 km WNW of Herðubreiðartögl)

41) 09-19-2010 66,377 -17,070 3,6 (1.4 km deep 28,8 km WNW of Kópasker)

42) 09-19-2010 66,349 -17,049 3,6 (1.1 km deep 27,2 km WNW of Kópasker)

The above 4 shallow quakes all occurred within 90 minutes of one another.

43) 09-22-2010 66,922 -18,359 3,5(4.5 km deep 28,7 km SSE of Kolbeinsey)

44) 09-23-2010 64,401 -17,312 3,0(2.9 km deep, 1,9 km WSW of Grímsfjall)

45) 09-25-2010 64,504 -17,762 3,5 (Surface 3,0 km NE of Hamarinn)

46) 09-25-2010 64,504 -17,747 3,9 (0.8 km deep 3,6 km ENE of Hamarinn)
The above 2 seem part of the same process and are ENE of Grimsfjall)

47) 10-04-2010 64,714 -17,320 3,1 (0.4 km deep 9,1 km SW of Kistufel)l

48) 10-04-2010 64,509 -17,749 3,6 (0.8 km deep 3,8 km NE of Hamarinn)

49) 10-07-2010 66,397 -19,509 3,4 (3 km deep 37,7 km NW of Siglufjörður)

50) 10-24-2010 63,488 -23,951 3,0 (1.1 km deep 7,2 km W of Eldeyjarboði) which is way South

51) 10-28-2010 65,165 -19,605 3,7 (1.1 km deep 33,1 km N of Hveravellir)

52) 10-28-2010 65,139 -19,581 3,1 (1.1 km deep 30,2 km N of Hveravellir)

53) 10-31-2010 65,139 -19,540 4,0 (1.1 km deep 30,1 km N of Hveravellir)

54) 10-31-2010 65,162 -19,596 4,0 (o.9 km deep 32,8 km N of Hveravellir)

55) 11-03-2010 64,811 -17,198 3,3 (5.1 km deep 3,4 km N of Kistufell)

56) 11-04-2010 67,202 -16,750 3,8 (15.5 km deep 83,4 km E of Kolbeinsey)

57) 11-05-2010 66,915 -18,099 3,0 (1.1 km deep 36,1 km SE of Kolbeinsey)

58) 11-05-2010 66,574 -18,052 3,4 (9.1 km deep 4,1 km NNW of Grímsey)

59) 11-10-2010 65,703 -16,784 3,0 (3.3 km deep 1,7 km SW of Kröfluvirkjun)

60) 11-11-2010 63,953 -22,071 3,1 (6.9 km deep 5,1 km ENE of Keilir)

61) 11-14-2010 64,260 -16,523 3,0 (1.1 km deep 28,2 km NNE of Hvannadalshnjúkur)

62) 11-25-2010 68,549 -16,687 3,3 (6.4 km deep 176,6 km NNE of Kolbeinsey)

63) 11-25-2010 64,506 -17,579 3,5 (1.1 km deep 11,2 km E of Hamarinn)

64) 12-02-2010 65,096 -16,422 3,1 (1.5 km deep 1,9 km WNW of Herðubreiðartögl)

65) 12-13-2010 63,904 -22,045 3,1 (4.6 km deep 2,1 km NNE of Krýsuvík)

66) 12-15-2010 66,158 -17,840 3,0 9(9.2 km deep 0,9 km S of Flatey)

67) 12-16-2010 66,705 -18,050 3,9 (14.7 km deep 18,3 km N of Grímsey)

68) 12-17-2010 66,459 -17,356 3,2 (6.1 km deep 30,4 km ESE of Grímsey)

69) 12-17-2010 63,882 -19,791 3,0 (9.7 km deep 13,6 km SSW of Hekla)

70) 12-17-2010 66,630 -17,878 3,0 (7.9 km deep 11,4 km NNE of Grímsey)

71) 12-22-2010 66,337 -17,401 3,0 (8.4 km deep 27,3 km NE of Flatey)

72) 12-23-2010 66,663 -17,945 3,0 (11.9 km deep 13,8 km NNE of Grímsey)

73) 12-23-2010 66,614 -17,807 3,0 (1.1 km deep 12,0 km NE of Grímsey)

74)12-24-2010 66,676 -17,985 3,0 (13.5 km deep 15,0 km N of Grímsey)

75)12-24-2010 66,347 -17,509 3,0 (1.1 km deep 25,0 km NE of Flatey)

76)12-24-2010 66,242 -17,250 3,0 (1.1 km deep 22,6 km N of Húsavík)

77)12-31-2010 64,761 -17,178 3,3 (3.5 km deep 2,6 km SSE of Kistufell)

78)01-02-2011 64,757 -17,191 3,8 (2.1 km deep 2,8 km SSE of Kistufell)

79) 01-06-2011 63,627 -23,336 3,0 (2 virtually simultaneous one 1.1 km dee, one 17 km 6,2 km SSW of Geirfugladrangur)

80)01-10-2011 63,587 -23,607 3,7 (10.4 km deep 14,6 km NE of Eldeyjarboði)

81)01-13-2011 64,400 -17,250 3,8 (14.4 km deep 1,2 km ESE of Grímsfjall)

82) 01-25-2011 64,514 -17,667 3,0 (1.1 km deep 97,5 km ENE of Hamarinn)

83) 02-02-2011 64,682 -17,361 3,1 ( 1.4 km deep 9,2 km ENE of Bárðarbunga)

84) 02-03-2011 64,764 -17,266 3,3 (1.1 km deep 3,3 km SW of Kistufell) Not that far from the last one

85) 02-06-2011 64,501 -17,609 3,4 (1,1 km deep, 9,7 km E of Hamarinn)

86) 02-06-2011 64,689 -17,020 3,3 (1,1 km deep 13,6 km SE of Kistufell)

87) 02-06-2011 64,753 -17,256 3,0 (2,7km deep 3,8 km SW of Kistufell)

88) 02-12-2011 64,587 -20,655 3,6 (2,6 km deep 16,0 km SE of Húsafell)

89) 02-12-2011 64,347 -20,711 3,3 (1,1 km deep 6,8 km SSE of Skjaldbreið)

90) 02-12-2011 64,556 -20,636 3,4 (1,0 km deep 17,5 km NNE of Skjaldbreið)

91) 02-12-2011 64,583 -20,618 3,2 (1,1 km deep 17,5 km SE of Húsafell)

92) 02-25-2011 64,402 -17,281 3,3 (1,1 km deep 0,5 km SW of Grímsfjall)

93) 02-27-2011 63,928 -22,034 4,1 (1,1km deep 4,8 km NNE of Krýsuvík)

94) 02-27-2011 63,934 -22,036 3,1 (7,5 km deep 5,4 km NNE of Krýsuvík)

95) 02-27-2011 63,920 -22,030 3,4 (1,6 km deep 4,0 km NNE of Krýsuvík)

96) 02-27-2011 63,892 -22,354 3,0 ( 4,4 km deep, 4,1 km WSW of Fagradalsfjall)

97) 03-02-2011 63,894 -22,052 3,6 (3,8 km deep 1,0 km NE of Krýsuvík)

98) 03-02-2011 63,897 -22,054 3,0 (6,4 km deep 1,2 km NNE of Krýsuvík)

99)03-12-2011 64,505 -17,512 3,1 ( 1,1 km deep 14,4 km E of Hamarinn)

100) 05-21-2011 64,369 -17,201 3,6 (1,1 km deep 5,3 km SE of Grímsfjall)

101) 05-21-2011 64,154 -17,642 3,3 (1,1 km deep 30,2 km ENE of Laki)

102) 05-21-2011 64,366 -17,266 3,0 (1,1 km deep 4,3 km S of Grímsfjall)

103) 05-21-2011 63,905 -18,523 4,6 (1,1 km deep 23,1 km SW of Laki)

104) 05-21-2011 64,049 -17,770 3,1 (3,3 km deep 22,7 km E of Laki)

105)06-05-2011 66,572 -17,830 3,1 (13,1 km deep 8,6 km ENE of Grímsey)

106)06-17-2011 63,642 -19,159 3,3 (1,1 km deep 4,5 km E of Goðabunga)

107)06-17-2011 63,637 -19,108 3,5 (4,8 km deep 6,3 km N of Hábunga)

108)06-18-2011 64,585 -20,619 3,3 (2,1 km deep 17,4 km SE of Húsafell)

109) 07-05-2011 66,242 -16,889 3,1 (5,0 km deep 20,6 km WSW of Kópasker)

110) 07-06-2011 63,638 -23,344 3,1 (10,1 km deep 5,3 km SSW of Geirfugladrangur)

111) 07-06-2011 63,491 -22,937 3,0 (1,1 km deep 26,5 km SSE of Geirfuglasker)


Read more!

Tuesday, April 6, 2010

An earthquake in Iceland

Update Since I wrote this post I have discovered that Icenews had the location of the Katla volcano wrong in the figure below. I have corrected the location in a separate post. My apologies.

There have been a couple of earthquakes that have exceeded magnitude 7 over the last few days. First there was the 7.2 magnitude earthquake near Mexicali on Sunday, which destroyed more than 5,000 homes. Then there was the 7.7 magnitude earthquake that struck Northern Sumatra at 5:15 pm (CST) today. The latter was smaller and will apparently not produce a tsunami of the type that killed over 230,000 people in 2004, in Sumatra. Nevertheless the impact is likely to have been severe.

And yet I keep checking with the erupting Eyjafjallajokull volcano in Iceland, that began spewing lava on March 21st. Remembering that it has usually presaged a much more violent eruption from the nearby Katla volcano, which being under the Mýrdalsjökull glacier, will likely generate results that are expected to be much more severe. Vulcanologists have been expecting an eruption from the volcano for some time. It forms part of the set with Laki and Eldgia which are considered to be some of the most powerful volcanoes in the world.

Thus when I read that there has just been a 3.7 magnitude earthquake in the Katla region, moving away from the initial eruption and between Katla and Laki, my concerns just grew a little. There are already reports of toxic gas emissions from this smaller eruption, which could warn of much greater problems if much higher volumes of gases such as sulfur dioxide are ejected with a subsequent eruption from the volcanoes to the North-East of the current eruption.

Location of the earthquake relative to Katla, Eyjafjallajokull is further west.

Read more!

The Mining Disaster in West Virginia

The news of the death of at least 25 coal miners at the Upper Big Branch Mine in West Virginia is a reminder of the human costs that are incurred in the provision of fossil fuels. Although American mines have grown considerably safer over the years, the nature of the work can mean that when there is an explosion in a mine, that there are multiple fatalities because of the layout which is most effective for getting the coal out. It also underlines the higher costs that must be met when mining coal from underground operations, rather than the more visible, and criticized surface mining operations.

In the United States this is the largest mining disaster in more than 25 years at a mine that produced 1.2 million tons of metallurgical coal last year. Because of the pressures on surface mining operations Massey Energy were moving an increasing percentage of their production to the underground. The mine uses longwall techniques as the main means for producing coal and so I thought that it might be helpful if I reposted some of the information on that technique.


Part of the problem in controlling the ignition of gas in such an operation is that the mining machine breaks out the coal in relatively small fragments, by rotating a drum laced with picks against the coal face.

Surface test of a shearer used in longwall (Bureau of Mines Bruceton)

The fine crushing of the coal can lead to the release of methane gas (natural gas) that is found and formed with the coal. Levels of the gas are measured, and controlled by sending enough air down the face to dilute the level of the gas below that at which it is at risk of ignition or explosion. However within the space that the drum is carving out it is not always possible to get that air flow into the area to ensure that dilution is immediate.

At the same time if there are layers of rock within the coal, then the pick can rub against these and generate sparks, and heat up the rock to the point that it becomes hot enough to ignite any methane pockets that have been released. Once that ignition starts the very fine coal dust that is also a part of mining (as the above picture shows) means that this can also ignite, intensifying the resulting explosion. That becomes particularly deadly, given the geometry of the longwall.

And to explain that let me repost something I had written about before.

Back in the mid-1800's underground mining was usually carried out by crews of men and boys, where the coal was first removed by undercutting the coal seam manually with a pick, to a depth of about 3 ft. The bulk of the coal was then broken down to this slot and the fragments (ideally about 4-inches in size) were shoveled and hand-loaded into pit tubs, to be hauled away. A good day's work was about 20 tubs.

As the miners drove the tunnels (also called entries, headings, drifts, drives etc) into the coal they left pillars between the tunnels to hold the roof up. However in about 1870, and possibly in the Lancashire coalfield in the UK, they discovered that if they put these entries together, they could develop a way of getting all the coal out from that section (or panel). How could they get away with this?

Well there are two things that make it possible. Firstly, when you make a hole in the ground, the rock pressure that was applied to the rock (about the same pressure as the depth of the hole) has to move somewhere. And it moves just a little so that the weight of the ground over the hole is carried by the rock on either side. However, what happens if this additional load is too high for the rock and it fails?

Well if the rock were just a thin column it would collapse, but if it were thicker, then the weight would just move further into the coal. Now if we came along and moved the coal that had failed, then the hole would just continue to get bigger. But if we leave the coal in place, then the broken coal acts to confine the coal further into the solid. And this confinement gets higher, as the failing pressure continues to move into the wall. And what happens is that this confinement builds up the strength of the coal, so that at some distance into the wall (or face) the coal strength reaches a point that it can carry the weight of the ground above the working area.(For a simple analogy think of a deck of cards, which individually cannot bear weight, but when held together by a rubber band, or a carton, can support quite a bit of weight).

The second thing to know is that when a layer of rock breaks the rock lumps when piled together occupy more space than the solid rock. As a rule-of-thumb the bulking is about 60%. So that if we let the roof over the working area break and collapse, after we have taken the coal out, then by the time about twice the seam height of rock has collapsed, it has filled the hole where the coal used to be, and reaches up to the solid layers of rock above, to hold them in place. The confinement of the rock around each piece allows it to regain some strength, and so collectively the broken rock behind the working face (called the goaf or waste) will carry the weight of the ground from about twice the seam height, all the way to the surface, and with the other end of the "bridge" as it were resting on the confined coal ahead of the working face.(While the width of this bridge varies with depth, coal and rock strength etc, for an initial estimate you can imagine it as being around 500 ft).


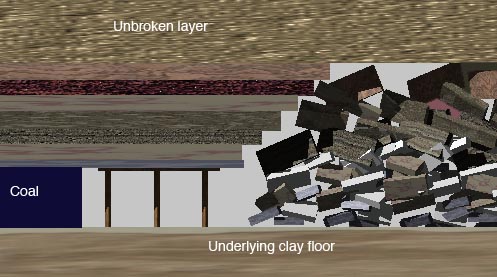
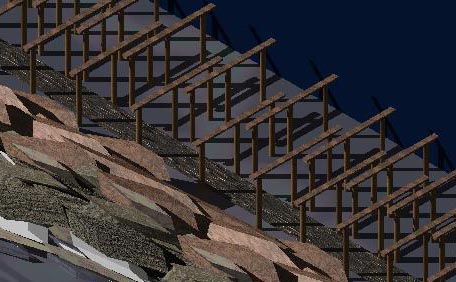
What this means is that the miner, working at the face, needs to support only the rock that is up about twice the seam height above his head (in those days women did not do the actual mining). And this could be done with relatively small tree limbs, called props. However, because the rock could break into pieces, the prop support would be distributed, by having a plank, or half split timber, as a bar on top of the prop. Putting one prop at each end thus gave a sort of "goal post" support. Thus, along the face, there would be, at about 4-5 ft intervals, these prop supports holding the roof up.(The coal is made slightly blue in the pictures to give a better contrast - sorry!)

Now, to get the coal out it was possible to put in mechanical assistance. The first step was to use a machine, rather like a large chain saw, that was pulled along the face, undercutting the coal, to give that first free surface. At the same time holes were drilled along the face, about 6 ft apart, with a stick of dynamite in each one. After the face was cut the coal was blasted down between shifts (7.5 hours) then the collier shift would come in and each man would have about 10 yards of face to load the coal from, and to re-support. To get the coal from the face, a rubber conveyor belt was run along the back end of the supports that were in place before the blast, and the coal would normally not break that far from the face. As the miner shoveled he would also put in a new set of timbers, overlapping the old, and supporting the new working area. Typically this would take another seven hours, with an ideal seam height being about 4.5 ft. Above that the coal volume to move was much greater, and below that it got a bit awkward. For example, below 2 ft thick you lie on your back, with a prop under your shoulder and shovel over your head - how would I know? Yes, there was a reason to go to college).


In the third shift, the men would come in and break down and move over the conveyor belt, and then remove the last row of wooden supports, bringing the roof down, beyond the new line of supports.(Smart folk would use a come-along and a chain to pull down the props, young idiots (guess who) would go in with an axe to chop them first).

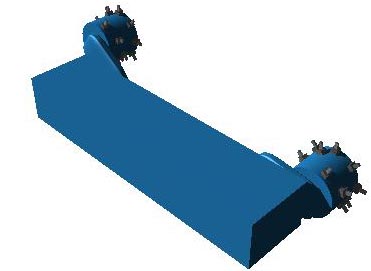
The process needed mechanization and this required three different components to work. And these all came together in a period around 1960 - 65. Firstly there was a better way of removing the coal. The machine that was developed initially took the coal cutter power pack, and turned it on its side. By then putting a drum with picks on it, over the shaft to replace the cutter bar, the Anderton shearer was invented (named after its inventor). The drum rotated, and a shaped cover behind it moved the broken coal over onto the second part of the process.


This is a rigid framed conveyor, made up of segments that can move against one-another, and with rigid metal walls. The shearer can ride either on top of, or along side this conveyor, and load the coal onto it. The conveyor then carries the coal to the end of the face, and onto a second conveyor, that carries the coal out of the panel.

It is the third part of the concept that makes the whole system viable, because we now add the powered roof support. These are sets of hydraulic rams that ride on one plate of steel, pressing a second up against the roof. They are connected to the conveyor by a horizontal ram.

The mining process is thus that first the shearer moves down the coal face, grinding off the coal to a depth of around 2 ft. After it passes, the rams on the roof supports, in turn, are released, so that they drop away from roof contact. The horizontal ram is retracted and the support moves forward until it contacts the conveyor. It is then raised, and re-supports the roof. Each support moves forward it turn, so that the miners (which now include women) are always under a roof of steel. After the supports are re-established, the horizontal ram extends, pushing the conveyor over into the open space where the coal has just been mined. The exposed roof rock then collapses into the open space behind the back of the supports.

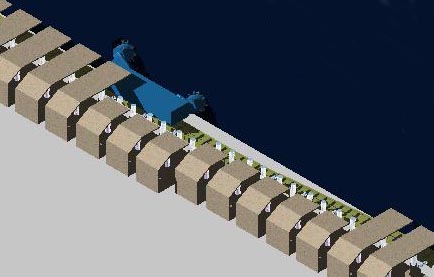
If one were to look at the operation from above, and with the roof removed, it might look a little like this:


I have taken away some of the canopies of the shields so that you can see the conveyor snake after the shields move forward. The view closer in shows the conveyor and supports better.


Because of the way the roof rock weight distributes, it is usual to drive entries out to the edge of the panel first, and then mine back to the main drive tunnels, rather than mining away from the mains. In part this is to keep the excess weight from acting on the tunnels the miners travel through. Because of the collapse of the roof as the coal is removed the panels usually start at the back of the section (known as a panel) and mine toward the main transport tunnel, with coal and people travelling in roadways on either side of the panel.

Initial stages of a longwall panel development, showing how the access tunnels from the main haulage are located.

Over time the ground movement works to the surface, and the surface of the ground will drop, by some significant percent of the height of the coal removed, since the rock in the waste will crush and consolidate. This is called subsidence, and if the mining is carried out badly, then it can cause significant damage to surface buildings. However, if done properly, it should not.

I will cite two examples of the latter. Firstly in the height of mining and before North Sea Oil and Gas, Britain mined coal at a high rate of production, from where it was found. This included under the city of Coventry, which was at the time home to large manufacturing plants, with precision lathes. By back-filling behind the face props with the blown-in waste from the colliery treatment plant (called stowing the goaf), the waste was filled, and the ground movement minimized to the point that I only heard of one factory being closed for less than a week to realign their lathes.

The second example was in Duisburg in Germany, and a different problem. The town is a port on the Rhine, and over the centuries the river had eaten into the bed, so that the quays were becoming too high above the water for easy loading of the barges, and the town was losing business. They went to the local coal company and asked them to mine out seams under the harbor, and thus to lower the quays to bring them back in reach of the water. The miners complied, and lowered the area by over 11 ft. The area that was mined included highway overpasses, and a Shell oil storage facility in the middle of the river. The story goes that the tank farm manager went to the miners and asked them to tell him when they were going to start, so that he could drain the tanks as a precaution. They pointed out that the farm had actually already been lowered about 3 ft, as I recall the story.

As usual this has been rather a superficial description of a process, but hopefully it gives you more of a sense as to what goes on in a longwall mining operation.

Additional comment : It is possible to mine coal without using picks in a longwall, though it is a technology that has found much greater application in other industries, beyond mining.

Our thoughts and prayers go out to those in West Virginia at this time.


Read more!

Sunday, April 4, 2010

The Future of Oil Shale

I have spent some time over the past few weeks writing about various different ways of producing oil from oil shale. While it is now about time that I move on to other topics, David Hagen was kind enough to post the website that gives access to the presentations from the Oil Shale Symposia that I mentioned at the beginning of this mini-series.

The papers from the 28th Symposium in 2008 illustrate that while the current price of oil may not currently justify the development of large oil shale operations, it can justify the investment of research dollars to seek better ways of producing oil from these fields. This is particularly true if one accepts one of the criteria that Exxon used to justify their ongoing interest, namely that they project that world energy demand will be 40% higher in 2030 than today, with more than 80% of that energy still being supplied by fossil fuels. Exxon believes that the oil from oil shale will play a significant role in that supply.

And so I am going to skip lightly through the papers, and highlight anything that catches my eye.

Exxon Mobil, for example, are looking into Electrofracking the shale. The idea of using electrical power directly to break rock has been around for some time. Erich Sarapuu wrote his doctoral dissertation on this in the 60’s as I recall, unfortunately before the internet made it easy to find much information, though he went on to form Electrofrac Corp. And there have been more recent papers. However it appears that by putting electrically conductive materials into the fractures and passing current through them, Exxon Mobil both limits the surface footprint, and the amount of material that has to be heated to achieve the transformation of the kerogen. Higher rock stress can apparently also lighten the oil produced, based on lab tests. Since the time of the Symposium, Exxon Mobil has run a successful field test at their Colony Mine site. but has been quoted as commenting:
ExxonMobil sees tantalizing prospects for shale: up to 162,000 barrels of oil per surface acre at a 50 percent recovery rate. The results suggest a 3-to-1 ratio of energy recovered over energy expended to obtain it, McGinn said...It appears ExxonMobil can make its process work using about 1.5 barrels of water for each barrel of oil produced, he said.
Even under the most optimistic of scenarios, ExxonMobil sees no production coming from oil shale for 10 to 24 years, McGinn said.


Exxon Mobil plan for oil production from oil shale

Shell have also reported that the ground conditions can change the quality of the oil produced, and that slower heating increases oil quality, while higher pressures increase the hydrogen content of the oil. Field tests confirmed the lab information. (And for those who wondered about the ability to make jet fuel from oil shale, they also added this table:

Jet fuel from oil shale (Courtesy of Shell and DoD) (the table has additional pages)

In contrast Chevron has looked at sending hot gases that are surface generated down and through induced fractures:

Chevron concept for oil shale development (NETL )

The U.S. Bureau of Mines did look at fragmenting the oil shale beds in place and then igniting them for an in-situ variation on the Ecoshale process I described last time (in the sense that the shale is heated within a geological retort).

Bureau of Mines test at Rock Springs (NETL )

And I have previously written about the paper on the ground freezing test that Shell has carried out:

Shell freezing test

There is work being done by Total (who slipped in a comment that oil supply may peak before 2015. They see the world potential supply from oil shale as being measured in trillions of barrels of oil. They are collaborating with Petrobras in surface retorting programs and along with other companies encouraged by the Jordanian government evaluating deposits in Jordan, which is also examining microwave heating and Morocco. They are collaborating with Independent Energy Partner on geothermal fuel cells for in-situ heating and looking at downhole radio-frequency heating. There has been a subsequent paper on the Moroccan oil shale development.

The use of radio frequency heating was described, with the Bechtel/Parsons conclusion that the process could yield an EROI of greater than 3. And the potential for using wind energy to power the microwaves was advanced.

The program being developed by EGL where the heating is supplied around the outside of a series of wells was also included.

Representation of the EGL plan

There is a report available on unconventional fuels that looks at oil shale, transmitted in December 2008. There was also, from August of that year, a complimentary list of companies carrying out research into oil shale and tar sands.

The Power Engineering Institute in Moscow discussed some of the work being done in Russia on both their deposits and those in other parts of the world. The Narva thermal refinery in Estonia has, for example, increased production to over a million barrels exporting about 40% of the product. The plant uses ash as a pre-heating step, and used automobile tires as part of the feed stock. A better list of some of the oil shale projects can be found at the Oil Shale Association.

One thing is clear from perusing both the Proceedings and the additional papers that I have chased up to try and update some of the information. The Oil Shale resource around the world will become an increasingly viable one as the price and availability of conventional oil become more of a strain on the world and individual nations. This is being recognized by countries such as Jordan, China and, Thailand. Plans range from continued examinations of more exotic methods for oil recovery, to the more conventional mining and surface retorting. The level of activity appears to be rising again, and thus while the continuous posting on the topic will now halt, I will come back to the subject intermittently in the future. It is a comment on the perceived future scarcity of conventional oil, that this subject is receiving so much attention.


Read more!

Saturday, April 3, 2010

Maine Temperature information

This is a part of a continuing look at state temperatures, and, since time is a bit short today, and since this was written in Maine*, I thought I would look at the temperatures there, rather than doing California, which with over 50 stations will take a little longer. Maine also provides an interesting contrast to Nevada, having some of the coldest temperatures in the contiguous United States, rather than some of the hottest. The process is the same as that I started with, and so I will be comparing the dozen USHCN stations in Maine with the single station that GISS uses. I wandered around trying to check that Caribou was the valid GISS site, as Chiefio listed. Along the way I bumped into the US Climate Reference Network (USCRN).
When fully deployed, the USCRN will consist of approximately one hundred stations nationwide at locations selected to capture both the national and regional climate trends and variations for temperature and precipitation.
The reason that I question the GISS use of Caribou, is the same as that which gave me problems when looking at Nevada. The temperature data from the site does not go back to 1895, as the USHCN data does, but in this case only starts in 1948, making a true comparison over the period of record impossible.

So, again being curious, I looked for a listing of the USCRN stations, which turn out to be different from the one provided by Chiefio. There are two stations on this USCRN list for Maine, one at Limestone (20020920) and one at Old Town (20020913). And this gets even more confusing since the data for Old Town from GISS only run from 1949 to 1972, and that for Limestone doesn’t apparently exist (the town has 1,415 people in it.) Perhaps it is a new station that is being installed? Maybe I should find out what is going on? But the record hasn’t been good on folk getting a response from those responsible (see the Climategate e-mails). So, given the confusion, I think that I will just stick with the Caribou station for now, since it does, at least have a significant length of time over which there is a record, that can be compared with the USHCN data.

However, by using this station I do invalidate one of the hypotheses that has been evolving from data from the last five states. For this is the first state where the GISS station temperature is lower than that of the average of the USHCN stations. Plotting the difference between the two, this really doesn’t appear to have changed over the time interval where there are records for both:

In Maine there has been a steady increase in state temperature over the past 114 years:


Now I had a second hypothesis that I was going to test, and this was that the influence of the sea would be evident in a warmer temperature near the coast, which dissipated as the stations moved west, and both away from the coast and higher. Well that one was wrong, at least in regard to it becoming cooler as the stations were further west and higher:


However there is a caveat to this result, in that the coast of Maine runs at an angle of about 45 deg along the bottom of the state, so it might be that we need to filter out the effects of latitude and altitude before having a closer look. Also, as I will note again later, there are only a limited number of stations in the state and two of them are sensibly on the coast.

The linear correlation with Latitude that has been detected for all the states so far, has persisted:


As has the linear inverse temperature correlation with Elevation above the sea, even though, in this case, the heights are not that great:


The change in standard deviation over time follows the pattern that we have seen in many of the states, starting out rising, and then, as automated temperature recording was introduced, reducing.


And so I now adjust the data by adjusting each station data to the latitude for the Center of the State, given as 45.250556, -45.250556.

Then I tried adjusting the data to the value if the station was located at the average height above sea level for the state of Maine, which is 600ft. And discover that this doesn’t work for all stations, since those that are below 100ft above the ocean tend to be dramatically overcorrected.

This comes back to the point that there are only a few stations in the state, and that there are only two that are that close to sea level, and we don’t have enough data at this time to draw a conclusion. Which means finding a state with more stations at the coast. . . . .

In the meantime to round out the usual set with a variation, here is the mid-state average temperature (i.e. adjusting each station for latitude as though it were at mid-state, and then taking the average – without Caribou – though it made very little difference). (To do this I subtract the constant term from each temperature based on the temp v latitude graph, then I multiply by the latitude of the center of the state, divide by the latitude of the station, then add the constant term back in).


And then to look at the effect of population, though again using the temperatures adjusted for latitude:


And we can still see that stronger sensitivity to population at small town sizes, that has been consistent across the states examined to date – but then they have all had relatively small population sizes.

* A series of problems that began with problems in getting onto the internet at the hotel, through having to change the router on our system when we got home, ends up with this also being completed on a new computer a week after the vast majority of the post was first written, sigh!

Read more!

Friday, April 2, 2010

Charcoal, Oil Shale and the Ecoshale process in Utah

If you drive West from St Louis (as I did Thursday after my check-up*) you will occasionally hit a pocket of air that smells a little sweet, and a little burnt. It is the product from the charcoal kilns up near Vienna, one of the larger centers for making charcoal in the country. Apart from its use in making barbeque, charcoal has other beneficial uses, and it is projected that it has been used over many millennia. Modern consumption in the United States runs around 375,000 tons.

To really simplify the technology for making the fuel (which may become a unique post at some future point)
Making charcoal from poor-quality timber and sawmill waste is a process that has changed little in centuries.
Before it becomes dimensional lumber, every log harvested in the Ozarks first must be sawed square. The bark covered slabs produced by that first cut become the raw material for charcoal briquettes. Seasoned hardwood is sealed in an air-tight enclosure and allowed to burn with the barest minimum of air. Just like in a woodstove with the damper closed, the wood slowly turns to almost pure carbon as its lighter, more volatile components are driven off by heat. This process, called pyrolysis, can occur in a pile of wood buried in a hole in the ground or inside a metal or concrete box called a Missouri-type charcoal kiln. For years, making charcoal was one of the few sources of income for people in the Ozarks.

In the modern, larger scale version of that process the sawdust or waste wood is treated in something that looks like a refinery:

Modern charcoal plant at Bell,MO (MO DNR )

However, in the earlier times the kilns were made up with earthen and turf walls to seal in the charcoal as it cooked. And it is that technology that I want to return to today in another post on Oil Shale, in this case discussing the EcoShale project in Utah.

The Ecoshale project is being promoted as a new approach to obtaining oil from the shales of Utah. The company proposing this “In-Capsule” process had a fair-sized booth at the MinExpo meeting in Las Vegas a couple of years ago, that drew my attention. I stopped by and watched the video (twice) picked up literature, and talked to one of the folks at the booth. Since there is considerable oil (well actually kerogen) locked up in the shale (perhaps as much as 1 million bbl/acre it is worth seeing what they have planned. I will include a few thoughts as I go through the process.

Those in the UK might want to visit Ian West’s site which gives some history to shale burning in the UK.

Until now I have largely, in the recent posts on oil shale, focused on the thicker layers of oil shale in Colorado, but there are places in Utah where the oil shale near the surface is more than 10 ft thick, and where the shale will yield more than 25 gal/ton. With prices of oil fluctuating, the grade at which production becomes possibly economic will vary, but for the following discussion I am going to assume that a ton of ore will yield about ¾ of a barrel of oil. I will also assume, for simplicity, that a ton of shale occupies 14 cu. ft. before it is mined. The plans for the project, at the time of the MineExpo presentation, were that it would be scaled to produce 30,000 barrels of oil per day, at an anticipated cost of roughly $3 billion. This has now been split into plans for a 9,500 bd commercial project prior to that larger operation. Red Leaf, the company, holds leases to 17,000 acres of this shale (with an overall average of 25 gal/ton, ranging up to 70 gal/ton).

Typical surface oil shale site in Utah (Red Leaf )

General overview of the site

The first thing that happens at a site is that the overburden, and shale that doesn’t have a high enough oil content is removed and stored for site remediation after the process is over. (I am going to use oil to describe the hydrocarbon content, ‘cos it’s shorter to write than kerogen. ) This will require a significant area, since the volume of rock being uncovered every day is going to be large. There are going to be three operations going on at one time, in order to make the process work. The first is the removal of the overburden, the second is the preparation of a site to act as a retort, and the third is the mining of the oil shale and the building of the retort. The retort is then left in place to “cook” the oil/kerogen over a period of some 90 days, before the site is reclaimed. Retort preparation will take place in a space where the shale has already been taken out. (This requires the initial removal of an additional volume of shale that has to be set aside and stored to give the space for the first retort to be put in place.) This is because the underlying bed must be prepared, and the infrastructure for the retorting has to be put into place.

To get just a little ahead of myself, the process of retorting the shale involves mining the shale, and then building the broken rock into a crushed zone, through which pipes have been placed, that will carry natural gas to heat the rock. The rock is then covered with a thick layer of an impermeable rock (for simplicity I am going to assume a crushed claystone) that will act as a seal. In this way the shale is encapsulated, and as the heat from the gas works then so, as with the wood in the charcoal kiln, the rock is processed, the hydrocarbons driven off, and collected in drainage tubes that are interspersed through the layer.

Schematic of the Ecoshale process

If we look at the operations required for the full 30,000 bd operation. The mining of the shale will require some 40,000 tons of rock to be mined and moved every day for production, as well as the removal of the overlying rock from the next batch down the strip. This is equal to around 560,000 cu ft of rock. For the sake of discussion, if the strip being mined is 50 ft wide and the shale seam is 35 ft high, this will require that each day the mine will move a panel that is 320 ft long. However this isn’t all the rock that is required. Because before the shale that is mined can be placed in the retort zone, a layer of clay will be placed over the pit section in order to give an impermeable barrier below the shale to stop contamination of the underlying rock and any water that it contains. This layer is going to have to be very thick, since the oil shale above it is going to be heated to the point that it releases the oil. This takes a temperature of 900 deg. At that temperature the clay will bake and becomes very brittle, so the clay layer must be thick enough to allow for this and allow enough temperature drop to leave the lowest layer still flexible enough to act as a seal. Let’s assume for now that this is going to need a layer that is 3 ft thick. (I’ll come back to this later.) In a recent test of the process the seal provided also included a plastic sheet as well as bentonite. (Presentation slide 19).

Once this clay has been placed (and it should slope at about 5 degrees toward the open face to allow for effective drainage), then the mined shale can be placed on top of it. Drainage pipes are placed near the bottom of the shale layer, then more shale is added, and a heating set of pipes is laid across the shale. These pipes are connected at the back of the day’s pile, so that the gas that will pass through them will also move back through the pile and back to the face of the pile for collection. More collection pipes are then placed as the pile rises and is flattened over the recovery site. The pile will be considerably higher than the mined area since, in mining the shale it also “bulks” in volume by about 60%. The reason for this is that the pieces no longer fit exactly together. Think about a jigsaw puzzle. When the puzzle is made it only occupies a small area of the table, but when all the pieces first come out of the box they fill a much bigger space, because of all the empty space around each bit, and that the pieces are all separate. It is the same thing for rock. (Some of those internal spaces will be filled as the shale heats and degrades, so that the pile may collapse a little during the heating process). Thus the pile that will be made will be have to fit into the same “footprint”, i.e the 50 ft deep, 320 ft long shape it came out of, but will now be 56 ft high. With the underlying clay layer this will make the pile some 59 ft high at this point. (And require about a thousand tons of clay a day)

Drainage pipes on bentonite at the bottom of the test retort (Red Leaf)

By going through this process the mine is creating a “use once” retort that encapsulates the spent shale, and collects the retorted products without some of the disadvantages of a more conventional retort. These include (from the brochure) protection of groundwater, lack of need to sequester tailings, and obviation of the problems of retort clogging and moisture retention within the retort.

Now the mine has to seal the retort to keep the retorting heat within the shale and not to let it, or the gas and oil generated out. So a cap will be placed over the broken shale and, for the same arguments as above we will assume for now this is also going to be about 3 ft thick. (I hope it doesn’t rain much in this part of Utah. The impact of water on clay/shale at 900 degC is spectacular, since the clay shatters explosively and is easily eroded).

Collapsed cavity where high-temperature overlying shale fragmented and “blew out” after being hit by a water stream. (site in Montana)

This will take the pile up to 62 ft high, which is quite a bit higher than the original 35 ft. It is interesting that the brochure suggests that this will be a “low temperature, stationary heating” given that the initial temperatures to liberate the shale have been documented (as noted above) at 900 degC. And my memory suggested that that number also cropped up in my conversation at the booth. It will also have to have a front panel of a sealing rock and clay placed over the face of the section, in order to complete the capsule.

Representation of encapsulation

Now the heating pipes are connected to a natural gas burner that will feed the hot gases into the heating pipes, gradually bringing the shale up to the temperature where the transformed oil can flow to the collection pipes, and any gas produced can also be collected. The booth spokesman told me that they anticipate that the natural gas needed can be collected on site, and that the heating will take a total of 90 days to heat the shale to the point that all the hydrocarbon content has been recovered. That means that the retort section of the mine will be roughly (90 days at 320 ft per day) 5.5 miles long.

After retorting is complete, the heating element will be disconnected and the shale and overlying clay allowed to cool. It will then be covered with the initial overlying rock that will be restored to roughly original contour, and the ground fertilized, seeded, and the ground cover re-established.

While the brochure cites the approbation of the Governor of Utah, the commendation for the project was written at the time that the price of oil was some $120 a barrel, so we may have to wait a short while until it gets back to that level before the project starts to take off.

By December 2008 the project was reported to have invested some $15 million in research and development of the process. They are currently in development of a large-scale pilot demonstration. Information on the web site, however, is a little sparse concerning current progress, through oil was apparently produced in November 2009.
Ecoshale's synthetic product has properties rated by the American Petroleum Institute (API) as 39 condensate oil and between 34 and 35 prompt oil with no fines, or impurities, in the oil.

Based on the test study, Nelson projects full-production at 30,000 barrels a day would cost $20.21 per barrel, not including transportation
.

My concerns with this come in the transition from a single retort which can be built to quite high standards, to the operation of even a smaller continuously operating system, where there are likely to be considerably more and larger problems with operation than appear evident at this stage in the process.

* My thanks again to those concerned after my eye problem arose, the surgeon told me yesterday, 3 weeks after it happened, that I now am back to 20/20 vision – albeit using glasses. I remain highly impressed with what modern surgery can achieve.

Read more!