Showing posts with label Katrina. Show all posts

Friday, September 14, 2012

Waterjetting 1b - Force, Pressure and Flow volume.

This is the second in a series on some of the ways in which high pressure water jets can be used. The series was introduced last week.

Back in September of 2012 archaeologists found the remains of the last king of England to die in battle. He was Richard III, to whom Shakespeare gave the line “a horse, a horse, my kingdom for a horse!” He died because a blow to his head was focused down to a very high local pressure, even though the overall force of the blow might not have been that great.


Figure 1. Gothic Armor of the type worn by Richard III. (Detroit Institute of Arts)

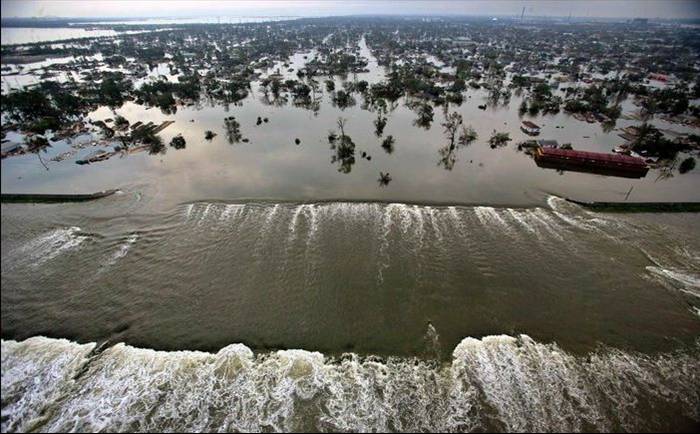
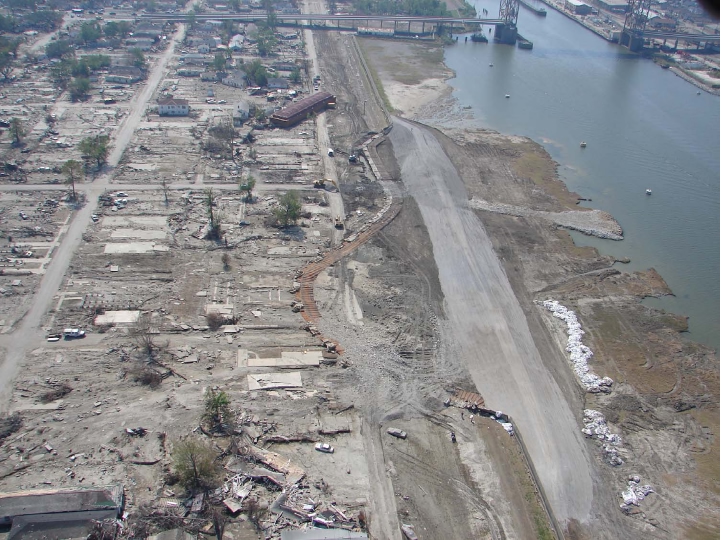
On the other hand, in the middle of Hurricane Katrina, seven years ago, a barge broke through the levee wall above the Lower 9th Ward in New Orleans, LA (NOLA) and released a wall of water that swept through the district. The pressure of the water was quite low, but the overall force it exerted demolished the buildings in its path, and swept them off their foundations for eighteen blocks back from the levee. In this case force, not pressure, was the cause of the damage.


Figure 2. The Lower 9th Ward in New Orleans after Katrina, as the water falls, it flows back into the Industrial Canal. The barge that broke through the levee is on the right. Most of the debris lined the second row of trees back from the levee. (Tulane)

It is this initial relationship between force and pressure, and the role that each has to play in the use of waterjets to remove material that form the topic not only for today, but in a number of the posts that will follow. Waterjetting applications now cover a wide spectrum of different uses, and finding the best choice of pressure and flow (which combine to give power) will change from job to job, and hopefully these posts will help make the choice easier.

It is raining outside. As the water drops hit the soil, the water soaks into the soil by penetrating along the existing cracks that exist between the grains of the soil. After a short time the water fills this space, and as it continues to rain, the impact of new rain drops hit the thin wedges of water that now run down into the soil. Although at much lower forces the action is the same as when you hit a wedge driven into a log with a hammer. The wedge pushes the two walls on either side apart, and a crack grows. One of the key elements that give waterjet cutting its advantage is this transformation from an impact force into a pressure, and most particularly a pressure which is applied against all the surfaces with which the water is in contact. It is a point that will be repeated many times.


Figure 3. The stages of soil erosion – the white arrows in (b) and (c) show the small pressures that are exerted on the particles as additional raindrops keep falling on the water in the ground. This lifts the top two particles in (c) so that the flow of water will carry them away.

With the soil there is not that much material holding the grains together, and so as the rain continues, the soil grains begin to separate from those on either side. Water gets underneath the grains and starts to lift the individual grains free from the mass. Since most land is not flat, the water will now start to flow away under the continued rain, and as it does it carries some of the soil particles that have been freed. This is a simple explanation for the erosion that happens in fields, dirt roads, and other exposed surfaces as they weather. As materials get stronger this process can take much longer to be seen. A high quality stone will erode at the rate of perhaps an inch every thousand years, depending on local weather patterns. There are buildings and bridges built by the Romans all over Europe to prove that point. A weaker granite (and one thinks of the granite in the walls of the Basilica in St Louis as an example) may severely erode within a hundred.

Which brings up an important point: the performance of a waterjet stream is not just controlled by what happens upstream of the nozzle in the delivery system, but it is also affected by the material that it is hitting. And I’ll come back to that in future posts.

First, however, consider what happened during Hurricane Katrina in the Lower 9th Ward. When the barge broke through the levee wall and was carried into the district, it rode on a wall of water that was initially no more than about 30 ft high. We can make a very crude estimate of the pressure of the initial wall of water (neglecting any impact due to the speed at which it moved) based on the height of that wave. A cubic foot of water weighs 62.4 lbs. It sits on an area of 12 x 12 = 144 square inches, so that the pressure under that water is 62.4/144 = 0.43 pounds per square inch (psi). Since that is somewhat close to half-a-psi, as a very simple way of getting the pressure at the bottom of a column of water one can just divide the height in two, and call it psi instead of feet.

So, in the case of that wall of water the pressure at the bottom of the wall would be 30/2 – 15 psi. Since the pressure increases with depth, the average pressure over the height will be half of that, or 7.5 psi. That pressure, by itself, does not appear that powerful.

But when the wave hits a building that pressure is applied over the entire wall. So if the building is 40 ft long and 10 ft high, then the area that sees that pressure is 40 x 12 x 10 x 12 = 57,600 square inches. If that small (7.5 psi) pressure is applied over the whole area, then the force = pressure x area = 7.5 x 57,600 psi = 432,000 lb.

You can now perhaps understand why, when the wave hit the first rows of houses in NOLA that they almost immediately disintegrated, and were carried back as broken debris for about ten blocks.


Figure 4. Aerial view of the Lower 9th Ward after the water had drained, and the levee had been replaced. For a sense of scale there is a school bus sitting partially under the barge, and that is the yellow dot at the end of the upper arrow. Each of the flat slabs to the left of the levee marks where a house stood. When we visited the site the house slabs were as shown, but there was still water – and some live fish, standing in the district. (Tulane )

This was a terrible disaster, but there are occasions, particularly in mining, where this terrible force, combining low pressure but high volume flow rates, can be harnessed to do useful work. Such flows are something that our ancestors have known for millennia, and were used as a way of mining from before the age of pumps, and l will tell how they did it in some later articles.

But in most cases we don’t have that amount of water, and the job is more often one where we want to precisely cut a hole, perhaps, in one of the walls of a building, rather than destroying the building. And we haven’t the patience to wait a hundred years to cut through a block of stone. So how do we speed it up? And so we come back to the death of King Richard.

Back in the day a foot soldier could make a bit of money in a battle by knocking a knight off his horse, and then holding him for ransom. The weapon that they used for this was generally known as a poleaxe. These come in various shapes, but one general idea was to have a hammer on one side of the long pole. Thus, by swinging the pole one could hit a knight with a force of say 50 – lbs. and this could knock him off his horse, allowing him – in the best of such worlds – to be captured alive and then ransomed.


Figure 5. Modern Reproduction of a poleax from about the time of the Wars of the Roses (Wallace Collection)

However that hammer head could measure about a square inch or two, and neither the force nor the pressure would have been enough to penetrate armor or a helmet of the type King Richard wore (Figure 1). To give the footman that advantage the design was changed to include a small spike in the center of the hammer.


Figure 6. Spiked Poleaxe from about 1582, (Royal Armories, Leeds) via My Armory.com)

Now when the force of 50-lb is applied through the hammer to the target it is not distributed over a square inch (giving a pressure of 50-psi). Instead it is focused down on a point that is less than a twentieth of an inch across. Total area of the circular point comes from pi x radius squared = 3.14 x 0.025 x 0.025 = 0.002 sq inches. Pressure applied through the spike to the helmet = 50/0.002 = 25,000 psi. That is enough for the spike to pierce through the metal helmet and the bone underneath, killing Richard III. Battle over, England had a new king, Henry VII, and the War of the Roses was over.

The intent of the two examples is to show how, in some circumstances, high volume flow rates at low pressure can do the most damage, and in others that much higher pressure applied over a much smaller area is the most effective. They are extreme examples but seek to illustrate the point, and in many cases neither extreme (highest pressure, lowest flow or lowest pressure, highest flow) will give the best answer. There are cutting conditions where operational concerns and benefits would argue that pressures of 90,000 psi, and flow rates around 1 gpm will be the best business choice. In other cases a flow of a thousand gpm, but at a pressure of 1,000 psi will be the most economic and viable way to remove soil, and weaker rocks like coal. This series is aimed, in part, at giving you the knowledge that will help you decide where, within that range, to make that balance, between flow and pressure.

(For those reading this series who are not that familiar with blogging conventions, the words that are highlighted in blue are links. So that if you want to read more about that specific topic, clicking on the highlighted words will take you to a web page that gives more information).

UPDATE: 1. This post was updated in 2013, after the body had been positively identified as that of the late King. The validation included a check on the DNA of the remains, which was compared with that of descendants of the family line.
UPDATE: 2. This post was slightly modified on April 19, 2013 to clarify some points that were not explained as well as I thought they were.

Read more!

Sunday, August 26, 2012

Hurricane ISAAC and the Gulf Coast

The political world is waiting patiently for Tuesday, when the Republican National Convention is officially getting under way, after a postponement due to the nearby passage of what remains Tropical Storm ISAAC. The question that begins to arise, however, is as to whether the political news will be swamped by the consequences of ISAAC’s arrival.


Figure 1. The current prediction for the path of Tropical Storm ISAAC, as it skirts Florida, on its way to the Gulf Coast.(National Hurricane Center)

It has been some 7 years ago that the three hurricanes of 2005, DENNIS, KATRINA and RITA, did a number on Gulf oil production. We have, in the interim, perhaps become a little complacent about the impact of a major hurricane on Gulf oil production. It was DENNIS which did such damage to the Thunder Horse platform back in July of 2005, that it took several years to bring it back into operation. (video here ). DENNIS shut in some 1 mbd, but for only a short time.


Figure 2. The Thunder Horse platform after Hurricane DENNIS in July of 2005. (Youtube )

However it was followed by KATRINA and RITA, so that, between the three of them they covered not only the swath of the ocean that included most of the drilling platforms in the Gulf, but also, as they moved inland, a significant number of the refineries on which the nation has come to depend.

In the seven years since then, the lack of significant hurricane impact on the Continental United States has led to some complacency as to the vulnerability of the country to the hurricanes that have, from time immemorial, threatened these shores.

But it is worth just a quick reminder that the impact is not just seen in damage on shore, grievous though that may become. (I was on a survey team that was one of the early groups that went down the delta after KATRINA). Already platforms are being secured:
The Bureau of Safety and Environmental Enforcement says 39 production platforms and eight drilling rigs have been evacuated as of Sunday. That's about 6.5 percent of the 596 manned platforms and 10.5 percent of the 76 rigs operating in the Gulf of Mexico. . . . . . . The bureau says operators estimate that about 24 percent of the current daily oil production and 8 percent of natural gas production has been cut off.
.

The paths of the storms are somewhat different. KATRINA came in more directly from the south:

Figure 3. Path of KATRINA in 2005 (Central Florida Hurricane Center).

The path of ISAAC is currently anticipated to be more direct, as shown in Figure 1, but there are several things to bear in mind, as we move into this week.


Figure 4. Platforms along the Gulf of Mexico (FOX 4)

Firstly it was not only the platforms themselves that caused the problems in the United States after the hurricane season of 2005. There are a lot of refineries around the NOLA area that were damaged at the time, and which have not moved since.


Figure 5. Refineries around New Orleans in the region of the KATRINA hurricane track.

Hopefully between then and now the relevant refinery will have got all the switchgear that gave them problems back then out of the basement and into a less flood-threatened location.

As far as the people that live in the region are concerned, there are two additional worries. The first is that there is some thought that the hurricane may strengthen beyond a level 2, and KATRINA was only at a level 3 when it hit in 2005. The second is the direction in which the storm is approaching. While KATRINA had the full length of the delta over which to lose power, if ISAAC swings in from the East then it will pose a greater threat to the levees because it will impact Lake Ponchartrain.
If the storm tracks west of New Orleans, a storm surge into Lake Ponchartrain could push water against the city’s still-fragile levee system. If the storm makes landfall east of New Orleans, northerly winds on the west side of the storm could still create wave and water problems for the Crescent City. A landfall east of New Orleans could also bring a devastating storm surge onto the Alabama-MIssissippi coast.
. As a precaution rigs and platforms have been put into a protective posture, which has reduced daily oil production by 24% and natural gas production by 8%.

Until the full nature of the threat develops, however, it is thought that the refinery fire in Venezuela may have greater impact, although it is being reported that the damage there was constrained to just two storage tanks. (Not that this is as big a concern to the United States as it used to be:
In the first five months of 2012, the United States imported just over 50,000 bpd of fuel from Venezuela, down from nearly 290,000 bpd in 2005, according to data from the U.S. Energy Information Administration.
And for the people of New Orleans and particularly those in the ninth ward, I hope that this time they have not dredged next to the levees, nor have they left any of the barges less than totally secured.

And, lest the Democratic Party start to feel too superior, there are rumors of another Tropical Depression that might make it more interesting in Charlotte, in early September.

Read more!

Wednesday, July 27, 2011

OGPSS - Gulf of Mexico production, and hurricanes

The summer brings back Hurricane season, with the threat that such storms bring to the oil and gas well operations in the Gulf of Mexico. And the National Oceanic and Atmospheric Administration (NOAA) has noted that
The Atlantic basin is expected to see an above-normal hurricane season this year, according to the seasonal outlook issued by NOAA’s Climate Prediction Center . . . . 3 to 6 major hurricanes (Category 3, 4 or 5; winds of 111 mph or higher)
The lessons of this vulnerability were, perhaps, more than most years, evident in 2005. The first sign of problems came with the arrival of Hurricane Dennis in July. It was a storm which severely damaged the BP deep water Thunder Horse drilling platform.

Thunder Horse after Hurricane Dennis (Prof Goose)

As that season wore on, the vulnerability of the platforms in the Gulf, and the refineries that border it, were exposed in more intensity with the passage of Hurricanes Katrina and Rita. These threats and their analysis were one of the factors that helped, in that formative year, to bring an audience to the pages of The Oil Drum. The Gulf is now home to thousands of wells, which, as the evidence from the Deepwater Horizon disaster last year reminded us, has moved further and further away from shore. That vulnerability is perhaps illustrated by a map, showing the path of Hurricane Rita through the oil platforms off the Texas and Louisiana coasts.

Path of Hurricane Rita through off-shore Gulf production facilities (The Oil Drum) (Each dot is a production unit)

Back in the 1930’s and ‘40’s it was the very gradual deepening of the seabed in the Gulf, that allowed the first oil drillers to venture, through the swampy regions of the Mississippi Delta and then on out into the waters of the Gulf. There had been some drilling from piers out in California and similar constructions were also tried along the Louisiana shore, as the prospects for success tempted companies away from the coast. However, as they did so the rigs faced the challenge, as they do today, of surviving in regions where Hurricanes are not uncommon. The industry was helped in this development since there were no major hurricanes that moved through the regions of most intense drilling, from the first wells in 1945 until 1964 when Hurricane Hilda arrived. And even when that hurricane struck on October 3rd, it only damaged three locations, at Eugene Island and Ship Shoals 149 and 199, with a total of some 11,869 bbl of oil being spilled due to the storm.

Gulf of Mexico showing regional features (Geoexpro)

The first pier-based platform had been built out into the Gulf of Mexico at McFaddin Beach, south of Port Arthur, Texas after having been approved by the Secretary of War, on July 8, 1937. The pier was a mile long, with three rigs at the far end, but it only drilled dry holes and was destroyed in a hurricane in 1938. More widely recognized was the first well to be drilled out of sight of land. This was the Creole platform near Cameron, which was a mile out-to-sea, an hour-an-a-half trip by shrimp boat at the time. The water was only 18 ft deep and the well, initially drilled by Pure Oil and Superior Petroleum, (later Kerr McGee, and then Anadarko) sat some 15-ft above the water level. Initial production was 600 bd from a depth of 9,400 ft. It was damaged by a hurricane in 1940, but survived and produced more than four-million barrels since through directional drilling.

Kemnac Rig 16 drilling the first offshore well in the Gulf of Mexico (Kerr-McGee via Penn Energy)

As was the case with California there was initially some controversy over who owned the rights to minerals off-shore and in 1953 Congress passed the Submerged Lands Act, which gave the rights to the states for the first three miles offshore, (the range of a smooth bore cannon at one time) and then the Outer Continental Shelf Lands Act which gave the rights for the more offshore land to the Federal Government. This settling of the disputes encouraged further drilling and while there were already 70 rigs, drilling at depths up to 70 ft of water, the years after 1953 saw the development of a variety of different rigs for drilling in ever deeper water. Designs to cope with hurricanes also progressed, so that by the time of Hurricane Flossy in 1956 rigs were relatively safe. It was followed by Audrey in 1957, ranked as the sixth deadliest hurricane in US history, which came ashore at Cameron, and killed 416 people, but caused $16 million in damage offshore, with no fatalities.

Path of Hurricane Flossy in September 1956. (Note I have referenced the web pages showing the storm paths under the Hurricane name in that which follows).

Technology was, however, allowing rigs to work in ever deeper water, 100 ft of water in 1957, 225 feet by 1965, and 300 ft in 1969. With this increase in range came increased production, which had reached 2 mbd, but it also exposed more rigs to the threat from larger storms. Hilda, formed in 1964, caused $100 million in damage and effectively destroyed 18 platforms,; Betsy in September 1965 had the distinction of financially impacting a future President of the United States.
On September 9th, the day Hurricane Betsy struck, MAVERICK was located 20 miles off the Louisiana Coast in 220 ft of water. The following day an inspection showed Zapata’s three other rigs were undamaged, but the MAVERICK had vanished. This was the largest single loss that the domestic offshore drilling industry sustained in this or any other hurricane. . . . . .The MAVERICK loss was a substantial one for Zapata. This was our newest rig and one of our very best contracts. . .
(George H.W. Bush, “My Life in Letters and Other Writings.”) (The insurance check was for $5.7 million).

Camille in 1969 was the largest storm to hit the USA in the 20th century. It did about $100 million in offshore damage, including sinking three up-to-date rigs designed to survive those storms. (Camille was a Category 5). Onshore the damage exceeded $1 billion. This was the hurricane that taught the industry that they had to design rigs that could not only withstand waves more than 70-ft high, but has also to consider that the seabed itself might move under the force of the storm.

Fortunately such storms have proved to be relatively rare, and the “three strikes” of Dennis, Katrina and Rita in 2005 have not been repeated since. Yet the industry remains highly vulnerable to such storms. As the second figure shows, the Gulf has become increasingly filled with production platforms. In 2008 this region was hit by hurricanes Gustav at the start of September and Ike two weeks later. Even though these were weaker storms their impact was significant.
Effective August 2008, there were more than 3,800 production platforms in the Gulf, ranging in size from single well caissons in 10 feet of water up to a large, complex facility in 7,000 feet of water. The MMS estimates about 2,127 production platforms were exposed to hurricane conditions from Gustav and Ike, carrying winds greater than 74 miles per hour.

Final results of the agency’s assessment of destroyed and damaged facilities from these two storms indicate that 60 platforms were destroyed. These included some platforms that had been reported earlier to have extensive damage.

In comparison, 115 platforms were destroyed by the Rita-Katrina wallop in 2005.

The platforms designated as destroyed following Gustav and Ike produced 13,657 barrels of oil and 96,490,000 cubic feet of gas per day, or 1.05 percent of the oil and 1.3 percent of the gas produced daily.
Part of the reduction in damage came from lessons learned from Katrina/Rita.
Mobile Offshore Drilling Units (MODUs) that previously had to have eight mooring lines were now required to have 12 and, in some cases, 16 mooring lines,” Angelico said. “In ’08, 18 moored MODUs were in the path of hurricane force winds, and two went adrift, which represented 15 percent of the rigs out there. In Katrina and Rita, 63 percent of the rigs went adrift.’

There are additional impacts from these storms. The Gulf continues to produce about 27% of the nation’s oil, and 15% of the natural gas. Those fuels must be brought ashore and, in the case of oil, refined. Refineries lie inshore all along the Gulf Coast, and if flooded can take months to be brought back on line. Given the growing reliance that the country places on production from these regions makes us all vulnerable to the season.

Outer Continental Shelf (OCS) Crude and Condensate as an annual volume and percentage of national production. (BOEMRE)

Last October OCS crude and condensate production averaged 1.52 mbd, which comprised 28% of the estimated US production.

Offshore Natural gas production as an annual volume and percentage of national production (BOEMRE)

Last October natural gas production averaged 5.6 bcf/day which was 8.9% of estimated national production.

There is a significant production from smaller, older wells, while the new fields are found in deeper waters further into the Gulf, and so that is where I will venture next time.

Read more!

Monday, June 7, 2010

Deepwater Oil Spill - the Hurricane season

Five years ago shortly after Kyle invited me to help him start The Oil Drum, Hurricane Dennis, a category 4 hurricane, struck the Gulf of Mexico. It formed on July 4th, 2005 and dissipated on July 13th. This was the first hurricane that TOD had covered, and the focus, naturally, was on the impact which it would have on oil production. This was significant, as the MMS reported.
Hurricane Dennis forced the evacuation of a total of 445 rigs and platforms, according to a Monday report from the U.S. Minerals Management Service, which was released a few minutes before the end of the regular trading session. The evacuations prompted the shut-in of 96.2% of daily oil production in the Gulf of Mexico, as well as 62.4% of daily natural-gas production, according to the MMS.

The update was the main reason for the rally, said Phil Flynn, a senior analyst at Alaron Trading. "People were surprised that Dennis shut in 1.4 million barrels of daily oil production [in the Gulf]," he said, emphasizing that that was a bigger loss of oil than many expected.
In that first post, the path of the Hurricane was simplified to:
Which, you may note covered the Eastern part of the Gulf, with the black spot being the location for the Thunder Horse platform.

Thunder Horse after Hurricane Dennis

Hurricane Katrina, a category 5, formed on August 23rd (it appeared on TOD on the 24th and daily thereafter) and dissipated on August 30th. Much of the damage that has been discussed related to the severe damage that the area around New Orleans, and all the way down the Delta suffered. At the same time the MMS reported
These evacuations are equivalent to 78.75% of 819 manned platforms and 67.16% of 137 rigs currently operating in the Gulf of Mexico (GOM). Today’s shut-in oil production is 1,427,969 BOPD. This shut-in oil production is equivalent to 95.20% of the daily oil production in the GOM, which is currently approximately 1.5 million BOPD.

Today’s shut-in gas production is 8.798 BCFPD. This shut-in gas production is equivalent to 87.99% of the daily gas production in the GOM, which is currently approximately 10 BCFPD.
Hurricane Katrina not only knocked out rigs in the Gulf, it also had a severe impact on refineries on shore.

Path of Katrina through the onshore refineries.

The price of gasoline rose rapidly and transiently there were gas shortages. It was the first time TOD had problems with traffic swamping the server. As for the rigs in the Gulf
In terms of exploration, more than half of the 231 offshore rigs (excluding inland barges) currently working in the US Gulf of Mexico were in Katrina's path. A total of 48 rigs lay within the most adversely affected areas where winds were at hurricane force, blowing in excess of 74 MPH. Another 69 rigs were located in waters that experienced tropical storm force winds of 36 to 74 MPH. In total, 117 rigs, valued at a combined total of over $7 billion, had to weather the storm.

As of Monday afternoon at 3pm, the US Coast Guard has reported that at least one, possibly two, deepwater rigs have lost their moorings and are floating freely in the Gulf.
58 rigs were damaged or displaced of which 30 were lost. By Sept 2nd gas was, in places, at $4 a gallon.

Hurricane Rita, a category 5, was formed on September 17th and dissipated on September 24th, 2005. The rigs in the Gulf had not recovered from Katrina,but Rita swung further west moving through the offshore rigs to come ashore at the Texas border.

The effect of Rita onshore hit more refineries.


The impact of any hurricane in the Gulf on Gulf oil production and thereby on the national oil supply can be visualized with this map showing the locations of the rigs along the coast, from back in 2001. It has not changed that much since, except that there are more rigs out in the Deepwater.

Rig density along the Gulf coast in 2001 (after National Geographic)

Now I mention all this because the gas shortages, and loss of production from the Gulf lasted through most of the fall of 2005. In order to help with supply the National Petroleum Reserve was opened and 11 million barrels of oil sold. It has since been replaced.

This year is already predicted to be a more than usually severe one for hurricanes, with 2 or 3 likely to make landfall in the United States. Which leaves me more than a little concerned, and while there are many different concerns (I was on a survey team that went to NOLA after the disaster, and then down the Delta, and have no wish to ever see such devastation again), two are becoming more pronounced.

The first is as much political as anything, and it relates to the growing creation of the petroleum industry as villain du jour by the Administration and the main stream press. This is not meant in any way to excuse BP or whoever is ultimately found to have caused this disaster, (and I won’t mention the different treatment of banking relative to the oil industry) but there are ongoing consequences both of current actions and attitudes and the potential increasing level of regulations and reviews that are being developed. They are all likely to negatively impact the resilience of the industry in bouncing back from hurricane damage, and in motivating, and even allowing, parts of that recovery to be as fast as it was last time. As a result, any significant hurricane in the Gulf this year may accelerate the return to $4 gas, and for a longer time than the last.

And in that regard, I do remain worried that the powers that be shut down the Top Kill as fast as they did. Yes there were some problems, and I noted some potential ones, but at least it might have ended with killing the well. That won’t now be possible until the relief wells get there sometime in August. And in the meanwhile the well remains vulnerable to storms in the Gulf.

Not that BP have not been making provisions for emergency disconnection of the vessels catching the oil from the leak, and potentially for storing some of the oil. As Kent Wells explained last week. The current solution involves a new connection at the BOP, which won’t be put in place to the end of June.


This will include a new collection tool that is currently being fabricated, made from 10-inch thick steel.


In addition there will be a new floating riser, with a flotation can to hold it some 300 ft below the surface, down below the level of the waves. Unfortunately if it has to be disconnected, then for the time that the Hurricane keeps rigs away, the well will be spilling oil.

And in that regard, my last post on the oil flow through the current cap noted that they had increased production up to 10,000 bd. I had assumed that they had closed most of the ports on the cap to achieve this flow, but it turns out that so far they have only closed one. As BP noted yesterday:
We may leave some of the LMRP cap valves open to ensure system stability - one is currently closed.
The closing of one of the ports on the cap is now reported to have increased flow by 1,000 bd
On June 6, a total of 11,100 barrels of oil was collected and 22 million cubic feet of natural gas was flared. Optimization continues and improvement in oil collection is expected over the next few days.
If all were carrying the same flow (and if of the same size and driving pressure this is a reasonable assumption) then the flow will rise to 14,000 bd when all the ports are closed, and there will still be leakage under the cap to be reduced.

Given that the Enterprise can only handle 15,000 bd at most, this is one of the reasons why the ports remain open and that the system to draw off additional oil through the choke and kill lines is being accelerated.

Read more!