Showing posts with label erosion. Show all posts

Saturday, August 2, 2014

Waterjetting 24a - Cutting concrete - 1

There are a number of differences that take place when high-pressure waterjet operators change from a lower pressure, higher volume flow rate to one where the jets are operated at a higher pressure, with a smaller jet size. One way of illustrating the difference is in the way that the jet will interact with concrete, and that is the theme of this particular article.

Concrete is made up of two different material types, there is the cement and there is the aggregate.


Figure 1. Slot cut into concrete, showing the pebbles of the aggregate (brown) that are held in place with the finer cement (grey)

In an earlier post I wrote about the use of waterjets to remove damaged concrete from bridge decks and garage floors. In this short series the focus is going to be more on cutting through the concrete for whatever reason that it is necessary. It is the reason, however, that will likely help select the best way to cut the material.

In a typical concrete the cement paste is considerably weaker than the pebbles that make up the aggregate. Using the compressive strength of the material as a guide that of the cement may, for example, be less than a tenth of the value of that of the aggregate. And yet, when repairs are to be made to the concrete, or when pieces must be cut out, the systems are generally designed to cut through the harder aggregate.


Figure 2. Conventional approach to cutting through concrete.

The system that is used has to be capable of cutting through the hardest material in the mix, and that is usually the individual aggregate particles. (We will cover the rebar in the mix in a later post).

The slot to be created, is often not that critical in itself. For example we needed, at one time, to insert an opening in a series of concrete walls. Because this was done in the center of a university campus, the benefits of the relatively quiet waterjet cutting over jackhammers and other means of removal were significant, as was the amount of time required for set-up of the equipment. But one immediate aspect of the job was that the outlines of the hole that had to be cut were not that critical.

This is because, after the hole was to be cut, then carpenters would install a frame to hold a door, and they needed some space at the edge of the hole for adjustments, so that the tolerance on the cut was roughly plus or minus half-an-inch which covered the size of the aggregate particles.

This meant that it was not necessary to cut through these pebbles in the wall, but rather it meant that the system could be designed purely to remove the softer phase of the concrete, the cement, without needing the pressure to cut through the harder aggregate.


Figure 3. Concrete schematic showing where water jets have removed the cement (central white zone) from around the aggregate (darker blocks).

If all the cement is removed from around a piece of aggregate (Figure 3) then there is nothing holding it in place, and so the force of the waterjet (if that is used for the removal) will be enough to lift the pebble out of the slot. As a result the slot can be created at a much lower pressure than would be the case if the pressure had to be adjusted to cut through the aggregate.


Figure 4. Schematic of a slot created in concrete through removing the cement from around the aggregate particles without the need to cut through the aggregate.

The edges of the hole are not as smooth as they would be if the cut were made through the pebbles, but on the other hand the rough nature of the surface means that any later infilling of the slot with fresh concrete will have a rough surface to bond to so that the adhesion between the two layers will be much greater than that from a conventional repair.

Because the jets do not have to cut through the aggregate the cuts can be made a t much lower pressure (in the case of the University walls at less than 10,000 psi). This makes it easier to build relatively simple equipment at low cost to do the job. Back when this particular series of cuts were made it was not possible to buy reliable swivels that would allow the jets to spin and cover a larger area of the slot surface. Instead Dr Clark Barker, who designed the tool, used a four-bar linkage to allow the jet to sweep out an oval path on the wall, with the overall platform for the system mounted on a shop lifter.


Figure 5. Simple tool used to slot concrete. The high pressure hose is connected to the cutting lance on the rhs of the picture. The lance is held in a pivot at the back of the beam, and caused to oscillate through the rotation of an off-center connection to the wheel at the front of the beam. Drive to that wheel is through a chain from a motor that is not shown. The orange frame is a conventional shop lifter.

The connection to the driving wheel shown in Figure 5 could be adjusted, as could the position of the wheel along the beam, in this way adjusting the width and height of each orbit of the lance.


Figure 6. Slot cut through an 11-inch thick concrete wall using an orbiting waterjet.

The exposed rebar was cut later, using a cutting torch. A number of walls were cut in this fashion, and though the slots went through the walls in each case, the jet was large enough (around 0.05 inches diameter) that it was able to rebound within the cut and undercut the pebbles and remove them without the jet being directed directly at the cement under the pebbles.


Figure 7. Slots cut through a concrete wall using a high-pressure waterjet. Note aggregate pebbles are sticking out of the cement.

The walls were cut through to a height of about six-feet in less than an hour of cutting time, though there was some additional time needed to move the cutting platform up to cover the top of the slot. The nozzle was moved into the cut after each two passes, with the assembly being slowly raised over the cut length, using the shop lifter, and then lowered again before moving the lance into the slot. Changing the distance also changed the angle of the jet to the cut surface, and helped in getting the jet under any of the pebbles still attached to the concrete.

I’ll continue on this topic next time.

Read more!

Thursday, March 13, 2014

Waterjetting 19a - a little history

A small personal introduction – some fifty-odd years ago I was about to graduate with a BSc degree from the University of Leeds and was then offered the option of going on for a doctorate. Since this was a Mining Department they had a number of different options that I could have followed, but I discussed this with my father, who was responsible for mechanization of one of the National Coal Board areas, and chose to study the development of high-pressure waterjets as it applied to mining.

The technology was in an extremely early stage of its development at the time in the West, although as I rapidly learned, there were already major uses for the technology in what was then the USSR. And so, with a laboratory that contained a small Uraca 9,500 psi, 4 gpm pump, I began a study that led to a lifetime career.

Some of the early things that I learned came to be adopted throughout the industry, and some of the lessons quietly disappeared. But I thought it would be interesting to go back to some of that work, particularly tying in the work done around the world in the cutting of coal and rock, so that some of these lessons could become clearer, remembered and passed on.

I was fortunate that Leeds was close to the National Lending Library at Boston Spa, and thus we came to an agreement that should I need any of the foreign papers (particularly those in Russian) not otherwise available, that they would machine translate these for me, and then we would put them into technical English. (Not nearly as easy as it sounds since computational power was relatively at about the level of an abacus relative to the standards of today).

In the beginning we were much more focused on the work that the Russians had carried out in cutting rock, although once I came to Rolla that relatively rapidly switched over into studying the work done on the mining of coal. However it may make the story more easy to follow if I begin with a return to the beginning and then work through the use in coal mining and follow that through into rock cutting.

Just after I began this series I wrote about the early work in what is now the country of Georgia where the native inhabitants were collecting gold in flumes lined with sheepskins that they hung in trees to dry – only to have a bunch of Greek thieves led by some guy called Jason, come along and steal them. They had used the natural force of streams to erode away the valuable ore deposits and carry the debris down streams and into the flumes. This idea was then developed by the Romans. After weakening and breaking gold ore in Spain through fire and gravitational collapse, they used a diverted stream to carry the broken ore out into flumes, where again the gold could be captured.

It has been said that after the Fall of Rome and the following Dark Ages that it took the world over a thousand years to get back to the technological levels that the Romans had achieved (the example of concrete is often used). In a sense this is also true of what is now known as hydraulic mining, since the practice largely fell off the scene until the use of Hushing was resurrected in the UK. The technique involves storing water behind a dam and then rapidly releasing it in a torrent to wash out and carry ore and overlying cover away down into prepared flumes. The area around such mines (found in the Yorkshire dales) is characterized by the deep channels cut into the ground by the water flow.


Figure 1. The region above the mine at Bunton in Swaledale, where hushing was used to expose and erode the mineral veins. (My Learning )

These mines date back to the early 1800’s while earlier reported work in Cornwall (based on the use in the North) in about 1500 was not apparently as successful and led to some loss of life. But that reference does indicate that the practice was already in use in Yorkshire, although there are few records to describe it before the citation above.

And so the first lesson to learn is that, if you hit a body (in this case rock and the overlying soil) with enough total force and water volume, that the target will erode and be carried away by the water flow. This is something that is evident whenever there is a severe storm along a coast around the world. See, for example, the following sequence of photos of the coastal highway near Ocean Beach CA in 2010.


Figure 2. Wave erosion of the highway near San Francisco (USGS )

In this case the shoreline was eaten back a distance of some 184 feet. And each winter we are shown the evidence of waves eating away at the foundations of houses built too close to an eroding cliff wall.

Yet it was not until the gold-rush days in California following the discovery at Sutters Mill on the American River in 1848, that large-scale water volumes were first used for the removal of not only the soil overlying the gold, but also the removal and disintegration of the gold-bearing sandstone beneath. And that is the story that I will tell next time. Although I will close with a description form that time of Sutter's Fort.
Ten miles from the river we passed Sutters fort, an old looking heap of buildings surrounded by an high wall of unburnt brick, & situated in the midst of a pleasant fertile plain, covered with grass and a few scattering oaks, with numerous tame cattle & mules. We walked by the wagon & at night cooked our suppers, rolled our blankets around us & lay down to rest on the ground, with nothing but the broad canopy of the heavens over us & slept soundly without fear or molestation.
For those not in the know Sutters Fort is to be found in the heart of downtown Sacramento.

Read more!

Thursday, May 9, 2013

Waterjetting 9a - the instant of contact

Plain high-pressure waterjets penetrate into material in a different way than that which occurs when abrasive is used to make cutting easier. And even with abrasive there are different ways in which the target will react depending on how brittle that it is. In this next segment I will write just about the stages that occur as water alone cuts into a target.

In its simplest form consider first a spherical drop of water, moving at very high speed, which suddenly strikes a flat surface.


Figure 1. Droplet striking a flat surface

As the droplet impacts the surface, but can’t penetrate it, so the water that comes into contact with the surface tries to flow away along the surface, to get out of the way of the volume of water striking the surface behind it.

But in the early stages of the impact (see inset) the edges of the droplet ahead of that lateral flow are coming down onto the surface faster than the water can move that is trying to escape. In this range of activity the distance that the edge of the droplet must travel, L, remains smaller than the distance, D, that the water must move to escape.

This instantly traps the water and with confinement comes a very rapid increase in pressure along the edge of the drop. This pressure also acts on the target surface, so that it is pushed down a little. This pressure was first measured by John Field at the Cavendish Lab in Cambridge, UK, who found that it could exceed three times the water hammer pressure that the water might otherwise exert.

For those not that familiar with the term, the water hammer pressure is also sometimes called the hydraulic shock pressure, and it can occur when a valve is suddenly closed in a feed line, and this sends a shock or pressure wave back up the line. (This is what can sometimes cause banging in feed pipes). Often there is a small air cushion built into water lines to act as a sponge, when such a shock occurs, since otherwise the repetitive shocks can cause parts to fail.

This becomes more of a problem with higher pressures because the equation for the pressure that is generated is given by the equation:

Pressure = fluid density x impact velocity x sound speed in the fluid

Compare this with the impact pressure when a shock is not generated:

Pressure = 0.5 x fluid density x (impact velocity)^2

As a very rough rule of thumb, the speed of sound in water is roughly 4,800 ft per second.

If a waterjet is driven out of a nozzle at a pressure of 40,000 psi then the speed at which it is moving can be roughly calculated as:

Jet velocity (ft/sec) = 12 x Square root (Pressure)

The jet velocity, to a first approximation, is thus 12 x 200 = 2,400 ft/sec.

The Water Hammer Pressure is thus 2 x (4,800/2,400) = 2 x 2 = 4 times the pressure exerted by the water more conventionally. Since that driving pressure was, in this case, 40,000 psi, then the water hammer pressure would be 160,000 psi. With the multiplier that Dr. Field found, this can take that pressure up to around 500,000 psi for that instant of contact.

It is, however, only applied to the target at that instant of impact, and where there is the spherical end of the drop to cause the pressure accumulation across the face.

It does, however, cause a very high lateral jet to shoot out of the jet, at about the point that the droplet curvature no longer provides confinement (at about 1/3 of the droplet diameter measured radially from the center of contact).

John Brunton, also at the Cavendish, has provided photographs of the damage done in that instant of contact.


Figure 2. Droplet impact damage on a sheet of Plexiglas (Brunton “High Speed Liquid Impact” Proc Royal Soc London, 1965. P 79 - 85.)

Part of the damage comes from the high lateral velocity of the released water running into the wall of material not compressed under the generated pressure. Mike Rochester found that the diameter of this ring crack closely followed the diameter of the nozzle from which the droplet was released.


Figure 3. Relative size of the ring crack to that of the originating nozzle (jet head) ( M.C. Rochester, J.H.Brunton “High Speed Impact of Liquid Jets on Solids” First BHRA symp Jet Cutting Tech, April `972, Coventry UK, paper A1.)

In our case, however, the jet is not a single droplet, but rather, at least close to the nozzle, a steady stream with the pressure constant across the diameter.

Thus, in the microseconds after the first impact, as the jet continues to flow down onto the target, so it is flowing out across the damaged zone created by that first impact. The resulting pattern of erosion, which we captured in aluminum, changes as the target moves away from the nozzle. Close to the nozzle the wear pattern looks like this:


Figure 4. Damage pattern around the impact point of a jet on aluminum, target close to the nozzle.

The pattern, close to the nozzle, shows that directly under the jet the pressure is relatively even on the surface of the metal. With no differential pressure across the grain boundaries in that region, the metal is uniformly compressed, and suffers no erosion. At the edges of the jet, however, there is not only the original ring crack damage created on the instant of impact, but also there is a differential pressure along the edges of the jet, which helps to dislodge those initial grains, and provide crack loci for the water to exploit and remove material as it moves away from the original contact surface. The greatest portion of the damage, at this point lies outside the edges of the impacting jet as the laterally flowing jet erodes material as the jet continues to flow.

As the target is moved further from the nozzle, the pressure profile changes from one with a constant pressure over the jet, to one where the central constant pressure region starts to decline in size. Rehbinder calculated the two components of the pressure in the target at the beginning of this erosion process at that point and provided the following mathematical plot.


Figure 5. Impact pressures calculated for the pressure into the target and that along it, during waterjet flow. (Rehbinder, G., "Erosion Resistance of Rock," paper E1, 4th International Symposium on Jet Cutting Technology, Canterbury, UK, April, 1978, pp. E1-1 - E1-10.)

The result of this change in the pressure profile of the jet as it moves away from the nozzle can be seen in the change in the erosion patterns of the jet as it strikes an aluminum target, and that will be the topic for the next post.

Read more!

Friday, September 14, 2012

Waterjetting 1b - Force, Pressure and Flow volume.

This is the second in a series on some of the ways in which high pressure water jets can be used. The series was introduced last week.

Back in September of 2012 archaeologists found the remains of the last king of England to die in battle. He was Richard III, to whom Shakespeare gave the line “a horse, a horse, my kingdom for a horse!” He died because a blow to his head was focused down to a very high local pressure, even though the overall force of the blow might not have been that great.


Figure 1. Gothic Armor of the type worn by Richard III. (Detroit Institute of Arts)

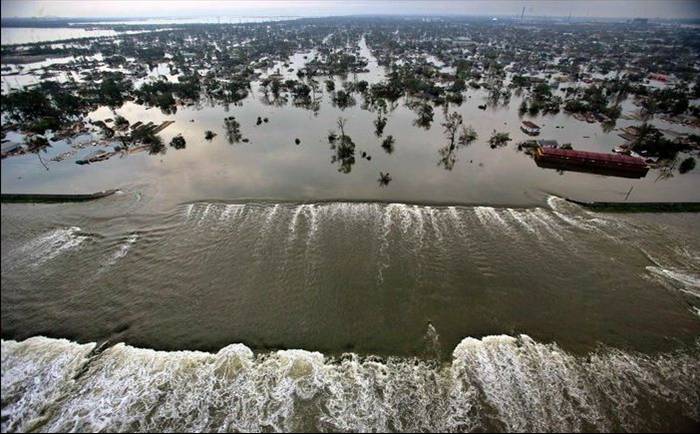
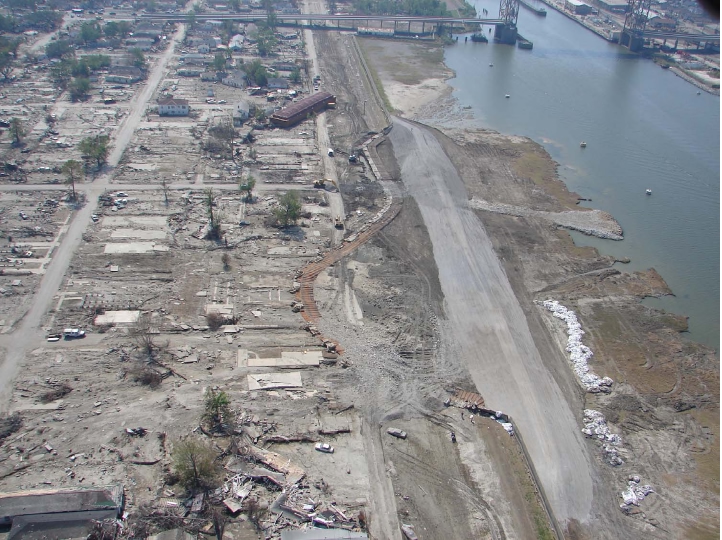
On the other hand, in the middle of Hurricane Katrina, seven years ago, a barge broke through the levee wall above the Lower 9th Ward in New Orleans, LA (NOLA) and released a wall of water that swept through the district. The pressure of the water was quite low, but the overall force it exerted demolished the buildings in its path, and swept them off their foundations for eighteen blocks back from the levee. In this case force, not pressure, was the cause of the damage.


Figure 2. The Lower 9th Ward in New Orleans after Katrina, as the water falls, it flows back into the Industrial Canal. The barge that broke through the levee is on the right. Most of the debris lined the second row of trees back from the levee. (Tulane)

It is this initial relationship between force and pressure, and the role that each has to play in the use of waterjets to remove material that form the topic not only for today, but in a number of the posts that will follow. Waterjetting applications now cover a wide spectrum of different uses, and finding the best choice of pressure and flow (which combine to give power) will change from job to job, and hopefully these posts will help make the choice easier.

It is raining outside. As the water drops hit the soil, the water soaks into the soil by penetrating along the existing cracks that exist between the grains of the soil. After a short time the water fills this space, and as it continues to rain, the impact of new rain drops hit the thin wedges of water that now run down into the soil. Although at much lower forces the action is the same as when you hit a wedge driven into a log with a hammer. The wedge pushes the two walls on either side apart, and a crack grows. One of the key elements that give waterjet cutting its advantage is this transformation from an impact force into a pressure, and most particularly a pressure which is applied against all the surfaces with which the water is in contact. It is a point that will be repeated many times.


Figure 3. The stages of soil erosion – the white arrows in (b) and (c) show the small pressures that are exerted on the particles as additional raindrops keep falling on the water in the ground. This lifts the top two particles in (c) so that the flow of water will carry them away.

With the soil there is not that much material holding the grains together, and so as the rain continues, the soil grains begin to separate from those on either side. Water gets underneath the grains and starts to lift the individual grains free from the mass. Since most land is not flat, the water will now start to flow away under the continued rain, and as it does it carries some of the soil particles that have been freed. This is a simple explanation for the erosion that happens in fields, dirt roads, and other exposed surfaces as they weather. As materials get stronger this process can take much longer to be seen. A high quality stone will erode at the rate of perhaps an inch every thousand years, depending on local weather patterns. There are buildings and bridges built by the Romans all over Europe to prove that point. A weaker granite (and one thinks of the granite in the walls of the Basilica in St Louis as an example) may severely erode within a hundred.

Which brings up an important point: the performance of a waterjet stream is not just controlled by what happens upstream of the nozzle in the delivery system, but it is also affected by the material that it is hitting. And I’ll come back to that in future posts.

First, however, consider what happened during Hurricane Katrina in the Lower 9th Ward. When the barge broke through the levee wall and was carried into the district, it rode on a wall of water that was initially no more than about 30 ft high. We can make a very crude estimate of the pressure of the initial wall of water (neglecting any impact due to the speed at which it moved) based on the height of that wave. A cubic foot of water weighs 62.4 lbs. It sits on an area of 12 x 12 = 144 square inches, so that the pressure under that water is 62.4/144 = 0.43 pounds per square inch (psi). Since that is somewhat close to half-a-psi, as a very simple way of getting the pressure at the bottom of a column of water one can just divide the height in two, and call it psi instead of feet.

So, in the case of that wall of water the pressure at the bottom of the wall would be 30/2 – 15 psi. Since the pressure increases with depth, the average pressure over the height will be half of that, or 7.5 psi. That pressure, by itself, does not appear that powerful.

But when the wave hits a building that pressure is applied over the entire wall. So if the building is 40 ft long and 10 ft high, then the area that sees that pressure is 40 x 12 x 10 x 12 = 57,600 square inches. If that small (7.5 psi) pressure is applied over the whole area, then the force = pressure x area = 7.5 x 57,600 psi = 432,000 lb.

You can now perhaps understand why, when the wave hit the first rows of houses in NOLA that they almost immediately disintegrated, and were carried back as broken debris for about ten blocks.


Figure 4. Aerial view of the Lower 9th Ward after the water had drained, and the levee had been replaced. For a sense of scale there is a school bus sitting partially under the barge, and that is the yellow dot at the end of the upper arrow. Each of the flat slabs to the left of the levee marks where a house stood. When we visited the site the house slabs were as shown, but there was still water – and some live fish, standing in the district. (Tulane )

This was a terrible disaster, but there are occasions, particularly in mining, where this terrible force, combining low pressure but high volume flow rates, can be harnessed to do useful work. Such flows are something that our ancestors have known for millennia, and were used as a way of mining from before the age of pumps, and l will tell how they did it in some later articles.

But in most cases we don’t have that amount of water, and the job is more often one where we want to precisely cut a hole, perhaps, in one of the walls of a building, rather than destroying the building. And we haven’t the patience to wait a hundred years to cut through a block of stone. So how do we speed it up? And so we come back to the death of King Richard.

Back in the day a foot soldier could make a bit of money in a battle by knocking a knight off his horse, and then holding him for ransom. The weapon that they used for this was generally known as a poleaxe. These come in various shapes, but one general idea was to have a hammer on one side of the long pole. Thus, by swinging the pole one could hit a knight with a force of say 50 – lbs. and this could knock him off his horse, allowing him – in the best of such worlds – to be captured alive and then ransomed.


Figure 5. Modern Reproduction of a poleax from about the time of the Wars of the Roses (Wallace Collection)

However that hammer head could measure about a square inch or two, and neither the force nor the pressure would have been enough to penetrate armor or a helmet of the type King Richard wore (Figure 1). To give the footman that advantage the design was changed to include a small spike in the center of the hammer.


Figure 6. Spiked Poleaxe from about 1582, (Royal Armories, Leeds) via My Armory.com)

Now when the force of 50-lb is applied through the hammer to the target it is not distributed over a square inch (giving a pressure of 50-psi). Instead it is focused down on a point that is less than a twentieth of an inch across. Total area of the circular point comes from pi x radius squared = 3.14 x 0.025 x 0.025 = 0.002 sq inches. Pressure applied through the spike to the helmet = 50/0.002 = 25,000 psi. That is enough for the spike to pierce through the metal helmet and the bone underneath, killing Richard III. Battle over, England had a new king, Henry VII, and the War of the Roses was over.

The intent of the two examples is to show how, in some circumstances, high volume flow rates at low pressure can do the most damage, and in others that much higher pressure applied over a much smaller area is the most effective. They are extreme examples but seek to illustrate the point, and in many cases neither extreme (highest pressure, lowest flow or lowest pressure, highest flow) will give the best answer. There are cutting conditions where operational concerns and benefits would argue that pressures of 90,000 psi, and flow rates around 1 gpm will be the best business choice. In other cases a flow of a thousand gpm, but at a pressure of 1,000 psi will be the most economic and viable way to remove soil, and weaker rocks like coal. This series is aimed, in part, at giving you the knowledge that will help you decide where, within that range, to make that balance, between flow and pressure.

(For those reading this series who are not that familiar with blogging conventions, the words that are highlighted in blue are links. So that if you want to read more about that specific topic, clicking on the highlighted words will take you to a web page that gives more information).

UPDATE: 1. This post was updated in 2013, after the body had been positively identified as that of the late King. The validation included a check on the DNA of the remains, which was compared with that of descendants of the family line.
UPDATE: 2. This post was slightly modified on April 19, 2013 to clarify some points that were not explained as well as I thought they were.

Read more!

Thursday, September 9, 2010

Deepwater Oil Spill - evidence of erosion

There was, apparently, no briefing today on the Deepwater Oil Spill. However RockyPaloma has put up a number of videos on Youtube showing an internal video inspection of the blowout preventer (BOP) with pictures of severe metal erosion.

Erosion within the BOP (RockyPaloma )

Some of it seems to have eaten around the plate of the shear ram, in at least one place, though I have not watched this in real time and am not sure of all the locations.

Possible erosion of the BOP wall around the shear ram plate. (RockyPaloma)


The video sequences include one of the shear ram plates retracting )

And one showing the deformed drill pipe surrounded by the eroded annular preventer, gives some indication of the extent to which sand in the oil/natural gas/water mix was eating out the internal surfaces of the BOP, and allowing the leak to increase in size, over time, a point that I made, quite early in the proceedings.

MoonofA has given a more concise, yet comprehensive picture of what the camera saw, together with a sketch of the ram assembly showing what the various parts are that are shown in the video. Ricx also adds an interesting question.

For those who need reminding of the structure of the BOP, PhilMB has put up a graphic section of the structure, so that you can tell which view corresponds with what.

The problem, of course, is that it is not clear when the different stages of erosion occurred. While there is some, there is not a lot of difference in wear surface patterns under differing flow regimes, containing different abrasive concentrations at different flow speeds. Because the erosion took place over the relatively long time intervals that it did, I am surprised in a way that it did not do a lot more damage than it did. Certainly some of the gaps might have been filled if the top hat “junk shots” had been continued longer than they were.

View of the crushed DP with surrounding erosion (RockyPaloma)

The investigation is, however, still in its early stages, and I imagine that there will be a lot more expert testimony on the structures (which likely means that at some time they will be cut apart to provide sectioned specimens). That is not going to be a simple short-term operation or investigation. And at the same time the pressure is now no longer on the relief well to seal in the oil and gas, so that too is likely to proceed at a gentler pace.

Read more!

Tuesday, June 15, 2010

Deepwater Oil Spill - why flow rates are increasing

Tonight the President will talk to the nation about the oil disaster that has been going on in the Gulf of Mexico for over a month. That will likely be the news story of the night, followed by the answers to the five questions that lawmakers have of BP. By that time I will also be starting a daily visit to the National Hurricane Center to see if there are any signs of coming problems. All of which being said, now might be a good time to talk about erosion, how it is changing the Deepwater Horizon well conditions, and why precautions about the flow increasing are probably wise. And I am going to recap bits of an old Tech Talk, as I do so. (It’s partly why they are there.)

To begin with a simple point – fluid (oil and gas) will only move from one place to another if something is pushing it. (Newton’s first law). For the fluid in the reservoir under the Gulf, this force pushing the oil out is the difference in pressure between the oil in the rock, and the pressure in the well. The pressure of the oil in the rock is 12,000 psi. When the well was drilled the pressure of the mud that filled the well was over 13,000 psi and no oil moved into the well. Just before the disaster the fluid in the well was changed from mud to seawater. This lowered the pressure of the fluid in the well below that of the fluid in the rock, a differential pressure now existed, and where there was a passage through which the oil and gas could flow, and they did. The question has always been – how much?


Gas flows more easily through cracks than oil, and the disaster was first evident when leaking gas reached the drilling rig, and then ignited. The BOP then, at least partially, functioned. After the rig sank, the riser also sank, bending the pipe just above the BOP. At that time there were reports that a Coast Guard ROV examined the underwater assembly and did not see any obvious oil leaks. A couple of days later the flow was suggested at about 1,000 bd, and this then escalated to 5,000 bd. As cameras began to publically monitor the outlet of the riser the estimates started to grow, but a not-well-publicized effort measured the flow out of the riser, and found that it was around 8,000 bd, with allowance for leaks, the overall flow was estimated to be perhaps 12,000 bd. Once the broken part of the riser was removed and a cap placed over the well, a significant portion of the escaping oil was captured and could then be measured as it flowed into the surface vessel recovering it. Those values are currently at around 15,500 bd. BP is currently planning on additional capture this week of up to another 10,000 bd, and preparing for a worst case scenario with a flow rate of 80,000 bd. These numbers vary a lot, and yet they could all be correct.

Why? Well its called erosion, and simply put, the oil and gas that are flowing out of the rock are bringing small amounts of that rock (in the form of sand) out with them. Rocks that contain lots of oil are not that strong and are easily worn away by the flow of fluid through them.

Let me make an analogy with soil. If I make a hill of soil, and leave it sit for a while there will be a number of rainstorms fall on the soil. Initially the surface will all erode relatively evenly under the diffused flow after the rain, but very quickly weaker parts of the soil will be removed faster and instead of a smooth surface, the soil will be selectively eroded and channels or rills will start to form on the surface.

Hillside rill channels formed as initially diffuse rainwater water flow concentrates and erodes channels

These are larger than the passageways around the individual grains of soil, and so it is easier for the water to flow in these channels, and so more water collects in them and moves through them. As it does, because the fluid can easily get around the soil particles, and this was a weaker area already, more soil is removed, and the channels get deeper. This is known as concentrating the flow and means that, over time the channels grow bigger, the fluid flows faster, and it has a greater potential for erosion.

This also happens when oil and gas start to flow from a reservoir. It is generally not a good thing to allow, since the sand is still in the oil and gas when it reaches the surface and it is expensive to get out – as well as causing the problems I am about to talk about. So to stop it the well is fitted with a screen when it is first opened. The screen holds the rock particles (sand) in place around the well, slowing if not completely stopping the creation of the channels.

But sometimes the deposit doesn’t flow very well, the oil may be heavier, or other reasons, and in this case allowing those channels to develop can help production. This technique is known as CHOPS – Cold Heavy Oil Production with Sand. (The report cited is a multi-chapter pdf). The impact of allowing the sand to flow with the oil and gas (to be produced in the terminology) is very significant.

Simplified change in production from a well with the sand being produced (upper curve) relative to conventional flow (lower curve). (The curves have been smoothed and only a sample of the “noisy” data is shown). Government of Alberta CHOPS Report

There is thus a very good reason, from the oil in the rock point of view, for the production to have been increasing the way that it has. And for it to increase to the levels that BP are taking precautions to capture. And because they cannot get access to the flow channels to restrain their growth and hold the sand until the relief wells are drilled, that increase may well be unavoidable.

Now to the second part of the puzzle, which is what that sand does to the flow passages. The DOE release of some of the documents from BP included pressure measurements at different points along the BOP as taken on the 25th of May.

Pressures along the BOP on May 25th (DOE )

Because of the erosion, values only exist transiently, so dates become important.

When I cut with an abrasive slurry system the jet flows through a nozzle that is about 1 mm in diameter (0.04 inches). With a pressure drop of 5,000 psi across the nozzle, that jet, once formed, will cut through casing steel in around 15 seconds. It will cut through ASTM – A108 steel to a depth of over an inch at a traverse speed of 1.5 inches a minute. (Cement is much easier to cut). In this way very small initial openings are very easily made wider, to allow a greater volume flow. (And for those who assert that changing material properties will stop erosion, one of my upcoming papers deals with what happens to diamond).

The pressures across the BOP don’t show the pressure drops that they did earlier in this disaster. At one time it was reported that the pressure below the BOP was in the 8-9,000 psi range and that above it 2,800 psi with the 2,250 psi pressure being that of the seawater outside the riser. At that time I calculated that a flow of 500 gallons per minute (17,000 bd) would only require a gap in the range of 0.5 to 0.7 inches in effective diameter to allow that flow, at that pressure drop.

The pressure below the BOP is now at 4,400 psi with a pressure drop of around 2,150 psi which will slow the erosion significantly – but not totally. For that pressure drop to have occurred, for the same flow rate, the effective equivalent diameter through the BOP need only increase by 0.1 inches to 0.8 inches, which is not a lot. Were the effective diameter to increase by only another 0.15 inches the flow would increase to 25,000 bd, and if the effective diameter were to double to about 1.7 inches, then the flow would reach the maximum capacity that BP will be able to handle of 80,000 bd . Given the steady erosion that the BOP is seeing, and that a slow rate over time still gets there, perhaps it is not foolish of BP to bring in that additional capture and storage capacity.

And since a picture sometimes helps, the following picture shows a single ASJ jet at 5,000 psi cutting the walls of the OmniMax Theater under the Gateway Arch in St Louis. We cut the full 15 ft of the new wall exposure with the system (to make the hole for the theater to be put into). The jet flow rate was around 5 gpm.


And this was the cut after a single pass, we were cutting about 18 inches deep on a cut (rock and cement cut a lot easier than metal – though we accidentally ran over a couple of those bolts and cut them right off).

Dolomite and chert cut with an ASJ in the walls of the Omnimax Theater under the Arch in St Louis. (Its all hidden behind the concrete wall now).

Now you will notice that this says nothing about those ideas such as that propounded by Dougr that the casing has been cracked and oil is escaping into the surrounding rock., and that the casing is becoming a lot weaker. There are two reasons for this, firstly if there was a crack, in the same way as with the BOP, then over time that would have been eaten away as oil, gas and mud flowed through it. Once a flow starts it will rapidly eat out a larger passage, as the above has demonstrated. Once that passage was created then oil flow through it to the surface would make it impossible to see what was going on around the well (look at the cloud above the BOP). In fact there are very clear pictures from under the BOP. This would seem to show that there is no oil leaking there at present.

The other thing to remember is that BP are planning on using the second LMRP cap effectively as a seal on the well. They could not do that if the upper segments of the casing were damaged, and I imagine that they have enough data from the Top Kill testing to reassure themselves of that.

Read more!