Wednesday, April 21, 2010

Some hopefully closing thoughts for now on Icelandic volcanoes

The re-opening of the European skies means, among other things, a couple of days of quiet here at Bit Tooth, as I have now left home on a somewhat circuitous trip to the UK. Hopefully I will arrive on Saturday morning, by which time a lot of the major disruption should be over. Public debate will likely now center on who was to blame and for what.

However as a follow-up to my earlier post on aircraft damage and the damage to fighters in particular, I do note that there are reports of two aircraft already having been damaged following the removal of the ban on flying, (H/t Admiral Valdemar) and that after Pinatubo erupted, aircraft damage was found in over 20 planes flying up to 1,000 km distant from the volcano.

This is probably, barring a major change in Iceland, my last post on this topic for a while – I expect that it won’t come up again for about a year until there is an eruption at Katla or Laki, potentially about ten times the size of the current event, and that the whole issue will come back into the headlines. So I thought I would explain why I think that there will still be an eruption further along the rift line, and how, simplistically why I expect this to happen. Call it a summary of the posts to date if you will.

Let me walk you through my thinking. Iceland sits on the spot where the plates that comprise the shell of the Earth, are slowly moving apart. The plate edges are marked in pink, and by the line of volcanoes, in this graphic.

Map of Iceland showing major volcanoes (The Times of London)

If you look at the Icelandic Met Office website, they show, every two minutes, where the latest earthquakes in Iceland have occurred over the past two days. Looking at the current picture, one can locate the earthquakes relative to the joint plane and the line of volcanoes.


Note that if you double click on the map it will enlarge – vide:

Area around Eyjafyallajokull, showing the current earthquakes there

It is not however Eyjafyallajokul that has my interest. Let me try and explain why. The two plates which lie either side of the line of volcanoes are moving apart at a rate of about an inch a year. As theplates move apart they pull on the rock that sits between them, so that it splits and cracks, and emits the energy release from that fracture that we call an earthquake. As the splits grow they create a weakness plane along the fault line. Under the fracture zone there is a magma that will force its way to the surface, when it finds a weakness of fracture plane that is large enough to start the magma flow.

Once the magma starts to flow it will open the fissure under pressure, and erode the walls of the passage until you get the standard round shape for the conduit that carries magma to the caldera where it is ejected. But the pressure of the flow also helps push the rock apart, and in the process can open adjacent passages in the rock under tension, allowing a secondary flow to establish. That will likely lead, within a year of so, to the more dramatic eruption of Katla, which sits under the Myrdalsjokull glacier.

But there has been a lot of activity up around the north end of the larger glacier near the peak called Grimsfjatt. This is sometimes referred to as the Loki volcano. And this may be creating the circumstances for a rupture that will equate to that of Laki, which is currently quiescent.

But stepping back a minute to look at the overall activities that occur when plates interact, what has been learned in places such as California, is that when the plates are moving together and not building up stress, then there are always a series of small earthquakes going on along the fault, as the ground accommodates the movement.

California quakes of the last two days

It is only when the earthquakes stop happening in a region that the stresses start to build up. And the longer there is between quakes, then generally the larger the quake is that marks the end of the quiescent period.

But those are compression/shear failures and movements. In Iceland the rock is moving apart under tension, with the added complexity of an underlying magma trying to escape through preferred fracture zones. Yet looking at the current location of the quakes in Iceland, there haven’t been any in the zone between Myrdalsjokull and Vatnajokull. Now a) this is where Laki lies and b) having been only watching for just over a week, this may be building large sand castles out of very dry sand, but nevertheless it is a little bit of a puzzler, and so, based on three different thought threads, I suspect that while the current eruption may rumble on for a while, and fade rapidly from the MSM, sometime within the next 18-months Iceland will be back in the headlines, posing a much greater problem for Europe.

Having said which, I’m still optimistic about getting into London this weekend, we shall see how it transpires.

Read more!

Tuesday, April 20, 2010

Winds, plumes, travel and the Iceland volcano is not predictable

Following an increase in the ash clouds generated by the volcano at Eyjafjallajokull NATS has issued the following statement for today:
The situation regarding the volcanic eruption in Iceland remains dynamic and the latest information from the Met Office shows that the situation today will continue to be variable.

Based on the latest Met Office information, part of Scottish airspace including Aberdeen, Inverness and Edinburgh airports will continue to be available from 1300-1900 today, and also south to Newcastle Airport. Restrictions will remain in place over the rest of UK airspace below 20,000ft.

Overnight the CAA, in line with new guidance from the International Civil Aviation Organisation (ICAO) decided flights above the ash cloud will be permitted in the UK; between 1300-1900 this will enable aircraft movements above 20,000ft in UK airspace.
The Met Office, whose models of the ash cloud have come under criticism has responded by noting
The Met Office uses multiple dispersion models endorsed by the international meteorological community. The output from the Met Office volcanic ash dispersion model has been compared with our neighbouring VAACs in Canada and France since the beginning of this incident and the results are consistent.

Our models are confirmed by observations which have seen ash in the UK and south of England. These include:
• Met Office and NERC aircraft have observed volcanic ash in UK airspace at varying heights.
• Multiple land observations have recorded ash in the skies across the UK, including across southern Britain.
• Balloon observations have shown a 600 m deep ash cloud at an altitude of 4 km across parts of the UK.

NATO F16 fighter jets have reported engine damage, due to volcanic ash when flying through European airspace.
And given that there is some blame now being tossed around the main stream media, as well as some blogs, on who made what decision they go on to point out
It is for the aviation industry and regulator to set thresholds for safe ash ingestion. Currently, world-wide advice from ICAO is based on engine and airframe manufacturers stating a zero tolerance to ash ingestion. This means that aircraft should not be exposed to any volcanic ash.

Eurocontrol is trying to get this restriction eased, with the support of some airlines to:
A proposal by Eurocontrol, the intergovernmental air traffic body, to European transport ministers suggested the implementation of a no-fly zone limited to the visible ash plume as determined by satellite images and adequate buffer areas which could be updated on a six-hour basis.

The current map of the ash that the Met Office has produced shows that there is a way of getting from the US to the UK without going through the cloud, but only as far south as Newcastle. There are moves to do a better job on predicting where these flight paths would be. While planes can now fly over the UK, it is getting down through the space below 20,000 ft that contains the ash that is the problem, and you have to do that if you are landing or taking off.


But it also shows how the ash has put a barrier between Northern and Southern Europe.

After the height of the cloud being produced had reduced over the past few days, there was hope that it was not getting high enough into the atmosphere to reach Europe (i.e. below 3 miles). The latest outburst, however, put more material higher into the atmosphere strengthening the cloud once more.

I wrote yesterday about the size of the particles, and why those that are in the 50 – 100 micron range are particularly dangerous as abrasive cutting threats to aircraft. Smaller particle sizes, around 5 microns, are the greater personal threat, since these very small yet sharp particles can be breathed into the lungs and do damage, both chemically and mechanically. Larger particles fall out of the cloud fairly rapidly but the smaller particles, which are formed both from the contact of the molten lava with water and ice (which causes it to shatter) and from the bursting of bubbles of gas that are being emitted within the molten rock, and burst as it reaches the surface, are the ones carried higher both by the relative heat of the plume, but also by the prevailing winds.

Part of the problem that is sustaining the cloud has been the warm weather with a fairly steady wind direction although this is swinging south, with the predictions through Friday suggesting that the cloud may intensify while narrowing. There is some hope that an increase in wind speed could displace and disperse the ash already over parts of Europe confining the restricted zones (which sadly seem likely to include the airports of the south of England) to a narrower band. The projected path of the wind does seem to vary with forecasters, this is from Accuweather, which has the cloud sweeping back north over Scotland, and moving away from the southern airports, while the Met Office view (above) has the cloud further South and covering them.

Projected Ash Cloud path (Accuweather)

Winds at the level of the ash plume are also expected to become more aligned Tuesday into Wednesday, which may result in the ash plume becoming more concentrated and posing a greater threat to air travel. This, of course, is assuming the volcano continues to erupt through then.

On a positive note, AccuWeather.com meteorologists expect this greater alignment of the winds to cause the ash plume to become narrower and affect a smaller area.

Looking at American Airlines policy for future travelers, while the notice says:
Due to the ash plume from the volcano that erupted in Iceland, some of American Airlines operations have been disrupted. Ticketed customers whose flights have been cancelled are being re-accommodated on other American Airlines flights with available seats. If a customer whose flight has been cancelled decides to cancel or reschedule their trip instead of continuing travel, that customer is eligible for a refund on any unused portion of their ticket.

In addition, American offers customers whose flights have not been canceled, but who are traveling to or from the impacted areas in the next several days, the convenience to change their plans. Ticketed customers may change flights as shown below, without incurring a charge for changing their tickets.
In essence the “shown below” says that passengers who booked flights before April 16th, and who plan to fly between the 16th (when this started) and the 22nd (Thursday) can change tickets without penalty only if they rebook their flight to occur before May 3rd. Part of the problem with that is of course no-one knows how long this will go on, and in my own case I have to be back here by a certain date, and so am a bit restricted in my options. (Oh, and they only allow one re-booking).

Read more!

Monday, April 19, 2010

Some thoughts on aircraft damage from the Iceland volcano

There is increasing pressure on the governments in Europe to allow commercial aircraft flights to resume, because of the financial hardships they are suffering. At the same time the impact from the absence of teachers and students in classes, as they resume after the Easter break, has caused some additional problems around the UK. Unfortunately just having commercial companies take jets up and fly them around for a while, does not necessarily prove that the skies are completely safe. There is also a little discrepancy between the commercial company reports of no damage to their planes, and the damage to a Belgian F-16 plane that came back with deposits in their engines (this is separate from the Finnish F/A-18 problems). The build-up of melted ash can be seen on this borescope picture of the inside of one of the Finnish engines.


The deal that has been developed with break the airspace into three separate parts, that which remains closed, that which is restricted and that which is open, based on the conditions in different zones. The problem now will come in determining and maintaining the records of what the conditions are like along different flight paths, so that pilots and airlines can make the best judgment of how, where and if to fly. The process cannot be left to the pilots since it is very difficult to discern when the particle cloud reaches a level of intensity that can cause problems.

The melting of the ash particles so that they coat the inner parts of the engine, possibly closing off critical openings in the engine are the most common problem that a plane will apparently encounter in a brief exposure to the ash cloud. It is not, however the only problem. A 747, for example, flies at a cruising speed of 567 mph. This converts to 830 ft/sec. At these particle velocities there is an entire commercial industry out there that uses such particles, in a waterjet stream, to cut through a wide range of materials. As an illustration, this is a half-inch thick piece of titanium that one of my graduate students cut using such a system. The jet was travelling across the piece at a speed of several inches a minute, and cutting all the way through (the cut was made fairly slowly to ensure an acceptable surface finish). In steel when running a standard quality test the jet of abrasive, which carries about 0.8 lb of abrasive particles in every gallon of water, will cut to a depth of about 1.75 inches at a cutting speed of 1.5 inches/minute.

Half-inch thick titanium sheet cut through by abrasive slurry jet. (The face visible if that which was exposed by the cut).

If the impact speeds are higher, then it is not necessary to have particles in the water, though that generally requires higher impact velocities. (There is this story about Andy Fyall of the Royal Aircraft Establishment - Farnborough, a Concorde and a typhoon that I don’t seem able to find on the web! But I remember it from an early ELSI conference).

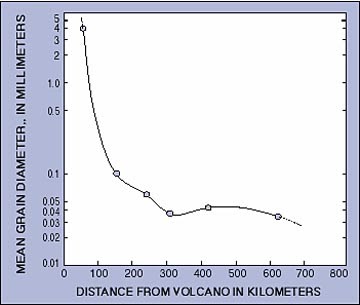
The particles that are used in cutting are quite small (they typically come out of orifices that are smaller than 0.03-inches) but they are quite densely packed in the jet, relative to those encountered in the plume of a volcano, but at high speed it does not take that many to start to do damage. Damage is reduced, however, at particle sizes below 100 microns, (0.1 mm). So the question is, how big are the ash particles? While there is not enough data yet on the current eruption particles, there is some from the eruption at Mt St Helens.

Particle size v travel distance (Sarna-Wojcicki and others, 1981)

The particles that will travel furthest appear to be mostly in the 50 micron and below range, though 100 km from the volcano there will still be 100 micron particles in the cloud that could be significantly damaging. (Respirable particles are down in the 5-micron range).

The question thus remains as to how to tell if the particles are there in sufficient density to cause problems. And so far there is not a lot of consensus it appears on how that determination will be made. The problem also arises in determining at which height the plume is going to be, since the varying intensity of the eruption has been ejecting material to different heights. More recently higher clouds have obscured the plume, on occasion, from satellite view, which is partly because the intensity is, perhaps temporarily perhaps not, decreased.

There are, unfortunately a lot more things that we don't know, as yet, about the eruption, that will only be determined with time. Thus it seems a little better to proceed with caution at this point, until the techniques for establishing what is safe, and what not, have been clearly established.


Read more!

European airspace 6:45 am CST


This image showing 128 aircraft in European airspace, would indicate that airlines are beginning to find ways of getting planes into the air. However the patterns show where the plume is still probably too dense to allow flights. Including the UK, where the Government is apparently going to send Navy ships to help.

And just to make you feel comfortable about listening to experts, this was the listing for Europe's ten most dangerous volcanoes (in terms of their impact on Europe) just four days ago:

Volcano . . . . . . . . .Country . . . . . .Affected population . . . Values of residences at risk
(US $billion)
1. Vesuvius . . . . . . . Italy . . . . . . . . 1,651,950 . . . . . . . . . . 66.1
2. Campi Flegrei . . . Italy . . . . . . . . . . 144,144 . . . . . . . . . . .7.8
3. La Soufriere . . . . .Guadeloupe, . . . . .94,037 . . . . . . . . . . . 3.8
Guadeloupe France
4. Etna . . . . . . . . . . . Italy . . . . . . . . . . 70,819 . . . . . . . . . . .. 2.8
5. Agua de Pau . . . . .Azores, . . . . . . . .34,307 . . . . . . . . . . . 1.4
Portugal
6. Soufriere . . . . . Saint Vincent . . . . . .24,493 . . . . . . . . . . .1.0
Saint Vincent, Caribbean
7. Furnas . . . . . . . Azores, . . . . . . . . . .19,862 . . . . . . . . . . 0.8
Portugal
8. Sete Cidades . . . Azores, . . . . . . . . . 17,889 . . . . . . . . . . . 0.7
Portugal
9. Hekla . . . . . . . ..Iceland . . . . . . . . . . 10,024 . . . . . . . . . . .0.4
10. Mt Pelee . . . . .Martinique, . . . . . . .10,002 . . . . . . . . . . 0.4
France
Hekla is the only one from Iceland that makes the list, which, given that Katla is likely to be perhaps ten times as large as the current eruption from Eyjafjallajokull, and may well go in the next 2 years perhaps underscores the occasional need to question expert opinion.

Read more!

Sunday, April 18, 2010

Early mining and transportation of coal

On the 18th April, Ugo Bardi posted a piece on The Oil Drum discussing some of the dark sides of coal mining. In particular he started with one of his favorite paintings “The Riverbank’ by Telemaco Signorini. He ties this picture of men towing a coal barge into a memory of his earlier life. And so, from the other end of that supply chain, that brought coal to Florence, today I am going to talk about the early history of coal, but from the region around Newcastle, and further north up by Alnwick, which is where my coal-mining ancestors came from.

When I saw Ugo’s painting I was immediately reminded of the movie “1612” which has, in a more modern recreation, more than five men hauling a boat.

Towing a boat – from the movie “1612” directed by Vladimir Khotinenko

The commentary that comes with the DVD makes some point of the difficulty in hauling the boat, even though it was relatively small and there are more than twice as many men as Ugo portrayed. It was also unladen.

Though the crew look strong, they are after all actors, and are attached to the boat by a harness of ropes that it likely take more time for them to learn to properly operate than they had for that shoot. (As one of the comments on Ugo’s post noted, this scene could have been taken to reproduce the Russian painter Ilya Repin’s painting “Burlaki” which it emulates).

Ugo also deals more with the political constraints in the coal trade after 1860. Since I am more concerned with discussing reserves and methods of mining and the more technical considerations, I am going to start a little earlier in the use of coal, when it was mined in the UK, and some of the early practices.

When coal was first used, the legends have it that it was collected along the sea coast near Tynemouth in the North-East of England, and taken to the local priory and the rights to the coal were given to the monks. (The scene is illustrated in the movie “Nine Centuries of Coal.” (Which if I understand the BFI rules you can download if you are at a British University or school).

Coal was used to provide the fire for the local lighthouse at Tynemouth until about 150 years ago. The monks did well by their ownership of the coal rights, by 1281 they were shipping the coal down to London where it brought nineteen shillings a chauldron. (There were 20 shillings to a pound, which is currently worth $1.44, though the value has historically been higher). A chauldron was a wagon that would hold around 80,000 cubic inches of coal or just over 45 cu. Ft. of coal, or about 1.7 tons of coal, when it was mined. when it got down to London the measure changed so that while whle, by one definition a chauldron was 36 bushels, but
8 chaldrons at Newcastle, makes at London about 15 chaldron.
The unit was abolished in 1963.

1870 Chauldrons at the Beamish Mining Museum (Terry Pinnegar )

So we know that coal was heading down to London, where King Edward (because the fumes apparently sickened his mother) banned it, with the threat of torture and death to those that used it. (This is the king that had Wllliam Wallace, as played by Mel Gibson in Braveheart, chopped into bits, while alive, so he generally wasn't someone you wanted to mess with). But is was sufficiently cheaper than the wood alternative that the ban had little effect, and coal has been a major fuel in the United Kingdom ever since.

The king, incidentally, was compensated in other ways, since a royal duty was imposed on the mining and shipping of coal, that brought in a large income over the years. In 1818 the mines were estimated to produce 15 million tons a year, for domestic use, with additional amounts used by industry. The duty was 9 shillings and four pence to London, and 6 shillings to other ports in the UK. And this brought in a revenue of 570,066 pounds in 1816. Some 2.25 million chauldrons of coal were shipped, roughly half of which originated in Newcastle. The coal was generally taken by rail, though hauled by horse until the invention of the locomotive (by a local miner), down to the river where equipment known as “drops” were used to swing the chauldron down to the collier for unloading.

The staithes at Wallsend by Hair (1844)

The staithes includes the short pier and feeds to the drop.
At its extremity is fixed the drop, consisting of a square frame hung upon pulleys, and counterbalanced by back weights. The loaded wagon, together with the square frame, descends by its own gravity to the hatchway of the vessel, delivers its coals, and, in turn the empty wagon is returned by means of the balance weights, the motion heing in both cases regulated by a brake wheel. A man is lowered down with the wagon , whose business is to unhasp its moveable bottom, and thereby let the coals drop into the hold of the vessel.
The drop was patented in 1800 by Wm Chapman. A tapered spout led the coal into the hold of smaller keels (the boats used to carry the coal out to larger ships). The main coal mined came from the Bensham and I 1836 93 ships carried some 15,519 tons of this coal through the staithe at Wallsend to London, where it sold for 7s 9d a ton, while one ship carried 318 tons from the Bensham Wallsend, and it sold for 8s 6d a ton. (Personal note – I have worked in the Bensham seam, albeit some 125 years later).

Mining had progressed by that time from the initial collection of loose coal washed up on the beach (sea coal) to mining it where it outcropped, and then mining back into the seam outcrop from the surface, and this often meant that the tunnel that was mined sloped down into the ground. The dirt that was mined out was dumped at the entrance to the tunnel, and often created a small narrow feature on the ground, a tip, some of which can still be seen today. Our family, for example, used to be coal miners at Eglingham. This is a small village found in the North East of England, not that far from the Scottish border.

Aerial view of North of England (Google Earth)

I have marked an overview of the village with a couple of arrows to show where the two tips were that I have walked around (and where my ancestors no doubt worked) on an overall view of the village (using Google Earth) which is at the bottom of the picture. Given the fact that I am going to show you that it was a mining site, it was wryly amusing to see signs in the local parish hall asking for action to protest the location of wind turbines on this "pristine English countryside."

Eglingham (Google Earth)

Right in the center of the picture however, if one zooms in until GE tilts a bit, you can see a third tip quite clearly.

Pit tip at Eglingham (Google Earth)
My aunt (the Teacher) had done some research on where we lived, and this was not down in the current village but up where the top left arrow points, and where all that is left of the houses are circles where the gorse grows, but where rabbit warrens have brought up small pieces of china, and other remnants of the time that folk lived there, only a couple of hundred years ago.

Ruins at Tarry, near Eglingham (55deg 28”55.84” 1deg 49”43.76W)

In those days it was pre-mechanization, and the miners used only a pick and a shovel to break the coal from the solid. It was then put into woven baskets called corves, that were dragged to the surface on a wooden board, either by younger boys, or by women. The board would slide up the tip, and could be dumped before being dragged back underground. The tunnels were driven to the height of the coal, which in the area may have been somewhere around 4 ft 10 inches (with an interbedded layer of stone that ranged from 3 inches to 2 ft thick) or 5 ft 8 inches, (with 3 ft of interbedded stone) not the richest of workings. It was only after some years, and larger mine developments that the baskets went from being carried on folks backs, or on these boards, to being put on flat cars and moved by rail.

Bottom of the shaft, Walbottle Colliery Hair (1844)

Stephenson, who invented the Rocket, the first locomotive as a way of hauling mine chauldrons down to the staithes, began his working career by weaving canes into these corves in a pit yard.

In these small operations, with all the excavation from the initial tunnel into the side of the hill, the coal was mined by individual workers, or families. The miner would work with a candle as a light, and that would be mounted to a wooden post that he would use to hold the roof up.

Undercutting the coal

Laying on his side, he would then take his pick and cut out a slot at the bottom of the coal. This undercut, perhaps 3 ft deep, would be cut along the total face of the coal, before the miner would start to work up. Depending on the size of the tunnel he may also make a vertical cut to create a second free face. (You can see some of these markings in the walls of old stone quarries, and in the mines under Bath in the UK, and the salt mine at Wieliczka in Poland). He would then break out the coal in individual lumps that were several inches in size. (4-6 would be ideal). If he used the joints (called cleat) and the bedding planes of the coal, then this was not too difficult to do, and so he could mine out several chauldron’s worth of coal in a shift. In the measurement of the work he did using a modern measure it would take as little as 4 joules/cc of energy to break out that coal.

Wall at Wielicza, showing the pick patterns used to cut the initial slot to which the rest of the rock would then be broken.

A typical shift would be around 8 hours, but it shrank, so that when I went into the mines it lasted only 7.25 hours. As well as mining the coal, the miner had to hold up the roof, and, if there was a roof fall repair it. But of all his concerns the most prevalent was that of gas. Remember both that he had to breathe, and that coal emits methane, or natural gas, from most seams. The methane will burn, or in the right concentrations in the mine can explode. And when that happens it consumes all the oxygen, so that even if the miners aren’t in an area where the explosion happened then they may still die as the de-oxgenated air circulates underground.

Initially the miners would work only a short distance into the outcrop and though the mining site here was worked at least from the early 1700’s, in the south of England miners had already learned to sink shafts and to mine out from them – but I will get to that next time.

Read more!

Saturday, April 17, 2010

Iceland volcanoes and when can I travel?

Yikes! Flightradar has taken out their inclusion of the airports in the overall picture, and the emptiness of the European skies becomes even more apparent.

European skies at 12:48 pm CST

And so the next question comes as to how long will this last? And unfortunately the news there is not particularly encouraging. Even short flights through light ash from this eruption have already been shown to damage aircraft and so authorities are rightly going to be very conservative on what they allow. The backlog on passengers already caught in the cancellations are now up to more than a week.
Honeymooners Paul and Tracy Sheehan, of Kent, England, were among those trapped by the ashy atmosphere.

The couple arrived to catch a transfer flight on Friday night - only to hear the next available American Airlines flight home was one week away.
The hope that the volcano would have settled down enough to allow a scientific flight over the plume has been premature, and the flight was cancelled as the eruption continues.

Given that there is talk of other volcanoes erupting it might also be appropriate to go into a little more depth on the scale of these events. They are measured on a scale known as the Volcanic Explosivity Index (VEI) with values that can be read from this table:
Volcano Explosivity Index (from Rowlett UNC)

The initial measure for Eyjafjallajokull was at a scale of 1, but it hasn’t been possible to assess where it is now fitting. In contrast, as I noted Thursday when Katla last went it was at a scale of 5, and the Mount Pinatubo eruption in 1991 was a 6.

However Pinatubo was a single event eruption, ejecting some 15 – 30 million tons of sulfur dioxide, along with 5.5 cubic km of other material in a nine hour period on June 15th. The consequences lasted much longer.
The eruption plume of Mount Pinatubo's various gases and ash reached high into the atmosphere within two hours of the eruption, attaining an altitude of 34 km (21 miles) high and over 400 km (250 miles) wide. This eruption was the largest disturbance of the stratosphere since the eruption of Krakatau in 1883 (but ten times larger than Mount St. Helens in 1980). The aerosol cloud spread around the earth in two weeks and covered the planet within a year. During 1992 and 1993, the Ozone hole over Antarctica reached an unprecedented size.

The cloud over the earth reduced global temperatures. In 1992 and 1993, the average temperature in the Northern Hemisphere was reduced 0.5 to 0.6°C and the entire planet was cooled 0.4 to 0.5°C. The maximum reduction in global temperature occurred in August 1992 with a reduction of 0.73°C. The eruption is believed to have influenced such events as 1993 floods along the Mississippi river and the drought in the Sahel region of Africa. The United States experienced its third coldest and third wettest summer in 77 years during 1992
.
Icelandic volcanoes are generally less immediately intense, spread over a longer fissure, and last much longer.

The initial fissure eruption at Eyjafjallajokull (AP)

Katla which is expected to possibly also erupt, last erupted in a major way in 1918, with 25 major eruptions in the last 1200 years. (Which gives an average interval of 48 years). These intervals are likely to continue, on average, given that the two plates that touch under Iceland are moving apart at a speed of around 19 mm/year. While this sounds as though it is a small amount, it puts the rock in tension, which makes it a lot easier for fluid such as magma to penetrate through flaws and fissures in the rock, as these open under that movement. It also helps explain why, on occasion, there is a progression of the eruption up a line, as we are currently seeing with Eyjafjallajokull. And given that there may be volcanic activity at different places, it might help to see where the different volcanic/separation zones are:

The EVZ, fissure swarms, central volcanoes and calderas. H and T denote the Hekla and Torfaj ̈okull central volcanoes. Focal mechanism and location of the 1987 Vatnafj ̈oll earthquake are from Bjarnason and Einarsson [1991].(Jonsson )

The Eastern Volcanic Zone (EVZ) shown above is thought to now be more dominant than the Western one, which has been relatively inactive, and it is here that the current crop of potential eruptive sources sit and that are being worried over. (Hekla for example has erupted in 1970 (VEI 3); 1980 (VEI 3); 1981 (VEI 2); 1991 (VEI 3); and 2000 (VEI 3).

So, given that the last Eyjafjallajokull eruption lasted over a year, and the length of time since the last Katla eruption, and the movement of the plates being relatively consistent, there is not a lot of room for optimism. It may not be an immediate follow-on in the human scale of time, but in geological terms a year later is almost such, so it may well be that the powers in Europe, and around the world, may have to rethink how folks can be moved, if air travel is going to be more of a hit and miss event for a couple of years. So will I get to Europe next week?

Read more!

Asphalt highways, gravel roads and the pig manure answer

One of the problems that the rising price of crude has created lies with the related cost of asphalt. As a result states are being more creative in spending their repair budgets, and it is interesting to see some of their answers. Asphalt is used extensively in creating the roads that we drive over every day. Because of this traffic, and movement of the underlying material, roadbeds can fail and erode. But not all do, at least to the extent of the majority. Just this last week the Asphalt Pavement Alliance has announced the winners of this years Perpetual Pavement Award. The winners have to be the owners of asphalt pavements that are at least 35 years old and have never had a structural failure, and the average time between resurfacing has to be no less than 10 years. There are ten awardees, with sections of highway that won being found in Alabama, Arkansas, Kentucky, Michigan, Minnesota, Mississippi, Missouri, Nebraska, South Carolina and Tennessee. The winners range in length up to 12 miles, and from Interstates to State Roads.

Asphalt has been getting more expensive, as the price of crude oil increases, and this reflects back to the state highway departments that must repair damaged roads.

In Illinois, for example, the average asphalt overlay will last between five and eight years (Illinois State Toll Highway Authority) or eight to fifteen years (Illinois Department of Transportation). The decision on repair is a function of both the amount of damage, and the amount of traffic. One consequence of this is the return from asphalt coated to gravel roads. Ugo Bardi recently commented on this at The Oil Drum. He noted that an early use of the Canadian Tar Sands was as a direct application as a roadbed material, and the same has been considered for the West Indies.

Asphalt is one of the most re-circulated of materials, since the material that is laid into the roadbed is only about 5% asphalt and 95% aggregate, so that when the original surface is removed as part of the resurfacing operation, about 80% of it is recycled. And it is not just the aggregate, and some of the binder that gets recycled.

Starting in 1994 Florida DOT has also mandated that the mix include recycled ground tire rubber.
From 1994 through 2007, Florida has recycled the equivalent of over 12.5 million passenger tires into asphalt pavements, saving valuable landfill space while improving the performance of our highways. That works out to over 471 passenger tires per lane mile. Current research shows benefits of combing both ground tire rubber and high tech polymers to improve asphalt binders even more.

Because of the changing price of oil, most states have an adjustment index for the price of asphalt that their construction contractors buy (and then charge the state for).

Some states are returning roads back from asphalt to gravel, though this is not as easy as it may at first appear, since the construction of the roadbeds is different, as is the maintenance, since a gravel road is graded back to quality, rather than being ground up and resurfaced. This is particularly true when road traffic is light, but a number of states are moving this way because of budget constraints.
Thirty-eight counties in Michigan replaced a total of 100 miles of asphalt roads with gravel because of decreasing funds in 2008-09, said Monica Ware, a spokeswoman for the County Road Association of Michigan.

In Montcalm County, Mich., 10 miles were converted to cut patching costs in 2009, said Randy Stearns, managing director of the county's road commission. He cited one road that cost a combined $39,244 in 2008 and early 2009 for patching, but only $7,300 to crush into gravel. More roads may be converted this summer, he said.
The relative costs of going from gravel to asphalt indicates that the transition comes at around 200 vehicles/day.

Relative costs for different road types (U of Minnesota )

Now the price of asphalt is anticipated to rise again, and so what are states to do? In Missouri, a state that grows a lot of pigs, – mainly in farms, though there is a concern over the rising numbers of feral hogs in the state. Putting the problem of disposing of a lot of porcine waste with the high cost of asphalt, folks in Missouri, at the highway leading into Six Flags at Eureka (just outside Saint Louis) have taken the logical next step.
The witnesses lining the bright stretch of North Outer Drive along Interstate 44 — particularly those with noses and an abiding interest in sustainable technology — won't soon forget the moment the red dump truck deposited a 15-ton load of the designer asphalt into a road paver late Wednesday morning.

"Whew!" gasped a worker with Pace Construction Co., the St. Louis County road contractor that joined forces with Innoventor, the Earth City-based engineering and design firm that perfected the process of converting the animal waste into a bio-oil used in asphalt binder.

To others, the air swelled with the sweet smell of potential for new manufacturing opportunities, jobs and, possibly, profits.

The initial stretch of road treated was some 500-ft long, and will get a significant seasonal traffic from the amusement park, accelerating wear potential and allowing the evaluation to be made in a shorter time.

The process was thought up and developed through Innoventor. Essentially the animal waste is converted into a bio-oil that can serve as the binder in the asphalt. The program is currently getting the close attention of the Missouri Department of Transportation, as well as the U.S. EPA. (And I suspect that the next time I drive by the site, I may roll down a window and have a quiet sniff).

It takes all kinds, to find the right answers.

Read more!