Showing posts with label eruption. Show all posts

Friday, September 12, 2014

Iceland livens up

Jón Frímann points to an interesting pattern of earthquakes around the caldera at Bardarbunga, suggesting that the volcano might be getting ready to erupt.

Icelandic Met Office.

It is hard to tell from the webcams, since Bardarbunga 2 is shaking too much. This may be bad weather - except that the weather shown at the first camera shows that it is clear on the left, suggesting that there is a lot more ash being thrown into the air. So this may be a more significant eruption already, due to the ash cloud.

Bardarbunga web cam at 10:43 am 12th Sept.

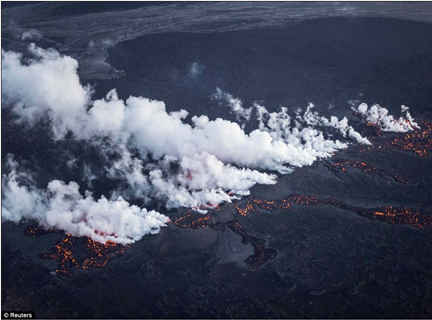
UPDATE: The increasing concern comes from the clouds of SO2 that are being emitted from the craters. This poses threats, not only to those in Iceland, but also potentially to some in Northern Europe. The smell of sulphur is now being detected in Norway. The latest path for the gases has been posted:


Figure 3. Path of the gas cloud from Iceland.(RUV )

The Icelandic Met Office is now issuing bulletins in English as well as Icelandic.

More later.

Read more!

Sunday, August 31, 2014

Global oil supply and Bárðarbunga

Some time ago magma started rising in the rocks near the Bárðarbunga volcano in Iceland, and after weeks of increasingly intensified earthquake activity, the first signs of eruption were found to have occurred under thick ice within the last week. These were not that visible to the general public. That eruption was followed by a second, where there were some streamers of magma across the surface, without causing any significant airborne dust to interfere with aircraft.

The delays in dramatic eruption footage, and the early decay in immediate activity has led a number of folk to anticipate that the risk has declined and for some the risks from the eruption are over, with one scientist commenting::
"If this eruption persists it could become a tourist attraction, as it will be relatively safe to approach, although the area is remote,"

Figure 1. The eruption at Bárðarbunga (from the first webcam) at 5:40 pm Aug 31.


Figure 2. The eruption at Bárðarbunga (from the second webcam) at 9:00 pm Aug 31.


The eruption is continuing and will likely continue, and potentially significantly worsen, over the next several months. Yet, in the world of instant highlights, headlines and Twitter the risks from the long-term eruption (which can be horrendously severe) are immediately glossed over as the eruption fails the “dramatic event” test.

This is uncomfortably similar to the situation that one sees when writing about “Peak Oil”. One can, on any individual day, find comforting headlines that tend to gloss over the longer-term problem that is being written, in increasingly large letters on the predictive wall of our future. But that does not hide the potential disaster that it presages, it merely conceals it from the general public.

The headlines are those that are short-term, and deal with the drivers for the daily fluctuations in oil price, rarely do they back off to look at the overall threat that the situation may presage. Similarly the eruption in Iceland looks relatively tranquil at the moment, but may be of a similar nature to that of 1783, which created, over a period of months, an absolute disaster in Europe, and may have been one of the contributing causes to the French Revolution. The problem with the oil crisis is that there is no similar history to look back on. (Not that this would matter to those “editors of the moment” who control the daily press).

If one were to step back from concerns over daily price fluctuations for oil and gasoline, and consider the import of the trend in international politics one could very easily be aghast at the situation. Not that one might tell this from the headlines.

Consider that, of the three international leaders in oil production, one – Russia – is currently set on a course that may well lead the rest of us into World War 3. As a consequence is likely to be unable to attract the financing that will allow it to even approach the current levels of oil production that it need to retain current production levels in the years to come.

The second of the three is Saudi Arabia. Glossing over any problems that the Kingdom may run into in the next couple of years with the terrorism that is sweeping though its neighbors, it is a country that has realized that today’s cornucopia is about over, and it must seriously invest in exploration and development. The KSA recognizes that if it is to have a chance at being able to even meet the bills for domestic consumption, let alone export income, as the years move onward, it must find new oil. Again it would seem that global commentators fail to realize that, while KSA is recognizing the problem, any finds of “elephantine fields” would require huge investments of money and time, given that they are now likely to be off-shore and sour (as with Safaniya and Manifa, even if such fields exist, which is very doubtful).

The Kingdom has repeatedly stated that it will not increase its production over current levels, despite the assumption of many commentators that they will have to, if global balance is to be retained between supply and demand. Put bluntly, their analysts have realized that, without new reserves that are currently still to be found, they will be unlikely to be able to meet even current targets without major new field finds. Yes, they have fields that are found and available, but in relative terms they are tiny when set against the current levels of production. (Bearing in mind that a 5% reduction in production per year from existing fields, a level now increasingly found to be overly optimistic, would still cut existing production by 450 kbd).

And so, gentle readers, as we have so often in the past, we return to prognostications of future American production. This should, realistically, be focused on the production from the USA, since that in Canada is tied to production from the oil sands and that is only likely to change at a slow (one might suggest geological, but that would be a little harsh) time frame.

And in the United States hope continues to focus on an assumed linear increase in production, month on month, from the Bakken and Eagle Ford Shales. That this is denied by even the local authorities (who also note that the Bakken is named after a local farming family). Their current estimate (assuming more than 200 drilling rigs, and there are currently only 192 is that the fields will peak in 2017, and will start to decline in around 2026. The problem with that estimate relates both to the number of rigs employed (which have to be higher) and the quality of the remaining reserve (which is highly unlikely to be of equivalent value to that which is now, or has been, developed in the past.

I would venture into the second tier producers, but they include those that lie in the MENA (such as Iraq and Libya) and are in even worse condition than KSA, and yet, as documented here repeatedly, these states seem increasingly unlikely to meet projections and thus are an ongoing and significant threat to a balance between global production and demand.

The global economy, and particularly the economies of the Western countries, are tied to a cheap source of energy and power – on which their industrial clout is based. Remove that underpinning, and the writing is clear on the wall about this, and current levels cannot be sustained.

But, as with the wish of the press to get “beyond” the “yesterday’s story" of Bárðarbunga, so the reality of the energy situation is unlikely to be recognized until, as with the Iceland volcano. its effects become too evident to ignore.

Read more!

Thursday, August 28, 2014

Iceland volcanic eruption may be under the ice

The BBC are reporting that small "cauldrons" have appeared on the glacier over the growing dyke of rock that is penetrating upwards in the Bárðarbunga region of Iceland. This suggests that the magma has reached the bottom of the ice, and causing it to melt, with the overlying cap then collapsing into the cavity. Jón Frímann notes that the water in Grímsvötn Lake has risen about 15 m, so that presumably is where it is flowing at the moment. That rise is equivalent to the melting of around 45 million cubic meters.


Figure 1. Location of the "cauldrons". Note also the progression north of the quakes over time, as the dyke extended. (Ice News)

The migration has also reached the Askja volcano, which might be a second path for the magma to reach the surface.

Erik Klemetti has written about the different scenarios that might happen should the magma reach that point, with there being some risk of an Eyjafjallajökull type eruption as one of five possible scenarios for the region.

As with the previous post on this activity, I will update below the fold for future developments.

UPDATE: 29th August.(There is a second under the fold(.
An eruption has begun in the northern end of the dyke. Because it is neither in the Askja caldera, nor under the ice, there is little ash cloud at the moment. According to the Ice News report:
Shortly after midnight a fissure eruption started between Dyngjujokull glacier and the Askja caldera in the Northern region of lava field Holuhraun. It is a fissure eruption on what appears to be a 300 metres long rift with a NA-SE direction. No volcanic ash has been detected with the radar system at the moment. The wind field conditions in the area are wind blowing toward NW at 12 m/s at 5 km altitude. Seismic eruption tremor is low indicating effusive eruption without significant explosive activity.
UPDATE #3: Here is a picture showing the outflow of magma, from Reuters via The Daily Mail.


Figure 1a, Magma flow out along the fissure.

2nd update on 29th August.
Watching the eruption on the on-site cameras, the Bárðarbunga 2 camera appears to be continuously shaken by earthquakes at 10:52 am Eastern, and the map of the quakes shows strong activity back at the Bárðarbunga caldera. It really depends on where the initial magma entry is into the dyke, which is most likely to be back at the south end of the dyke. This would increase the risk of at least some of the magma breaking through the ice cap and projecting an ice cloud.


Figure 2. Earthquake pattern on the morning of the 29th. (Icelandic Met Office via Wattsupwiththat).

Read more!

Saturday, August 23, 2014

A small eruption, so far (but the threat is getting bigger)

Jón Frímann is reporting that the eruption has started, but as yet is small. There are some web cameras and in the comments on his post there is some discussion of what they show, with the picture below showing what appears to be the start of a fissure eruption. This is consistent with an intrusion of the magma in the form of a dyke which is traceable from the earthquake patterns.


Figure 1. Webcam view of the start of the Bárðarbunga volcanic eruption.

The activity seems to be occurring in several places, with that part that is under the ice not being visible, were it be occurring, though if it breaks through the ice then this is where the larger plumes might be generated.

Figure 2.Earthquakes around the site (Icelandic Met Office)

The condition has been changed to RED, with the Met Office reporting that there are 150 to 400 m of ice above the surface in the region of maximum activity, and it will take some time for the magma to burn through this to the point where it ruptures, if it is big enough to do so. However the latest earthquakes include one of over 4.5 which is quite a bit bigger than earlier ones.

This has been UPDATED on 24 August

And on August 25th.

And on August 27th, as the quakes continue and approach the surface

.

The activity is continuing to grow.


Figure 3. Later on the 23rd. (Icelandic Met Office via Jón Frímann)

The eruption is definitely occurring along a rift in the rock. The development can be seen from a picture of the developing earthquakes from the 16th August, as Jón Frímann shows.


Figure 4. Development of the eruption as the magma moves along a rift to form a new dyke which is rising to the surface, prior to the eruption on the 16th August (Icelandic Met Office via Jón Frímann)

The growing size of the potential eruption can be seen from the latest picture of the earthquake activity, with it spreading away from the caldera.


Figure 5. Overview of Iceland showing the increasing scope of the activity on 24 Aug. (Icelandic Met Office)

The dyke is reported to be 40 km long already, and the magma, outside the ice cap may likely flow without much of it generating the high clouds of ash that are a threat to aircraft, and future weather patterns in Europe. (These eruptions can last some time). However if the bit under the icecap breaks through then the combination of water turning to steam and thermal shock on the rock can generate the very small particles which become a threat to both.

25th August Most of the activity is still occurring about 5 km below the surface, and the question becomes where, if anywhere, will the eruption reach the surface.


Figure 6. Earthquake activity 25th August 2014 (Icelandic Met Office).

The latest quake above magnitude 3.0 is at the northern end of the activity, suggesting that perhaps the magma is flowing in that direction, so that if it were to migrate to the surface then it would not come out under the ice cap. Which would be good news from the viewpoint that it is less likely that this will generate the high clouds of micro particles that might have occurred, as they did with the Eyjafyallajokul eruption in 2010.


There is, however, another concern that comes from the basaltic flows of lava, and was at its likely worst in 1783 when the nearby rift at Laki opened. The gases produced are toxic and were of sufficient volume that a large portion of the livestock and crops died, leading to the death of a quarter of the population from famine. The impact on Europe was also severe, with some suggesting it as a partial cause of the French Revolution. In part this was because of the resulting haze (which spread globally)which dropped temperatures around the world.

It also lasted eight months.

August 27th - The activity continues with quakes above 3.0 along the dyke, and with the earthquakes seeming to be approaching the surface.


Figure 7. Earthquke activity 27th August 2014 (Icelandic Met Office)

Read more!

Tuesday, July 8, 2014

Myrdalsjokull - is Katla getting ready to rumble again?

This is likely, again, not likely to amount to much, but as Jón Frímann has noted, the Katla volcano in Iceland is getting a bit antsy again. There were a couple of deep quakes nearly two weeks ago and there have been shallower and more numerous quakes since.

These might indicate that magma is making its way upwards. We saw this a few months ago, and it did not amount to anything in the end, but it is a little early to tell yet whether this pattern will be the same, or more serious.


Earthquakes in the Myrdalsjokull caldera July 7, 2014 (Icelandic Met Office)

For those who don't know, Katla has often erupted after Eyjafjallajokull, which noticeably erupted back in 2010, shutting down air traffic at the time. And Katla is often the more violent of the two - hence the current interest.

I will update this if it develops into something that may turn out to be more serious.

Read more!

Tuesday, July 19, 2011

Katla continues to develop toward an upcoming volcanic eruption

The Icelandic press is reporting that there are ponds collecting as the ice in the Myrdalsjokull glacier continues to melt from the increasing heat coming from the underlying volcano, Katla, in Iceland. (h/t Jón Frímann ).

Collapsing ice cap above Katla (Iceland Review – English, and Icelandic ) (Remember that the black cover is because of the ash from Eyjafjallajokull last year)

As the fractures from the earthquakes continue to fracture to the surface, so the paths that they create allow water to migrate down to the underlying hotter rock. This then converts to steam, and flows back up helping to further melt the underside of the ice sheet, with some water possibly escaping down the mountain, under the ice. These floods can be sudden, as was the one that took out the ring road around Iceland. That has now been repaired, a week after the flood took it out.

The narrowness of the fracture paths, at least initially, will slow magma migration and this will likely allow more additional activity at the surface, although Katla does not give a lot of warning before it erupts, apparently.

One of the misfortunes of having retired and given away many of my books is that I no longer have the references that relate quake size to rock damage. A lot of this work was done in the South African gold mines, which go down over 3 km (2 miles) and are thus at the depths of many of the current quakes around Katla. As the mines extended the workings so the weight of the surrounding rock shifted, and the speed of this (usually following a mine blast with explosives that broke out some rock) would cause rock fracture in the area.

Quakes could be created that were up to a magnitude 4, similar to some of those around Katla recently, and resulted in significant rock movement and fracture. Underground this leads to problems with keeping the tunnels open and safe for the workers (since the rock bursts can be violent and hurl rock fragments a long way, as well as creating air blasts that can also be dangerous). There have also been larger ones.

But I was trying to get some sense of displacement and damage as a function of seismic strength, since when the rock fractures there is often some crushing of the rock along the interface of the fracture, and this would then be removable by the upward pressure of magma, and the fractures released the overlying confinement. The initial crushed zone probably measures just a few inches, but will be eroded out by water/steam passage and the later passage of magma, since fractured rock is easily removed. This then gives the open passages for magma to move. If the fractures intersect then the intervening rock will likely also be removed since the magma has a higher density and thus more power than mere water or steam flows. There have now been several dozen quakes within the region of the Katla caldera, and knowing the damage zone from each would allow a better estimate of how damaged the rock is. Bear in mind that the re-healed fractures (healed by cooling magma) from earlier eruptions are likely the weakest links that are now failing and opening, and in the process, therefore rebuilding the network of passages that are needed for flow. The levels of permeability generated are orders of magnitude greater than that from a typical oil well.

Where the rock is attached to the overlying ice, then cracks in the rock can also occur in the overlying ice. And you may note that in the above picture apart from the circular rings of fractures, there are three well defined line cracks that cross the circular fractures. If you also look at the web cam you can see (in daylight) some of the lines where magma has flowed up to the surface in earlier eruptions (the picture shown in the last post).

So we now watch as the process continues to unfold.

Read more!

Sunday, July 17, 2011

Katla in Iceland is getting closer to a volcanic eruption

So what is the definition of “hours” that I should have used in anticipating the Katla eruption in my last post on this subject? I must confess that I had anticipated about 72 hours being the likely envelope within which we would see an eruption following the magnitude 3 quake that happened there on Wednesday. But here we are just into Monday, and there has been no eruption yet. But there has been another magnitude 3.8 quake, in this case:

07-18-2011 63.660 -19.116 3.8 magnitude (1.1 km deep 7.0 km ENE of Godabunga)

There have been a flurry of small quakes, that had both preceded the current larger one, and which have now followed it (at least a dozen).

Katla earthquakes of the last 24-hours. The green star denotes the larger earthquake referred to above (Icelandic Met Office)

In the 24 hours before this last there had been over a dozen other earthquakes within the caldera region. The stress is inducing more and more fractures into the rock (hence the earthquakes) and as these coalesce and the rock becomes fragmented in the region of previous magma flows, this creates the weakened channel along which the magma can force its way. Jón Frímann is not reporting any signs of the harmonics that signal significant magma movement at the moment though he suspects that the location of the quakes, now indicate that magma is making its way to the surface. Looking at the seismograph plot that he has there is no question that activity seems to be rising.

Just as a reminder there are two webcams on the site, one is here and the other is here. Neither is showing much yet.

Katla from second webcam at 12:33 am Eastern US time.

We shall see if this is just another step along the way, or if this is now at the point of erupting. But I suspect that it won't be before I get up in the morning, so goodnight!

UPDATE
Well looking at the cloud patterns this morning, if I wanted to stretch my imagination, they do suggest there may be some steam


But as I continue watching, it is purely an artifact of the light. And the scenes return to normal.

UPDATE 2 At the end of the day the sky is clear and there is nothing visible above the surfaces on eith webcam. And so we can relax for a little. The Icelandic Met Office is also saying that an eruption is not likely. However there continue to be a significant number of small quakes that are not just at the surface. Bear in mind that after fractures are created, if the magma is to get through them they have to be held open by the fluid pressure, and that has to work its way up as the magma migrates upwards, and this all takes time.

Read more!

Wednesday, July 13, 2011

Katla, the volcano in Iceland, seems about ready

Just before the eruption at Grimsvotn on 21st May, the relative quiescence of earthquakes above a level 3 along the volcanic rift that runs through Iceland was broken by a sequence along the line.

24 hours of earthquake activity in Iceland 22 May 2011 (Icelandic Met Office) Green stars indicate quakes above a level 3.0

with the more specific details
100) 05-21-2011 64,369 -17,201 3,6 (1,1 km deep 5,3 km SE of Grímsfjall)

101) 05-21-2011 64,154 -17,642 3,3 (1,1 km deep 30,2 km ENE of Laki)

102) 05-21-2011 64,366 -17,266 3,0 (1,1 km deep 4,3 km S of Grímsfjall)

103) 05-21-2011 63,905 -18,523 4,6 (1,1 km deep 23,1 km SW of Laki)

104) 05-21-2011 64,049 -17,770 3,1 (3,3 km deep 22,7 km E of Laki)

So now, following the events of the past few days at Katla, there has now been a larger earthquake at that site.

07-13-2011 63,651 -19,098 3,1 (1,1 km deep 7,6 km E of Goðabunga )

Quakes in the last 24-hours around Katla, the star denotes a quake larger than 3 (Icelandic Met Office)

So if you follow the logic from my previous post then Katla is about to erupt, since the larger quake denotes the creation or opening of a larger crack/ flaw/ chamber and now that the path is made, the magma should not be that far behind. We have moved through counting from months, to weeks, to days, and now I suspect we are into hours.

But at 9:38 pm all is still quiet:

Katla Webcam

Second Katla webcam
York Harbor Inn,
Maine
July 13, 2011

Read more!

Sunday, July 10, 2011

Why Katla is neither over nor dormant

There is a suggestion at Ice News that the volcano at Katla in Iceland is, and remains dormant. There is a similar article at the Volcanism blog noting that all is quiet. There are others including the Iceland Volcano and Earthquake blog and those who comment there, who believe, as I do, that the current events continue to presage a relatively strong eruption.

Let me step through some of the reasons for this, which involves me first going back to explaining the basic geology that is happening in Iceland, and then a little on the events that occur when rocks break, and what I conjecture then occurs post eruption, prior to the next time that one comes around. First I should add the caveat that one of the first things that one learns as a rock mechanic is that most rocks are different, i.e. there are very few cases where happened at one site is exactly repeated somewhere else, or the same the second time around, and rock properties change very rapidly over short distances, so that what I am about to write has a lot of generality to it, rather than being specific to this site. And I ask my colleagues to bear with me as I write what I recognize is a very simplified version of what happens, since I don't want to write a book chapter.

There is a certain amount of repetition in this post, of information that I have written over the past fifteen months, and for this I crave your indulgence. Nevertheless, looking at the evolution of the earthquakes around Katla since January of this year, it is clear that a magma passage has been created, which is still being developed, and will likely continue in that mode until an eruption occurs, with the likelihood that the longer it is now delayed, the larger that it will be, as I will explain below.

The volcanic complex at Eyjafjallajokull/Mrydalsjokull in Iceland is located where the Earth’s plates are moving relative to one another, and as they do so and create passages, magma from deeper within the Earth can make its way to the surface, giving the eruptions that occur from time to time. These occur through the volcanoes that line the two rifts that join in the middle of the island, Eyjafjallajokull and Katla, which lies under the Myrdalsjokull glacier, lying along the Eastern rift and on the Eurasian plate.

Illustration of the rifts through Iceland, and the location of the volcanoes (London Times)

Let me try a very simple analogy to try and explain what happens. Think of a sheet of plywood, floating in a bowl of hot glue. As I pull the sheet apart it will start to tear at some point within the sheet. The tear won’t be straight or initially continuous, and as it happens the tear will open a path for the underlying glue to flow up through the split to the surface, where it spills out, and then cools and hardens, re-attaching the two sides together and sealing over the underlying, still molten glue. The movement of the wood as it tears, lowers the forces (stresses) held within the sheet, and so, initially the wood becomes stable again. But as the sheet continues to be pulled apart, the stresses start to build again and that initial tear is now a weaker spot in the surface, and so when the pull again becomes too strong, the sheet will fail again in about the same place (the weakest link failing), opening a tear, glue will rise, sealing and reattaching the two surfaces, and the process repeats. And so, over time these points where the weakest links are located become, in the real equivalent, where volcanoes erupt at intervals. This is only partially valid as an analogy, since rock and wood fail in different ways, as I will explain, but it hopefully allows you to see a volcanic eruption as a part of a sequence of events, rather than just looking at the eruption as a single point in time.

So, if one begins with that gross simplification of events, consider now what has been happening in the region around Katla. When one applies a load to a rock sample it will start to fail normally somewhere at about 50% of the load at which it will totally fracture into pieces. The onset of that failure is detected because the cracks that are naturally found within the rock start to grow, and as they do they make sounds, and release small amounts of energy. At first the cracks that grow are somewhat randomly distributed through the sample, as any flaws that are favorably aligned to the growing stresses in the rock fail. Within a small 2-inch diameter core normally tested in the lab, this initial fracturing can only be detected with instruments and it is only when the rock gets to perhaps 80% of final load that cracking can be audibly detected. However, in the larger scale which is occurring in Iceland, these initial failure cracks are large enough that they release enough energy to be considered as small earthquakes when they occur. Initially, as the movement of the plates acts on the rock at their edges, in the same way as with with the rock core tested in the lab, these local failures and quakes are distributed throughout the region that is being stressed. And if one looks at the pattern of quakes along the rift region near Katla last February, for example, then one saw that the quakes were scattered around the region.

The scattered distribution of earthquakes in the Katla region of Iceland in February (source Icelandic Met Office)

At this time the quakes are occurring in the same way as we see the initial cracks starting to grow when we test a rock sample in the lab. There are some pre-existing weaknesses in the rock that are set so that as the load on the rock grows (the two plates are moving relatively steadily one to the other) that fail, and at these loads the distribution tends to be more random (although it also includes the weakness planes created during the last eruption).

As the cracks grow they relieve the surrounding rock of some stress, so that the load redistributes, but as the load continues to grow, so the longer weaker planes created in previous eruptions come to be more the weakest links in the surrounding rock structure, and the crack development (being simplistic) which generates the quakes begins to concentrate in location on the pre-weakened and damaged zones created in the run-up to previous earthquakes, the weakest links. So that if we look at the quake locations in April and May, one can see the regions where the quakes are occurring beginning to shrink down and focus around what turns out to be three regions.

Quakes around the region in April

Quakes in the same area in May

By last month, June, it was clear that the quakes were concentrating more on these regions and so I color coded the quakes for periods of ten days at a time.

Volcanic activity at the Katla volcano site in Iceland in June 2011. Red were in the first ten days, green in the second, and blue in the final eleven days of the month. Katla lies under the glacier Myrdalsjokull. (info from Icelandic Met Office)

The zones of concentration are in the caldera region of Katla (the bowl in the middle of the volcano), about half way between Eyjafjallajokull and Katla, and an odd grouping down near the sea.

So now we come to the first ten days of this month, and the flood of melt water from Katla. And this is where I want to explain why I am not convinced by the expert opinions suggesting there is no problem.

If one looks at the quake activity in the 24 hours before the flood, (which occurred at about 4 am Saturday the 9th) there was a flurry of small quakes in the caldera of the volcano.

Katla quakes in the last 24 hours (Icelandic Met Office )

The tear in the rock is focusing on the weak zone and beginning to open the crack up. Bear in mind that the magma under the surface rock (like the hot glue I mentioned in the beginning) can only get out through a weakened zone in the rock, and this has been developing over the past few days as the quakes show the development of a broadly damaged done under the caldera (as well as the one half-way to Eyjafjallajokull, though that is not as pronounced). Then, as Jon has noted at the Iceland Volcano and Earthquake blog, harmonics develop within the ground as the magma starts to move and the cycle are moving toward an eruption.

So now the question is, was the relatively small melt of the glacier ice that flooded the road indicative that the magma had flowed through the broken zone, and then cooled to seal off the cracks, even as the cracks had locally reduced the stress in the surrounding rock so that the pressure was relieved and the ground would become stable for another few decades.

I believe we already have the answer to that. If we look at the pattern of quakes after the event, looking at the Icelandic Met Office site as I write this at 9:30 pm Sunday, the pattern of quakes continues in the same places as it did prior to the flood.

Quakes in the last 24-hours (Icelandic Met Office)

For the fissures to be sealed and the stress distributed I expect that there will now have to be an eruption of magma to permeate the fractured zones of rock so that they no longer become susceptible to continued growth, as the overall stress on the rock is relieved. (The flow of hot glue that I mentioned at the top of the post).

As long as the quakes remain focused in the regions that they now are, those regions will continue to act as zones of stress concentration and thus further failure and weakening, until they are sealed by a larger eruption. And I expect that this will come sooner rather than later.

And, since the stress continues to build, vide the quakes continuing to happen, and the ground becomes more fractured as evidenced by those quakes, then the larger the passage will be through the ground and the greater the eruption.

Read more!

Saturday, July 9, 2011

Katla, the volcano in Iceland, begins?


View of the Katla volcanic site from a webcam

Last night there was a small flood of melted glacier water from the Myrdallsjokull glacier that sits over the Katla volvano . It took out a bridge on the Ring Road around Iceland but that initial flood is now subsiding. A flight over the volcano has shown only cracking of the ice at the moment.

View of the caldera at Katla – the ice is covered with ash from the earlier Eyjafjallajokull eruption.

There were a series of earthquakes around the caldera in the last 24-hours, though these too now seem to be subsiding.

Katla quakes in the last 24 hours (Icelandic Met Office )

There have also been some strong harmonic tremors under the glacier, which leads me to believe that this is just Katla clearing its throat, and in the next few days it may have a more powerful eruption. The search and rescue teams are out, and access is now restricted to the area. We’ll see how this plays out.

UPDATE: After a little quiescence after the flood, the earthquakes have resumed their pattern, again focusing in the southern edge of the caldera. So, despite others thinking that this may be all that happens, I rather believe that we are only at the beginning.

Quakes in the past 24 hours, taken at 13:34 Eastern US.

Read more!

Friday, June 17, 2011

Iceland volcanoes might be back soon and strong

Well I am not sure that this is yet that dramatic, but it is beginning to look as though it might be, and so it is worth putting up a shot from the Icelandic Met Office about earthquakes in the Myrdalsjokull (Katla) region that I just noticed has happened in the last 24-hours, actually at about 5:30 pm local time, on the 17th. The stars denote an earthquake greater than 3 occurring, and there has been a growing focus of the earthquakes around the Katla site over the past four months, some of which I had noted earlier. These now appear stronger and even more focussed.

Earthquakes in the last 24 hours around the Mydralsjokull site (Icelandic Met Office )

While three quakes by themselves are not that extra-ordinary, they need to be put in place with the gradual focusing of quakes that has taken place over the past six months, which I have mentioned in the past. And they need also to be considered in light of the historic past when Katla erupted about a year and a half after Eyjafjallajokull, which you may remember erupted in April 2010. Katla has, in this context, been a much greater eruption.

Gradually, over the past months, the quakes about Katla have become more focused in just a few spots, and the current further focus suggests that magma might now be starting to create a site for an eruption. To illustrate how this has happened I will repeat showing the April and May quakes, together with those for the June to date, showing first the initial 10 days and then everything up until today.

UPDATE: There was another at 3.3 on Saturday morning at 8:18 am, but it was over at Langjokull which is some distance North-West of the region that my truncated maps show. And there are a significant number of small quakes happening around it.

Quakes around the region in April

Quakes in the same area in May

At this point I changed the colors, though thinking that the eruption was a few months away I didn’t take enough care with my initial choices of color. For the first 10 days of June

Quakes in the region in the first 10 days in June

Then I added in that luminous green the quakes up until today, and since I am not that efficient in adding stars I put in the larger quakes a 3, a 3.1 and the largest at 3.8 - which is in the middle of the green spot under the “a” of Myrdal.

Quakes in the Katla region in June – squares are 3.o and greater.

So it begins to look as though Katla is beginning to stir. This could get interesting, perhaps a little sooner than I had thought. It also appears that I might not be alone in thinking that this may be a sign that magma is moving in. (I took out the reference to the earlier eruption since I had it wrong)

Read more!

Tuesday, March 23, 2010

The volcano in Iceland

The current volcanic eruption in Iceland raises a question of the Precautionary Principle but one calling for an opposing action to that most commonly sought in ameliorating damaging climate change. If I can summarize the situation in a somewhat condensed version, the current eruption in Iceland at the Eyjafjallajokull site has now been going on for a couple of days (video) and is throwing a plume of ash up to 5 miles into the overlying air.

View of the plume from the Eyjafjallajokull eruption (scienceblogs). More photos here

What should be a concern, it appears, however, is that this particular volcano, although in itself not that large, is often a precursor to the eruption of the Katla volcano, which is nearby but further north- east. While the current eruption started away from a glacier, the Katla lies under the Myrdalsjoekull glacier, and the precedents are not good.
"Eyjafjallajokull has blown three times in the past thousand years," Dr McGarvie told The Times, "in 920AD, in 1612 and between 1821 and 1823. Each time it set off Katla." The likelihood of Katla blowing could become clear "in a few weeks or a few months", he said.


The second Katla eruption has, historically, had much greater impacts since it has had the power to inject large volumes of particles and gases into the atmosphere that create a sufficiently dense cloud that sunlight is reduced, harvests are affected and famines result. For example when the nearby Laki fissures erupted in 1783 the results that were reported included:
Iceland's Laki volcano erupted in 1783, freeing gases that turned into smog. The smog floated across the Jet Stream, changing weather patterns. Many died from gas poisoning in the British Isles. Crop production fell in western Europe. Famine spread. Some even linked the eruption, which helped fuel famine, to the French Revolution. Painters in the 18th century illustrated fiery sunsets in their works.

The winter of 1784 was also one of the longest and coldest on record in North America. New England reported a record stretch of below-zero temperatures and New Jersey reported record snow accumulation. The Mississippi River also reportedly froze in New Orleans.
The last eruption of Katla was not that severe, although there was severe flooding. But it can be violent, throwing large volumes of material into the air. The consequence of the Laki eruption of 1783-4 (it lasted for eight months and ejected over 9 cubic miles of basaltic lava and a quarter of the population of Iceland died from starvation, the effect on winter temperatures in the US was evident.

(Sigurdsson 1982)

But it is not the fine particles that apparently cause the most climate impact, rather the large volumes of gases that also are ejected and turn into acid aerosols that contribute to the disastrous consequences. It has been projected that there were some 8 million tons of fluorine and 120 million tons of sulphur dioxide released. To put this in context, during the Mount Pinatubo eruption (which also had a short term cooling on global climate) the volcano is projected to have emitted some 20 million tons of sulfur dioxide and that this lowered the global temperature by perhaps 0.8 deg C in 1992. (The aerosols reflecting back more solar energy into space.)

Mount Pinatubo erupting (USGS photo)

The fissures themselves, from which the Laki lava flowed, stretch some 16- miles though not as a continuous crack, but rather the lava flowed from about 130 craters.

Laki craters (climate4you)

The general locations of the Katla to the earlier Laki and Eldgja eruptive flows is shown here:

Location of the Laki, Katla and Eldgja fissures, the current eruption is further south and west, on the hidden side of the Mydalsjokull glacier.

The severity of the impacts of these eruptions on the global climate and the resulting devastation on the harvests is a matter of record. We know that there are more coming, and, from past history the damage will be great.

That record suggests that there will soon be another serious eruption that, on past performance, will also eject large quantities of sulfur dioxide gases into the atmosphere and induce another period of cooling.

Since the previous evidence has shown that this cooling has not been good for the global health, perhaps it might be about time that folks started working on what can be done to stop, or collect these large volumes of gases before they become too predatory. Certainly the problem of neutralizing the gas or otherwise collecting it or storing it is significant (but then so is that for carbon dioxide). However we know where it is going to come from, and some of the mechanics of how it will migrate upwards. There are large unknowns in terms of how we might capture, control, or neutralize a lot of the acid-forming gasses, but the size of the problem has never stopped us before.

And if the problem were to be addressed by the nations of the world, perhaps we could, in time, assuage some of the known negative effects from the global cooling that we can now expect as the Icelandic eruption continues. This cooling may well already be more certain than near term global warming, and more immediately likely to occur, so under the same Precautionary Principles that are driving the huge investments in climate change already, ought we not be spending our time right now trying to find ways to stop the impact of these massive eruptions on the health of the globe.

Silly thought – but one that suggests that the problems don’t always only have one side, and that we might find out by visual observation the down-sides of too much cooling and its effect on people and agriculture, perhaps sooner than we would like.

Read more!

Tuesday, March 24, 2009

P55. Pick Points

Given the size of a couple of the stories a little less than half-a-dozen stories of interest today:

Redoubt, the volcano in Alaska that was being monitored when I flew over here has now erupted, and though it threw a plume of ash some 60,000 ft into the air, the wind was such that Anchorage, 110 miles away, was not covered. And the heavy snow falls turned into enough water that much of the ash that landed was washed away to a distance of up to 22 miles. By 4:30 am Monday there had been five eruptions, back in 1989 when it last erupted the eruptions lasted for four months. It has since erupted again, and appears now to be building a lava dome.

Source Alaska Volcano Observatory/U.S. Geological Survey


More recently the air had cleared enough to allow planes to be unwrapped and to take off again and resume service.

Source Alaska Volcano Observatory/U.S. Geological Survey

It has been postulated, by Lamb among others, that the fine dust high in the atmosphere can cause a reduction in the Earth temperature, though the effect of one volcano really depends on the size and volume of the ash generated and I suspect this is not producing enough yet to be significant.

Last year, shortly after he was inaugurated President Medvedev travelled to Kazakhstan, Turkmenistan and Uzbekistan with the President of Gazprom to lock up control of the natural gas supplies for those countries. Now the agreement may turn out to be an expensive one for Gazprom. The company has seen its own production drop 25% and so relies on the agreement, but that was at a $409/tcm, and now the price is falling to $260 per tcm.
Gazprom currently buys about 50 billion cubic meters (bcm) of Turkmen gas, 15 bcm of Kazakh gas, and 7 bcm of Uzbek gas, amounting to about 14 percent of the company’s total production in 2008, according to the Nezavisimaya Gazeta report. Rising transit costs and falling consumer demand in Europe and Russia mean that the company’s operating costs in Central Asia are becoming a big burden. The company has already scaled back development plans for the region.

Gazprom officially acknowledged in early March that gas production in 2009 may decrease by 7 percent this year. But analysts say the cut in output could likely to be much higher.
Poland meanwhile, which had an agreement with the “middleman” between Gazprom and the Ukraine (RosUkrEnergo), an entity which has supposedly been kicked out of the deal, is now negotiating directly with Gazprom. The hope is to get the agreement in place so that the Poles can fill their storage tanks before winter comes, when supply becomes more of an issue. Meanwhile Ukraine is reducing the amount of gas that it plans on buying from Gazprom by 17.5%.. However part of this is that Ukraine needs someone to invest in their infrastructure and update it, and the hope is that this will come from Europe which is not sitting too well with the Russians.

And speaking of natural gas, CERA has announced a new analysis which sensibly says:
North American natural gas is entering a new era in which supply is no longer constrained, according to a new Cambridge Energy Research Associates (CERA: undefined, undefined, undefined%) multiclient study, Rising to the Challenge: A Study of North American Gas Supply to 2018. A revolution in technology has unlocked "unconventional" gas resources, dramatically changing the prospects for the market. Demand, rather than supply, will be the challenge for the market going forward, accentuated currently by the economic crisis.
Not wishing to be argumentative, but one wonders if CERA has been monitoring the rates at which drilling rigs are being shut down?

I would normally not take up this much space in a Pick Points, but the report goes on to say
Given the increased productivity of unconventional wells, the study concludes that it is not necessary to increase drilling activity to maintain - or increase - production. After years of developing unconventional gas with its long-lived production, in the aggregate, the average decline rate will fall. This means, the study says, that a smaller quantity of new production is required to offset natural production declines. CERA does expect production to increase, with dry gas productive capacity growing from an average of 53.5 Bcf/d in 2009 to 60.6 Bcf/d in 2018 in the lower 48 United States, and from 15.8 Bcf/d in 2009 to 19.6 Bcf/d in 2018 in Canada.
Sometimes I wonder what reports they are reading, the average life of an unconventional (read gas shale) well is less than 3 years. The average well is depleting 60% in the first year. I have posted on this before and these are not my numbers. Well, as they say, the next eighteen months will see which of us is correct. And LNG imports may change the picture a little, Wood Mackenzie are expecting them to rise. On the other hand the steps by the Indiana Governor to allow synthetic natural gas from coal won’t likely make much of a difference.


Read more!