Friday, September 14, 2012

Waterjetting 1b - Force, Pressure and Flow volume.

This is the second in a series on some of the ways in which high pressure water jets can be used. The series was introduced last week.

Back in September of 2012 archaeologists found the remains of the last king of England to die in battle. He was Richard III, to whom Shakespeare gave the line “a horse, a horse, my kingdom for a horse!” He died because a blow to his head was focused down to a very high local pressure, even though the overall force of the blow might not have been that great.


Figure 1. Gothic Armor of the type worn by Richard III. (Detroit Institute of Arts)

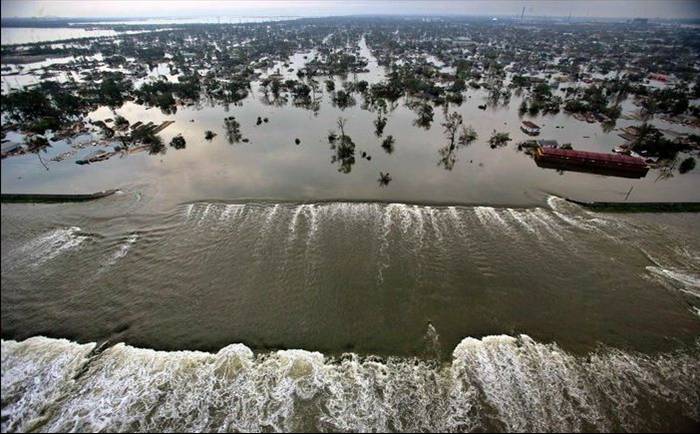
On the other hand, in the middle of Hurricane Katrina, seven years ago, a barge broke through the levee wall above the Lower 9th Ward in New Orleans, LA (NOLA) and released a wall of water that swept through the district. The pressure of the water was quite low, but the overall force it exerted demolished the buildings in its path, and swept them off their foundations for eighteen blocks back from the levee. In this case force, not pressure, was the cause of the damage.


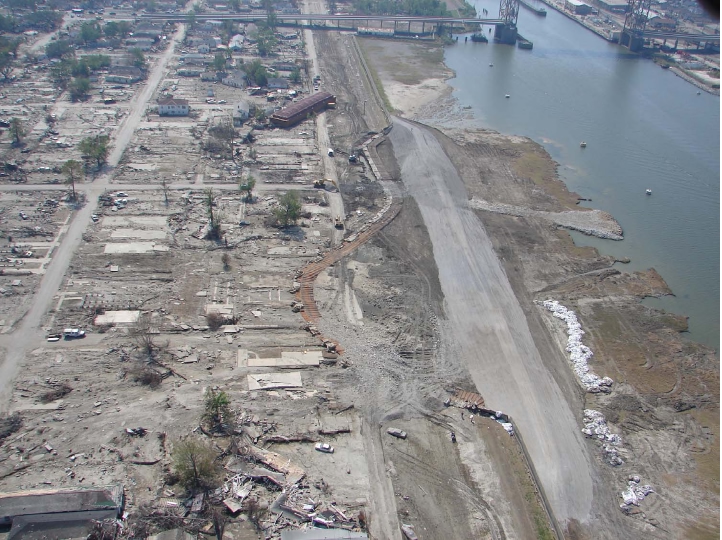
Figure 2. The Lower 9th Ward in New Orleans after Katrina, as the water falls, it flows back into the Industrial Canal. The barge that broke through the levee is on the right. Most of the debris lined the second row of trees back from the levee. (Tulane)

It is this initial relationship between force and pressure, and the role that each has to play in the use of waterjets to remove material that form the topic not only for today, but in a number of the posts that will follow. Waterjetting applications now cover a wide spectrum of different uses, and finding the best choice of pressure and flow (which combine to give power) will change from job to job, and hopefully these posts will help make the choice easier.

It is raining outside. As the water drops hit the soil, the water soaks into the soil by penetrating along the existing cracks that exist between the grains of the soil. After a short time the water fills this space, and as it continues to rain, the impact of new rain drops hit the thin wedges of water that now run down into the soil. Although at much lower forces the action is the same as when you hit a wedge driven into a log with a hammer. The wedge pushes the two walls on either side apart, and a crack grows. One of the key elements that give waterjet cutting its advantage is this transformation from an impact force into a pressure, and most particularly a pressure which is applied against all the surfaces with which the water is in contact. It is a point that will be repeated many times.


Figure 3. The stages of soil erosion – the white arrows in (b) and (c) show the small pressures that are exerted on the particles as additional raindrops keep falling on the water in the ground. This lifts the top two particles in (c) so that the flow of water will carry them away.

With the soil there is not that much material holding the grains together, and so as the rain continues, the soil grains begin to separate from those on either side. Water gets underneath the grains and starts to lift the individual grains free from the mass. Since most land is not flat, the water will now start to flow away under the continued rain, and as it does it carries some of the soil particles that have been freed. This is a simple explanation for the erosion that happens in fields, dirt roads, and other exposed surfaces as they weather. As materials get stronger this process can take much longer to be seen. A high quality stone will erode at the rate of perhaps an inch every thousand years, depending on local weather patterns. There are buildings and bridges built by the Romans all over Europe to prove that point. A weaker granite (and one thinks of the granite in the walls of the Basilica in St Louis as an example) may severely erode within a hundred.

Which brings up an important point: the performance of a waterjet stream is not just controlled by what happens upstream of the nozzle in the delivery system, but it is also affected by the material that it is hitting. And I’ll come back to that in future posts.

First, however, consider what happened during Hurricane Katrina in the Lower 9th Ward. When the barge broke through the levee wall and was carried into the district, it rode on a wall of water that was initially no more than about 30 ft high. We can make a very crude estimate of the pressure of the initial wall of water (neglecting any impact due to the speed at which it moved) based on the height of that wave. A cubic foot of water weighs 62.4 lbs. It sits on an area of 12 x 12 = 144 square inches, so that the pressure under that water is 62.4/144 = 0.43 pounds per square inch (psi). Since that is somewhat close to half-a-psi, as a very simple way of getting the pressure at the bottom of a column of water one can just divide the height in two, and call it psi instead of feet.

So, in the case of that wall of water the pressure at the bottom of the wall would be 30/2 – 15 psi. Since the pressure increases with depth, the average pressure over the height will be half of that, or 7.5 psi. That pressure, by itself, does not appear that powerful.

But when the wave hits a building that pressure is applied over the entire wall. So if the building is 40 ft long and 10 ft high, then the area that sees that pressure is 40 x 12 x 10 x 12 = 57,600 square inches. If that small (7.5 psi) pressure is applied over the whole area, then the force = pressure x area = 7.5 x 57,600 psi = 432,000 lb.

You can now perhaps understand why, when the wave hit the first rows of houses in NOLA that they almost immediately disintegrated, and were carried back as broken debris for about ten blocks.


Figure 4. Aerial view of the Lower 9th Ward after the water had drained, and the levee had been replaced. For a sense of scale there is a school bus sitting partially under the barge, and that is the yellow dot at the end of the upper arrow. Each of the flat slabs to the left of the levee marks where a house stood. When we visited the site the house slabs were as shown, but there was still water – and some live fish, standing in the district. (Tulane )

This was a terrible disaster, but there are occasions, particularly in mining, where this terrible force, combining low pressure but high volume flow rates, can be harnessed to do useful work. Such flows are something that our ancestors have known for millennia, and were used as a way of mining from before the age of pumps, and l will tell how they did it in some later articles.

But in most cases we don’t have that amount of water, and the job is more often one where we want to precisely cut a hole, perhaps, in one of the walls of a building, rather than destroying the building. And we haven’t the patience to wait a hundred years to cut through a block of stone. So how do we speed it up? And so we come back to the death of King Richard.

Back in the day a foot soldier could make a bit of money in a battle by knocking a knight off his horse, and then holding him for ransom. The weapon that they used for this was generally known as a poleaxe. These come in various shapes, but one general idea was to have a hammer on one side of the long pole. Thus, by swinging the pole one could hit a knight with a force of say 50 – lbs. and this could knock him off his horse, allowing him – in the best of such worlds – to be captured alive and then ransomed.


Figure 5. Modern Reproduction of a poleax from about the time of the Wars of the Roses (Wallace Collection)

However that hammer head could measure about a square inch or two, and neither the force nor the pressure would have been enough to penetrate armor or a helmet of the type King Richard wore (Figure 1). To give the footman that advantage the design was changed to include a small spike in the center of the hammer.


Figure 6. Spiked Poleaxe from about 1582, (Royal Armories, Leeds) via My Armory.com)

Now when the force of 50-lb is applied through the hammer to the target it is not distributed over a square inch (giving a pressure of 50-psi). Instead it is focused down on a point that is less than a twentieth of an inch across. Total area of the circular point comes from pi x radius squared = 3.14 x 0.025 x 0.025 = 0.002 sq inches. Pressure applied through the spike to the helmet = 50/0.002 = 25,000 psi. That is enough for the spike to pierce through the metal helmet and the bone underneath, killing Richard III. Battle over, England had a new king, Henry VII, and the War of the Roses was over.

The intent of the two examples is to show how, in some circumstances, high volume flow rates at low pressure can do the most damage, and in others that much higher pressure applied over a much smaller area is the most effective. They are extreme examples but seek to illustrate the point, and in many cases neither extreme (highest pressure, lowest flow or lowest pressure, highest flow) will give the best answer. There are cutting conditions where operational concerns and benefits would argue that pressures of 90,000 psi, and flow rates around 1 gpm will be the best business choice. In other cases a flow of a thousand gpm, but at a pressure of 1,000 psi will be the most economic and viable way to remove soil, and weaker rocks like coal. This series is aimed, in part, at giving you the knowledge that will help you decide where, within that range, to make that balance, between flow and pressure.

(For those reading this series who are not that familiar with blogging conventions, the words that are highlighted in blue are links. So that if you want to read more about that specific topic, clicking on the highlighted words will take you to a web page that gives more information).

UPDATE: 1. This post was updated in 2013, after the body had been positively identified as that of the late King. The validation included a check on the DNA of the remains, which was compared with that of descendants of the family line.
UPDATE: 2. This post was slightly modified on April 19, 2013 to clarify some points that were not explained as well as I thought they were.

Read more!

Thursday, September 13, 2012

OGPSS - China's coal industry

In this run-up to the election, the American Energy future seems to have faded into the quiet background. Gone are the concerns of past years, as both parties seem to have bought into the idea that the nation is well on track toward a much reduced need to import oil. Wood Mackenzie are forecasting that tight oil production will rise from 1.5 mbd this year to 4.1 mbd in 2020, with the Bakken producing 1.3 mbd, the Eagle Ford 1.3 mbd, the Permian plays (Bone Spring, Avalon, Wolfcamp and Cline) will produce 440 kbd, and the Niobrara should be good for 90 kbd. With the decline in production from the impact of Isaac in the Gulf not yet over, it is not yet clear whether the plateau in US production that was starting to form will continue, or whether the gains in production that these projections require will continue. But there are some signs that these projections are, shall we say, a little ambitious. Well costs are now running in the $9 - $11.2 million range and, to sustain production, in these formations where wells have a high annual decline rate, increasing numbers must be drilled each year to offset that decline, and the poorer quality of newer wells. But declining rig counts and other concerns are for the future, and if no one coughs too loudly we can pretend that everything remains fine until we get past November.

China does not have that luxury, since the country, having set its people on an upwardly mobile quality of life path, must continue to provide the power that such a ladder requires. As I noted last time, the potential gains from the increased use of natural gas have been noted. Actions have already been taken to make sure that future supplies will meet anticipated needs and work has begun to tap the gas shales of the country.

But despite those efforts the underlying strength of the Chinese power industry comes from coal.
In 2007 Chinese coal production contained more energy than total Middle Eastern oil production. The rapid growth of coal demand after 2001 created supply strains and bottlenecks that raise questions about sustainability.
In 2010 China produced almost half of the world’s coal tonnage.


Figure 1. A decade of coal production growth (EIA )

China produced some 4.52 billion tonnes in 2011 and some 45% of that was shipped from the mine to the customer by rail. As demand continues to grow those volumes will also increase.


Figure 2. The changing picture of Chinese coal demand and production. (Energy Export Databrowser)

Rail takes a much longer time to install than does a pipeline, and thus Chinese recognition of this need is timely. Between now and 2015 Government plans call for an increase in transportation capacity to 3 billion tons/year almost doubling current capacity, as production of coal is anticipated to decline slightly to around 4 billion tonnes domestically, which may only exist as a target value. Nevertheless to move the coal to the power stations where it is needed, not only trunk lines, but also a large number of shorter branches will have to be created. This will be particularly true if the market shakes out and many of the smaller companies, which are apparently currently seeing some cash flow problems may fade out of business.


Figure 3. Planned expansion of the Chinese Rail network (China Coal Resource )

The Chinese have always been willing to find creative ways of improving their mining technology. I remember back some 45-years ago, when the European coal industry was still strong though waning, and the Chinese arrived seeking to purchase up-to-date mining equipment. Given that coal demand and thus equipment demand was in decline, manufacturers were willing to meet the conditions of the sale. These included that engineers and technicians be at the manufacturing plant during the entire time that the equipment was being built, and that they fully how understand the process. (The argument was so that they would be able to maintain it, after arrival). Well needless to say after those initial deliveries, further orders were rare, and Chinese versions of the equipment appeared, and many of those European manufacturers are no longer around.

New developments of technology in the West are much harder to come by these days. Research and innovation in coal mining in particular has fallen on hard times in both Europe and the United States (to the point of almost disappearance) and thus as China moves toward automation of its mining, particularly in thin seam conditions they are less able to draw on external sources, and must develop more of their own.

Life is a little different in other ways also, and Western companies can now get into the country and collaborate on development. Peabody, for example, is now developing coal mines in China. It has also been working with the government of Mongolia and will help develop mines in the Tavan Tolgoi region. This may be the only growth region for the company at a time when the current Administration in the United States, not to mention those in Europe, seem bent on closing the industry down as fast as they practically can. Given the amount of power that will be required to sustain current qualities of life, and the disappointing, and expensive costs of recent alternatives, the question as to how long this long-term unrealistic view will prevail is a matter of conjecture. China seems to retain a more realistic view of what is going to be needed, and planning accordingly.

There have been some thoughts given to the possibility of sequestration of all the carbon dioxide that will be generated from the various power plants that use this coal. However the power plants are not necessarily close to places where it might be easy to sequester the gas.


Figure 5. Location of the major Chinese coal-fired power plants (The American)


Figure 6. An integrated map showing the power plants (CO2 sources) and the fuel regions together with the location of deep saline formations into which CO2 could be injected (NYT )

The Oil Drum has been fortunate over the years to have had a number of high quality posts on the development of the coal industry in China. These include a review by Dr. Minqi Li, hosted by JoulesBurn. In this review of Peak Coal and China, Dr Li noted that Chinese coal production is projected to peak in 2027, at a level of 5.1 billion tonnes. He estimates a total ultimate recovery of around 257 billion tons. Euan Mearns wrote about Chinese Coal when their consumption first approached 50% of global demand, and followed that with a second piece on the role of imports.

In addition Rembrandt has recently taken note of the developing Chinese coal to chemicals industry. As conventional oil becomes less available as a feed stock, so the growth of this effort will likely justify the development.

Although China has, in the short term (perhaps the next ten to fifteen years) enough coal to sustain internal growth in demand, it is nevertheless also moving pro-actively to ensure that it will have adequate supplies in the out years. Much has been made in the past of their activities in Australia, but, as I have noted, several times in the past the Chinese are becoming well established in Botswana, inter alia, in a country with almost no coal industry yet, but up to 200 billion tons of what are not even counted as reserves yet, because of lack of demand. This may be a lesson for the rest of us.

Read more!

From Cro-Magnon man to Celt

There are now a couple of different themes running through this short series of posts on DNA and what it means in the search for our ancestors. I had started out wondering when Europeans first arrived in America, and found that there appear to be more possible answers to that question than I had first thought. I must also confess that I had not realized until last week the scale of the warfare that was a common feature of life in the Paleo-Indian times. (Though I should not have been surprised, since it was still common at the time that the Pilgrims showed up, as the story of the Quawpaw peoples – who now live around Baxter Springs, Kansas – can attest). But while this is going to remain the main theme of the thread, the changes in the analysis of DNA over the last few years has brought some other surprises with it. This means that it is becoming possible to be more refined in tracking ancestral paths that was the case even five years ago.

To illustrate what I mean, let me expand a little using some of my own results to help explain the development, and then this might help in understanding some of the debate when I come back to the main theme later.

There are now three different places that scientists can look at a DNA sample. There is the basic Y-chromosome (Y-DNA), which provides the paternal line, but which is not passed down through women. Then there is the mitochondrial DNA (mtDNA), which comes down from the female line alone, and which goes to all children. With refinement it is now possible to look at the entirety of the DNA string and what is known as the autosomal DNA (auDNA), using new techniques to specifically focus on different regions, and, from historical records, to start to build a broader family history. Those investigations are beginning to show that there may be many medical benefits, coming from a better understanding of how the body works, and how DNA acts as the control.

I am going to cover those latter topics in posts that follow this, but for today I am going to return to the Y-DNA and the paternal, or patriarchal line. This is not meant as a personal history, but some background might help with context for the example. I am a Summers, of whom it estimated that there are some 15,564 individuals in the UK.


Figure 1. Distribution of the Summers families in the United Kingdom (Dynastree

Our group comes from the area around the village of Eglingham, in Northumberland where the First Duke of Northumberland (Hugh Smithson, who took the family name of Percy) founded a coal mine at Tarry, about 1750, with 9 workers, including a Grey, an Embleton and my relative George.

The region had, historically, been a mess, since it was the ground over which the Scots and English fought for hundreds of years until 1603 when James VI of Scotland became James I of England, following the death of Elizabeth. Bands of my Scottish ancestors (Littles, Maxwells, Moffats etc) came through the hills to steal the cattle and everything else from anyone they could find. Of course the Percys then led bands back, to burn, loot and destroy in return. Both sides of the current family lived through the time of the Border Reivers, and were likely participants albeit on opposite sides.

The current number of Summers is a little overwhelming, but looking at the lower density in the County, and that as one goes back in time, so the numbers of individuals drops considerably, and can focus back down to just one or two individuals. Bryan Sykes did a remarkable study which showed that the Celtic hero Somerled, who died in 1164, has had 500,000 descendants since (including the clans McDonald, McDougall, and McAlister). The lineage can be found here.

So how can this be proved, how can the different branches of the clan be distinguished, and how can I apply that to my own case?

Well the answer lies in the structure of the Y-DNA. Within the Y chromosome are a number of regions where a particular sequence repeats a number of times. For example (to quote Smolenyak) the four base pattern GATA might be repeated five times: GATA GATA GATA GATA GATA. But sometimes when this occurs the exact number of repetitions changes. This is particularly prone to happen when the number of repetitions gets to be more than ten where, as an example, one might find that the ten-sequence suddenly, in the next generation, becomes an eleven-count, or perhaps drops to a nine count. A generational marker thus exists, and it appears to be one where these changes can occur about every 10 to 20 generations. (Say 2-300 years). These “stutters” are known as Short Tandem Repeats (STRs) and they have become the definitive way of identifying much smaller groups of people, within the broader classification of a haplogroup.

Because the numbers can change at different marker sites at random intervals, it is only when comparing across a number of different sites that one can establish who might be related to who. Consider the results from a group of individuals, looking at the number of repeats which are counted at different markers along the chromosome. (The marker site locations are standardized and given at the top of the table).


Figure 2. Short Tandem Repeat counts for 12 individuals that all share the same basic haplogroup designation (R1b1a2) but with varying count numbers at different marker sites. The different shades show variations from the numbers of the defined count for this particular lineage, given as the bolder numbers on the top line.

To return to the McDonald lineage, as time passed the number of repetitions at different locations changed in an individual, and his children, so that different patterns (as in the above) developed. However they did not necessarily follow the divisions of the clan, though once separate any changes in the counts would be restricted to the line in which they occurred.


Figure 3. Variations in the Y-DNA counts as the branches of the Somerled lineage have developed over the centuries. (The values are the sites and the count changes at different marker locations). (Clan Donald)

For the nerds among us it is interesting that the Clan study shows
The calculated haplotype of Good John is the same as participant &PGTBN to 37 markers. We have descendants of three of John's sons. Nine of these have excellent paper trail pedigrees. As shown above on the two charts, there are 22 single-step mutations in 37 markers in 139 transmission events. This is a mutation rate of 0.0043±.0009 (one standard deviation) per marker per birth. The value calculated by the Webmaster from all available data, both academic papers and surname studies, is 0.0031, only slightly more than one standard deviation off from our Clan Donald value.
Note that the rate is calculated by dividing the number of mutations by the number of births and by the number of sites monitored. If one were looking only at the rate at which a single mutation would occur, then this would be 22/139 = 0.16 mutations per birth, or one mutation every roughly 7 generations. With an average generation being around 30 years, this gives a dividing mutation every roughly 200 years per line.


Figure 4. Division of the Clan Donald into various Septs into the 16th Century (Clan Donald). The divisions have multiplied since.

So, by establishing the basic marker counts for a group (i.e. the Haplogroup) one can then, as with the clan lineage above, establish, over time, the branching of that tree, and, for those on one of the branches, this also provide a path back to the original ancestors. There are several ways in which the different groups can be designated.

Oxford Ancestors (OA) has built on the classification system initially created by Bryan Sykes in Saxons, Vikings and Celts, which divides the results from Y-DNA STR counts at 12 sites (those in the table above) into five different major groups. This seems to now be quite widely accepted as a primary classification system, although the names of the five groups can vary from site to site. I found the Border Reiver Ancestry site useful, since it looks at several ways of assessing my particular ancestors.

The most common is the R1b group (that with the baseline values of table 2) and this Sykes called Oisin. It is now being called Celtic and can make up some 67.5% of the DNA profiles from the Border Reiver region, although Sykes found that it designated 62.8% of the samples he took in Northumberland. (The group includes me). Using the ordering of the STR count marker sites as shown in Figure 2 the values would be:

13;24;14;11;11;14;12;12;12;13;13;29

The second is Group I, called Wodan by Sykes, and now being also referred to as Anglo Saxon/Danish. The STR counts for this Haplogroup, some 20.7% in the Border Reiver sample, 15.9% in Sykes’ Northumberland, would be:

13;23;14;10;14;14;11;14;12;12;11;28

The Haplogroup R1a is the Norse Viking, which Sykes called Sigurd. Interestingly this is also the group into which Somerled falls. The STR counts for the basic member of this Haplogroup, which makes up 3.7% of Border stock but 7.3% of Sykes Northumberland, possibly because of a close Scandinavian tie to that county even today, would be:

13:24;16;10;11;14;12;12;10;14;12;32

The fourth grouping is the E1b1b group, which Sykes called Eshu. This is some 1.6% of the Sykes sample but was not recorded in the Border Reiver analysis. The counts are:

13;22;14;10;16;17;11;12;12;13;11;30

And the fifth group, defined by the letter J, which Sykes referred to as Re, and which is also referred to as Ancient Roman. It makes up 3.1% of the Border Reiver sample, and 2.4% of those sampled by Dr Sykes in Northumberland. The counts are:

12:22;14;10;12;14;11;15;12;12;11;29

Even within a single surname, and haplogroup there are individual marker count changes that have built up over the centuries that surnames have been around (roughly a thousand years). It turns out that there are Summers whose DNA falls into all five of the groups. But knowing that I am a Celt, although the Summers are reputed to be either Anglo Saxon or perhaps Norman French does perhaps explain my predilection for bagpipe music, including Spanish and Portuguese.

The story will continue . . . .

Read more!

Sunday, September 9, 2012

A New Series - Waterjetting 1a

In October of 1965 I started work on a doctoral dissertation that would look at whether streams of high-pressure water could be used to mine minerals, rather than using the mechanical tools that my ancestors had been using for many generations to mine coal. Until the time of my great-grandfather the main tool had been a hand-swung pick, but he had made the transition to become a compressed-air-powered, coal-cutter operator, and worked with my grandfather on running that machine until the first World War, when his son joined the Northumberland Fusiliers and went off to Belgium.

When I started my work, after my mining engineer father had approved, I found that there was little information on hydraulic mining available in the technical literature. The Internet did not exist, and the few books and articles that I could obtain came through the Brotherton Library at Leeds University, where Inter-Library Loans would find a source, and even, on occasion, a translation, but in weeks not days.

Those conditions no longer hold true, and yet, while a computer now makes it easier to get instant access to all the world’s knowledge, filtering through that vast stack to find that needed bit of information still takes time. And there are other factors that have come into play, so that much of the knowledge that has been gained may soon be lost, forgotten or spread into so many distant places as to be effectively gone. And so I am going to put together a new series of posts about this technology. Since this is the first it is more of an explanation of the background, and as the posts continue so the structure and location may change, trying to better serve those who follow me in what has been the truly fascinating development of a new very broad-based industry.

Over the past decades high-pressure waterjets have found a wide variety of different uses around the world. From the small pumps that can be bought at the local hardware store and allow you to clean houses, furniture and cars through the thousands of horsepower used in pumps for the excavation and mining/petroleum industry a quiet revolution has occurred in many industries, beyond the sight of the general public. I was fortunate enough to be a part of the relatively small group of scientists/engineers/technicians who helped bring these changes about. Around the world there were perhaps 50 or so of us, and much of our interaction took place at conferences, where we learned more from each other in bars and restaurants than we did from the formal papers that we all gave. Some changes were fairly dramatic, the use of cleaning jets on oil platforms comes to mind, and were instantly adopted, others were a longer struggle, and yet these tools have yet to find more than 90% of their ultimate market, which will likely be in fields that most of us have not even thought of yet. And the tools that have already been developed are used in many more industries than the general public understands.

I retired a couple of years ago, and followed many of that original group in moving on to other interests. Before I left, however, I had written a book, and taught a class to senior undergraduates dealing with manufacturing use, as well as the earlier mining applications. The class is not taught now, and interest in the topic has also shrunk at the other major universities, as faculty have changed, and other topics bring the “research rain” that is needed to sustain the graduate classes of today.

This does not mean that waterjetting is less valuable, but instead is recognizes that the first flush of development is over, and that the really low-hanging fruit of application has been picked by folks such as myself. The range of applications remains immense, but the rewards are not now as easily obvious, and the research results now are not so dramatic.

The current plan is to begin the series with posts that come from my lecture set. But instead of being of the usual length they will be broken down into a set of sub-topics, so that there may be three or four posts that will cover the material of a single class. This will make each post of around a thousand words, and then the four sub-topics will be combined into a “class” version which will be posted as a pdf, and this will be down-loadable, and could be printed and put into what will, over time, become a somewhat updated version of that earlier book, but in a different format.

Since none of the anticipated readership is yet aware that this is happening, I expect that it will take some time for comments and questions to develop, but as these do they will be added into the mix.

Once the original posts have become established I hope to be joined by some of the folk that are still working in the field – as I said earlier it is one that is still continuing to grow at a fairly steady pace (one of the companies that makes equipment was on the national news recently because it could not get enough trained folk to help it meet demand). New ideas will turn up, and I look forward to giving my opinions. Sadly these may appear a bit negative at first, but there were many things we tried that looked good, but did not pan out. And those were usually not, therefore, the things that we wrote papers about. But knowing something won’t work, and more particularly why not, is also useful.

The early posts will also deal more with the history and general background, since these are likely to have a more general interest, and the more technical parts of the discussion will come later, though I will try and keep that at a relatively simple level for explanation.

I got my last patent this week, it dealt with drilling oilwells – the one before that dealt with treating skin cancer. I have worked on intercontinental ballistic missiles, at nuclear facilities, on land-mine clearance and in blocked caves. So perhaps I could claim to be a surgeon, rocket scientist, nuclear scientist, fire-fighting expert, and hazardous material specialist – and that neglects all the work on manufacturing and the evolution of tools that can cut through an inch of material within an accuracy of a thousandth of in inch.

All because of the power that comes when you push a pint of water through a tiny hole. Who’d a thunkit!!

Read more!

Saturday, September 8, 2012

On coracles, Partridge, the Mandan and the Inuit

A Passamaquoddy Legend:
In ancient days Partridge was the canoe-builder for the other birds. And after he had finished all the canoes, he called the birds together and each got into its bark and paddled off.

Oh, it was a great sight! First of all came the Eagle, in his big shell, paddling with the ends of his wings. Then came the Owl dipping his wings in the water, like the Eagle. Then the Crane, the Bluebird, the Robin, the Blackbird and the Snipe went sailing proudly after, uttering shrill cries or whistling and singing. And last of all came the tiny Hummingbird in a very tiny canoe; and for him good Partridge had made a prettily little paddle.

And the Fish-Hawk, who lives on the wing, skimmed over their heads, crying with amazement, as he saw the proud little fleet of canoes put out to sea.

“Why, O Partridge,” cried the Fish-Hawk, “have you no canoe for yourself?” But Partridge gave no answer, only looked mysterious and drummed; and the noise of his drumming sounded like an Indian at work on a canoe.

Then the birds sailed back to land, and all cried out, “Why, O Partridge, have you made no canoe for yourself?”

But Partridge shook his head, and said that when he built a canoe for himself, it should be a wonder such as no bird’s eye had ever beheld. This went on for some time until at last every bird knew that Partridge was making a wonderful boat for himself.

Now Partridge thought, “If a boat with two ends sails two ways, when then a boat, that is round, will sail every way.” So he built a canoe like a nest, perfectly round. And when it was finished, he called together all the birds to watch him put out to sea. And as they looked at the round canoe, they all cried out: “What a wonderful boat! We were not wise enough to think of such a thing!”

The Partridge, swelling with pride, stepped into the canoe, and dipped his paddle, But the boat made no headway at all, only spun around and around. And the harder he worked, dipping his paddle, first on one side and then on the other, the faster spun the canoe.

And when the birds saw what was happening, they fell to laughing, and mocking Partridge. And he left his round canoe, and, flying inland, hid himself for very shame under the low bushes.

And to this day he flies close to the ground, and hides under leaves and bushes. And the noise of his drumming sounds far and near like an Indian making a canoe.
Partidge had not been to Wales, nor to India, among other places where coracles are common.


Figure 1. Welsh coracle (Data Wales )


Figure 2. Indian coracle (Wikipedia )

It was in part the presence of the coracle that suggested to Meriwether Lewis as he and William Clark met the Mandan Indian tribe in what is now Washburn North Dakota that the tribe might have been descended from Prince Madoc ap Owain Gwynedd of Wales who lived around 800 years ago. (And would have travelled to America in roughly the same time frame as those reported to have left the Viking boats in Minnesota). It is, unfortunately, not something that can easily be checked with DNA testing, although, as an aside, it is now possible to get paternity testing in the Mandan region of the country. The last full-blooded Mandan, Mattie Grinnell, is reported to have died in 1971. Even by the time of the Lewis and Clark visit the tribe had been reduced from perhaps 15,000 individuals living in 9 villages, down to just two villages of around 1,200 people.


Figure 3. Mandan village – Bull Dance – George Carlin 1832 (American Art )

The village and tribe that Lewis and Clark met were largely wiped out in a smallpox outbreak in 1837. After the epidemic there were only around 100 survivors.

One of the difficulties in getting a true picture of the history of the Native American population prior to the large-scale migrations of Europeans across the continent, is that so many in those tribes died, due to the diseases that also arrived at that time. For example, by the time that the Pilgrims landed in Massachusetts it has been suggested that over 90% of the local native tribes had died, due to infection. (h/t Gregory ) Until recently the major cause of death was thought to be due to smallpox and viral hepatitis , a disease to which Native Americans are more susceptible but leptospirosis has also been now indicted, in the three to six year period that saw the majority of the deaths. Rats and mice from the many ships from different nations that were by that time visiting the continent would contaminate the environment in a way that made locals more susceptible, because of their lifestyle, than the booted and western-oriented visitors.

Regardless of cause, the diseases killed a dominant portion of the population, numbers suggested ranging from 75% to the 98% loss of the Mandan. The enforced migrations of the tribes, and the re-development of the land to fit European farming tradition has also lost a considerable part of the archeological record.

Further, when one goes back to around historic periods measured in tens of thousands of years ago, the maintenance of lineage lines and their origin becomes more difficult, and the need for larger sample sizes to draw realistic conclusions is offset by the reality that if the natives of the time lived on the coast-line, that region, around the world is now under considerable depth of water as the great glaciers have melted.

Yet the lack of evidence should not be considered equivalent to there being no evidence, and thence that these events did not take place. The evidence that the X variation in mtDNA migrated west seems conclusive, as Stanford and Bradley (S&B)have shown.


Figure 4. Distribution of the X mtDNA variation in the global population (Stanford and Bradley).

Having myself, in earlier times, studied how an early Stonehenge was made, after helping make one, the intelligence, and the long time over which events had time to occur back in those millennia, sometimes seems to get lost in current discussions over whether certain journeys and developments could have taken place.

S&B’s argument that local inhabitants of Siberia would, to have been able to survive, had to learn to create sealed clothing from animal/marine sources is a logical base on which to assume that boats, ubiquitous in other parts of the world, would have also existed in the far North. The example of the Thule Inuit, who travelled from Alaska to Greenland during the Medieval Warming Period, arriving in time to greet the Vikings and come down to us as the “skraelings” is well documented. The migration is generally thought to have been motivated by following the whale. It is a distance of on the order of 3,000 miles and while, at one time it was thought that this migration might have taken decades, or centuries there is now a school of thought that it might have occurred within a 2-3 year period, due to the use of dog-sleds and umiaks. The alternative reason that is now proposed for the short duration of the transition is also novel:
the Bering Strait Thule experienced a serious iron shortage related to disruptions in East Asian trade routes after the rise of Ghengis Khan in the 13th century. Knowing of sources of iron in the Canadian Arctic, Thule migrants set off on a journey eastwards in search of this precious commodity. The iron they eventually discovered would have been both meteoric (Cape York meteors) and European, because Norse Greenlanders were trading into the Eastern Canadian Arctic in their quest for walrus ivory and other Arctic luxury goods.
The image of a peaceful Inuit is also under challenge:
The emergence of hierarchical village societies, containing over-classes of artists and political leaders, and supported by slaves, is linked to their learning to hunt for the largest mammal in their environment, the bowhead whale. Intense competition for hunting grounds, over-population, and the ability to maintain permanent militias were factors in the emergence of violent conflict. Archaeologists have uncovered fortified Bering Strait villages, and the Thule were known to wear Chinese-style slat armour and use the Mongol recurved bow.
Conflict in the region was not just an event a thousand years ago it has been regionally common, even back to 13,000 BP. No wonder the Vikings had such a hard time in Western Greenland, and chose to leave L’Anse aux Meadows to its resident tribes. (But it might also explain where all those polar bear skins came from, that ended up going to the Vatican from the Greenland diocese.) (THE LOST WESTERN SETTLEMENT OF GREENLAND, 1342, An M.A. Thesis in History, by Carol S. Francis, California State University – Sacramento – Fall 2011).

Well this was more of a digression than I had intended when I started writing this post this morning, but rather it serves to illustrate, through the drastic loss of life when European and American cultures first met, and through the lack of much archaeological evidence until recently, the difficulties in generating a highly detailed history of events over the past 20,000 years.

I plan on writing about the Red Paint People next, and their arrival, and then we might get to the dissertation, cited above, and the discussion topics that it falls into regarding the interactions of Europeans and Native Americans in the MWP.

Read more!

Friday, September 7, 2012

OGPSS - Chinese gas shale development

On occasion, the British Government goes through an internal shake-up that leads to various pundits trying to explain to us lesser mortals what it all means. Thus, with changes in the Ministers who work in the Department of Energy and Climate Change, there is a suggestion that the UK is pulling back from their commitment to wind energy, and instead beginning to look more seriously at shale gas supplies.

The UK is not unique. The success of the American development of long horizontal well drilling, with follow-on multiple fracture of the shale beds to release gas at economic volumes into the well, has caught the world’s attention, and with it a desire to emulate that success. Though it should be said that the American success comes in part with the volume of the release in supply and the consequent fall induced in the price of natural gas. That, in turn, is providing a less well recognized boost to the US economy, through lower energy costs.

This has not been lost on the Chinese, who are fully aware of their own need to keep finding resources at as cheap a price as possible to keep their own economy growing. It is, in relative terms, however, still an industry in its infancy. Earlier this year China agreed to buy 65 billon cu m of more conventionally produced natural gas from Turkmenistan – about twice the initial buy - roughly the equivalent of 6.3 billion cu ft/day (bcf/d). In addition, from April 1, China has started to import natural gas from Uzbekistan. That sale has been projected to be at around 10 bcm/year (1 bcf/day) and there has been a move in Uzbekistan to increase coal-fired power generation in the country in order to free up more gas to meet export demands as the sales to China ramp up to perhaps double this level in the next few years.

Further China still has the option of buying more natural gas from Russia, which has the potential to supply an additional 65 bcm/year into China. (6.3 bcf/d)


Figure 1. Path of the natural gas pipeline from Turkmenistan to China (Hydrocarbons technology )

To put these numbers into perspective China consumed around 12.5 billion cu ft/day (bcf/d) in 2011, which translates into roughly 130 bcm/year, but this rate increased 20% (23 bcm) from 2010 to 2011. (BP 2012 Statistical Review). It is also on track with the stated Government plan that China will consume some 375 bcm/yr (36 bcf/day) of natural gas by 2020, roughly tripling the current volume.


Figure 2. Changes in Chinese use of Natural Gas (Energy Export Data Browser )

Thus, although China has been able to provide for most of its needs until relatively recently, it is now starting to buy increasingly large volumes of natural gas on the international market, just to keep up with demand.

There is a flexibility in the supply of natural gas, through pipelines, that make it easier for a country with much mountainous terrain in the West to be able more easily to supply energy to more remote corners, without the heavy infrastructure demands that would be required, for example, to run new rail lines for coal delivery.


Figure 3. New gas pipeline being laid in China in 2009.

This June Sinopec has started drilling for natural gas in the shales under Chongqing in Sichuan Province. It is the opening step in developing a resource that might be as large as 1,275 Tcf, according to the EIA.


Figure 4. Main Sinopec natural gas trunk lines. (after Sinopec )

Note that while the supplies coming in from Turkmenistan and Ukbekistan are more easily connected to the northern of the trans-country pipelines, the new drilling in Chongqing looking for shale gas, will supply that into the more southerly of the two major pipelines that Sinopec runs across the country.
The Sichuan-Eastern China Natural Gas Transmission Pipeline passes through eight provinces including Sichuan, Chongqing, Jiangxi, Hubei, Anhui, Jiangsu, Zhejiang and Shanghai;the length is 2,246 km.
There will be nine wells in the initial test site, with the anticipation that this will yield some 11 to 18 billion feet of gas (per year). Outside this unconventional source of natural gas, Sinopec produced some 517 bcf of natural gas in 2011, up 76 bcf from 2010. Much of this came from the Sulidge gas field in the Ordos Basin , which is also considered to have the second largest potential natural gas resource in shale in the country.

It is hoped that with the development of the shale gas in the two Basins that shale gas will provide some 6.5 bcm/yr by 2015. As with the Chongqing field, there are existing pipelines at the Ordos field that will allow a fairly simple tie in to the national network to bring the new fuel to market, once produced.


Figure 5. Potential gas shale fields in China (IEA via Washington Post )

The potential of this new market for technology has already led Schlumberger to buy into a Chinese Oilfield Services company that will likely be used in the fracturing of the wells, necessary to China since they still lack expertise in the new technologies as they are evolving.

That evolution was highlighted recently by articles that have highlighted a number of different technologies that are now both lowering the costs, and increasing the performance of well fracking.

These have included the Hiway technology that is now being introduced and which, as with some of the other innovations, allows a significant savings in water, and proppant use during operations, while lowering costs and increasing productivity. These factors, particularly the significant lowering of cost, are likely to help in improving the economics of a shale gas industry which continues, at least in the United States, to have problems with return on investment, despite, or perhaps because of the large volumes of resource that it is making available. That is, however, much less likely to be a problem with the Chinese resource.

Read more!

Monday, September 3, 2012

Paleo-Indians, the Clovis point, Solutrean point and X2 mtDNA

When I began this little study of human history I started because of a curiosity as to when Europeans first came to the Americas. The general consensus is that they came from Siberia through a land bridge, formed as the ice age lowered sea levels some 145 m, and known as Beringia. They moved into Alaska, and thence down into the lower 48. The contrasting and almost unknown alternative, was based on an initial earlier arrival of some European individuals, based on two different forms of evidence. One of these related to the tools that the Paleo-Indians were using at the time that the cooling period known as the Younger Dryas occurred. The second arose because of the considerable strides that have been made in the analysis of individual DNA, and what it tells of the ancestral lineage of an individual.

In order to better understand some of the terminology of the books and articles that I have since read, it seemed that working from an example set of data might make it easier to follow the various discussions. Thus we sent away family samples from a male, me, and from a female, the Nurse, to the Genographic Project for initial analysis. The results of that initial investigation were a little perfunctory, but showed that on both the male and female line that our ancestors were likely in France and Spain at the time of the Younger Dryas, being a part of that colony that is now referred to as Cro-Magnon man, although a more refined term for the folk in that region and period may be Solutrean, of which more anon, and in later posts.

In his books that tie climate change over the centuries and millennia to changes in the human condition Brian Fagan has described some of the conditions in that period between the Last Glacial Maximum and the Younger Dryas when, for a couple of thousand years, the planet warmed and the ice retreated. (See, for example “The Long Summer” and “Cro-Magnon Man.”) The changing climate led to human migration north out into the upper parts of Europe, while the following thousand year cold spell of the Younger Dryas, largely drove the people of the time back south, into colonies that lay below the ice sheet.

Figure 1. Some of the significant events in the time around the arrival of the Younger Dryas (Fagan – The Long Summer).

Fagan points out that at about this time the European settlement was likely only around 50,000 individuals – though there were also tribes of Neanderthal that has previously occupied the terrain. Tribes of the time were still of the hunter-gatherer type, and thus consisted of small family groups, migrating with changing conditions, and (as the example of the San bushmen of Botswana show) having and leaving few possessions to help with our archeological analysis of the period.

On a measure of scale, Jacob Bronowski pointed out (in the “Ascent of Man” that the Sami or Lapp, who migrated north with the reindeer as the ice caps retreated still only number about 30,000, in a land with 3 million reindeer. They were totally dependant on the herd, and ate an average of a pound of meat a day. (The incidence of modern technology is changing their way of life, but in the summer that I spent up there in 1964 the family group I lived near, for a short time, were still small in number, and, being migratory, soon moved on with the herds). A photo from the 1900-1920 period shows a group size of 20-25 individuals.

Figure 2. Sami family group in the 1900-1920 period (Photo: Granbergs Nya Aktiebolag via Environmental Graffiti)

That size seems similar to the numbers in one of the hunter-gather tribes of the Hatzabe in Tanzania.


Figure 3. Members of the Hatzabe tribe travelling (Wells: Deep Ancestry: The Landmark DNA Test.)

More memorably in the video version of Bronowski’s work he shows a Bakhtiari family who migrate a flock of 50 sheep each year, and who, when they reach a river in flood leave an old man who cannot cross behind.

These small groups of hunters 15,000 years ago used stone tools to provide the blades for their hunting weapons, and had learned to shape these to work to give the most effective result. Stone tool shapes are one of the few ways of tracing how technology changed, and the tribes that had made it into what is now the Americans had (as the above table above shows) developed a particular shape for the stone on their spears, which raises one of the two points of this post.

The controversy that arises relates to the shape of some of those spear points. For while the shaped spears started in different forms, after a time it seems that one specific form, known as the Clovis point, became common across much of America and being found in with the animal bones showed that it was used to kill mastodon and other animals of the time.

Clovis spear points (and arrow heads) have a distinctive shape, as the British Museum describes:
Typical Clovis points, like this example, have parallel to slightly convex edges which narrow to a point. This shape is produced by chipping small, parallel flakes off both sides of a stone blade. Following this, the point is thinned on both sides by the removal of flakes which leave a central groove or ‘flute’. These flutes are the principle feature of Clovis or ‘fluted’ points. They originate from the base which then has a concave outline and end about one-third along the length. The grooves produced by the removal of the flutes allow the point to be fitted to a wooden shaft of a spear.

Figure 4. A typical Clovis point (British Museum)

The specific feature of the “fluting”, the two grooves on either side of the point that run along the axis of the point and help retain the split ends of the pole (the haft) into which it is fitted (before being held in place with wrapped sinew or cord) are one of the major characteristics, and can be more easily identified with a sketch. Bryan Sykes has pointed out that the ripples within the flute also hold the tip within the split wooden shaft, without the need to bind it into place with sinews. Dennis Stanford and Bruce Bradley in “Across Atlantic Ice – The Origins of America’s Clovis Culture” (S&B) however tried both fluting and not, and found little difference in their effectiveness in hafting.


Figure 5. Sketch of a Clovis spear point (National Park Service)

The people who used these hunting weapons lived at the end of the Pleistocene Era, up to the point that it transitioned into the Holocene – as the current geological interval is called. The have become known as the Paleo-Indians and their use of the tools seem to have disappeared with the onset of the Younger Dryas.

A recent press release from UCSB gives evidence of a meteor strike which initiated the Younger Dryas cold period some 12,900 years ago.
These new data are the latest to strongly support the controversial Younger Dryas Boundary (YDB) hypothesis, which proposes that a cosmic impact occurred 12,900 years ago at the onset of an unusual cold climatic period called the Younger Dryas. This episode occurred at or close to the time of major extinction of the North American megafauna, including mammoths and giant ground sloths; and the disappearance of the prehistoric and widely distributed Clovis culture.
And this is where the first controversy appears.

The Clovis points were named from the site near Clovis, NM where the shape was first identified, lying near some mammoth bones. David Meltzer’s well written book “ First Peoples in a New World: Colonizing Ice Age America,” has described the growth of additional discoveries that found that this particular shape had become common across the country. However, as more sites with this shape were found, there is some evidence, noted in Meltzer, but described more fully by Stanford and Bradley that the Clovis shape did not begin on the West coast, but that the origin, in this continent, was rather in the East. They also feel that the widespread use of the Clovis point at the beginning of the Younger Dryas means that the continent was more densely occupied than could have been achieved within the short period of time since an arrival through Beringia, without including water travel (of which more next time).


Figure 6. Clovis point distribution (Anderson ) (Note the two ice caps define the ice-free corridor from Beringia in the top left).

At that time it is also conjectured that the population in the Americas (note the extent of the ice sheet still in Figure 6) could have grown to 600,000 people. (Meltzer (quoting Martin). However in the top left-hand of the above picture is the end of the corridor between the ice caps through which the first Native Americans were supposed to have passed to come down into the Central Plains. The problem with this route, however, as the sole passage for the peoples, is that (as Stanford and Bradley point out) several-fold. Firstly because it lies between the two ice sheets there was a slow growth of vegetation, which would slow the migration of animals, and thus people down the valley. The second is that the technology of tool use differs.

In Asia and into Beringia, the people more commonly inserted small microblades of split stone into the sides of wooden holders to make their weapons, rather than using the larger blades on the end of the spear. (This has become known as the Dyuktai Culture). And they apparently used these to hunt polar and other bears. As a result there are no Clovis points as one moves through Beringia. And the evidence also shows that the ice-free passage down into America was not used until around 12,000 years before the present (BP), while as S&B point out, Clovis technology was established in America over 13,000 BP. And thirdly there is a problem of the DNA of the folk in Beringia. (which I will come to later).

The Clovis points, it turns out, are much more similar to the weaponry that was developed in Europe, and which had been excavated first at the town of Salutre in France, where they used them to hunt horses (for food). Although that development predated the use in America the period between is being reduced, with the further discoveries of recent times, although since this was during the Last Glacier Maximum (LGM) the sea was much lower, and settlements were on plains that are now underwater. And so the archaeology is slow to be uncovered.


Figure 7. Solutrean sites in Europe (Note the presence of the land off the current shore line, and the glacier over the UK). (Stanford and Bradley)

The French (and later Spanish) Solutrean tool development pre-dated that in America, and is where the technology of “overshoot” trimming of the stone blades appears to have originated. (This technique splits away shards from the shape by driving a split that runs right across the blade, and is not found in the Siberian technology). (S&B provide a good tutorial on the basics of creating stone tools or “knapping” in their book.)


Figure 8. Comparison of an a) Clovis point and b) a Solutrean point. (Stanford and Bradley)

This finding has led to the proposition that European settlers came to the Americas by sailing along the edge of the ice cap, during or towards the end of the Last Glacial Maximum. (An idea first proposed by Greenman* in 1963). Radiocarbon dating of the various sites has suggested that the “technology” migrated to the West, at the time before the Younger Dryas, a time when the mastadon, mammoth and other large animals were moving to extinction. (Some have suggested that this extinction was also caused because of the change in vegetation due to the climate change).


Figure 9. Possible path from Spain to the Chesapeake Bay, about 15,000 years ago. (Stanford and Bradley)

The presence of a Solutrean laurel leaf blade at a site in Eppes Island, which has been shown to be of French origin is one of the talking points of the year. It would thus appear that there was more than one route into the Americas, and S&B suggest that, given the lack of Clovis points in Beringia and Alaska, it may have been that Clovis-carrying Paleo-Indians were there to meet the travelers down the McKenzie Valley when they finally made it.

That is, however, unlikely, given the nature of the DNA evidence, which confirms, to a large degree the Asian origin of the Western First Nations. But there is an exception to this (which relates to my original enquiry). To quote Spencer Wells: in Deep Ancestry: The Landmark DNA Test.
The real controversy surrounding haplogroup X is its place as one of the five haplogroups found in the indigenous peoples of Americas, where it is found exclusively in North America at varying frequencies. In the Ojibwa from the Great Lakes region it is found at around 25%, in the Sioux at around 15%, the Nuu-Chah-Nulth at more than 10% and in the Navajo at 7%. But the X2 is is almost entirely absent from Siberia, the proposed land route fo the first migrations into the New World.

Unlike the four main Native American haplogroups (A,B, C and D) haplogroup X is entirely absent in East Asian populations., indicating that it played no role in colonizing those regions. However its age estimate in the Americas, around 15,ooo years old, does indicate that members of this group were among the first modern humans there.
In other words the further one moves west in the United States, then the less impact that the X2 group had on providing ancestors.
X2 makes up around 2% of the European mtDNA lineages and is more strongly present in the Near East, Caucusus region, and Mediterranean Europe.
And I will close today with that puzzle and a thought. One of the problems with bringing together the limited evidence from sites that are widely scattered lies in the need to find a way of connecting them. This is potentially where the use of DNA comes in. For example, before the Solutrean technology was in use it had to develop – where did that happen? It turns out that there S&B note a suggestion that this occurred in the western Eurasian plain in the Crimea and along the banks of the Don in what is known as the Streletskaya. From there it may have migrated west, both to France and Spain, but also into southern Britain.(pdf). The migratory paths of my own ancestors show how that evolution might have occurred as our tribe migrated west, passing in the process through all three regions.


Figure 10. Path of our female ancestors through time, showing the different spin-offs of different haplogroups along the way. (The Genographic Project).

I will talk a little about boats, migrations and the next possible European arrival (the Red Paint People) in a subsequent post.

There are increasing numbers of sites that discuss this topic, with various differing views on the controversy.

*Greenman from Bradley (E. F. Greenman, "The Upper Palaeolithic and the New World", Current Anthropology, 4: 41–66 (1963))

Read more!