Showing posts with label BP Energy Outlook. Show all posts

Tuesday, February 11, 2014

Tech Talk - The BP Energy Outlook 2035

BP begins its new forecast for the energy future with the statement:
We project that by 2035 the US will be energy self-sufficient while maintaining its position as the world’s top liquids and natural gas producer.
This illustrates the optimism which BP are projecting in their image of future production. But it carries with it a lot of inherent assumptions, some of which are relatively easy to identify in the summary graphic presentation that accompanied the initial presentation of the new report. Perhaps the most illustrative of their optimism is this plot, which shows the increasingly decoupled changes in energy supply relative to projected increases in GDP.


Figure 1. The reducing dependence on Energy growth as a control on GDP. (All figures are from the new BP Energy Outlook for 2035)

Each year there are significant projections for the future of energy over the next few decades. Recent posts have reviewed this year’s projections from the IEA and ExxonMobil. These projections, were also reviewed last year and those reviews included the previous BP projection although that only projected forward to 2030 – the current review has added five years to this.

The relative contributions of the different fuel sources to the overall mix have not changed appreciably in the past year. Oil is anticipated to continue to shrink in percentage contribution, and coal will also decline in relative contribution after around 2020. Natural gas and renewables are anticipated to make up the supply needed.


Figure 2. Relative contributions of the different fuel sources to overall global energy supply to 2035.

BP have made it a little easier to see how this breaks down by plotting the ten-year increments in fuel contribution as well as the overall totals.


Figure 3. Changes in projected fuel supplies over the period to 2035.

Changing the plot to show the ten-year incremental changes illustrates how coal, now surging as an international fuel source, is anticipated to decline beyond 2020.


Figure 4. Projected ten-year incremental changes in fuel supply through 2035.

Note that in overall total BP is projecting that global consumption will rise by 41% over today’s numbers, most of which increase will come from the rapidly-developing countries of the world.
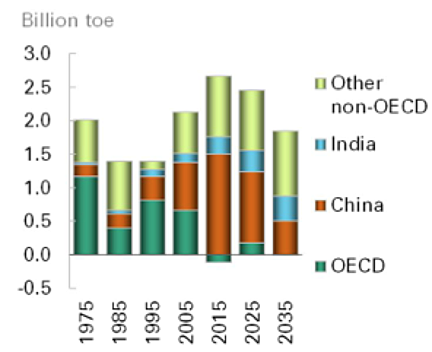

Figure 5. Regional increments of energy consumption growth over the decades to 2035.

The reliance on the improvements in energy efficiency to stall further growth in energy demand from the OECD countries is evident in this picture.

BP notes that the decade from 2002 to 2012 saw the “largest ever growth in energy consumption in volume terms,” but anticipates that this rate will never be exceeded in the decades to come. And they anticipate that as Chinese growth fades in the decades, so the growth of the Indian and adjacent economies will almost match that of China by the end of the period. As the nations of the world complete their industrialization, so the growth in the demand for fuel will see a greater emphasis on transportation demands.

Interestingly the decline in the demand for coal that BO projects is linked to the completion of industrialization in China, and this assumption is, of course, predicated on oil and natural gas remaining available to meet the demand at a reasonable cost.


Figure 6. Anticipated primary sources for generation of electric power.

The projections for changes in liquid fuel supply are also relatively simply presented. First one can see the projected changes in demand, with the OECD countries declining, as demand increase seems to focus in the Eastern nations.


Figure 7. Anticipated changes in global demand for liquid fuels

It is where this growth in supply is to come from that is of the greatest concern, and BP suggest the following:


Figure 8. The anticipated sources for growth in liquid fuel supply through 2035.

BP note the largest sources of these gains as being:
The largest increments of non-OPEC supply will come from the US (3.6 Mb/d), Canada (3.4 Mb/d), and Brazil (2.4 Mb/d), which offset declines in mature provinces such as the North Sea. OPEC supply growth will come primarily from NGLs (3.1 Mb/d) and crude oil in Iraq (2.6 Mb/d).
One of the more interesting plots in the report shows how, over last year, the changes in US production more than compensated for the declines in production from the MENA countries.


Figure 9. The ability of increased US production to balance declines in production from the nations in turmoil in MENA.

BP anticipates that continued US increases in production will more than balance the anticipated increases in global demand, so that the continued disruptions will not significantly affect global supply even though, as they have historically, they extend for more than ten years. The US gains are anticipated to continue to such an extent that OPEC will be required to rein in their supplies in order to sustain global prices.


Figure 10. Changes in the demand for OPEC oil and the result on their production reserve capacity.

One anticipates, given that KSA has said that they will not increase overall supply much above current levels, that the increases in production that BP anticipate will likely come from Iraq, and Iran if the sanctions are lifted. Given the current situation in those parts the latter seems increasingly more likely than the former. Further BP note that the increasing populations in these countries and their consequent increases in demand for energy is likely to constrain the levels at which these countries can continue to export.

In conclusion, and to justify the heading at the top of this piece, BP anticipate a continued growth in US oil production such that, by 2035 imports are virtually eliminated, being more than offset by the gains in the export of natural gas products. BP anticipates that the latter will increase by 2025 to around 12 bcf/d and continue at about that level.


Figure 11. BP projections for changes in the US oil supply sources for the period to 2035.

Read more!

Wednesday, May 8, 2013

OGPSS - The dangers of complacency

Perceptions based, perhaps on too small a collection of information, can lead into opinions that, on investigation, turn out to be incorrect. Just recently a couple of friends had mentioned that charities that they are associated with were seeing a decline in donations. I built this into a picture of the general public being less able to afford earlier levels of giving, perhaps because of the continued impact of higher costs of fuel. The perception is, however, as a general statement wrong, and (Via the National Park Service from The Giving Institute I learn that:
Americans gave more than $298.42 billion in 2011 to their favorite causes despite the economic conditions. Total giving was up 4 percent from $286.91 in 2010. This slight increase is reflective of recovering economic confidence.

The greatest portion of charitable giving, $217.79 billion, was given by individuals or household donors. Gifts from individuals represented 73 percent of all contributed dollars, similar to figures for 2010.
In the perception that is becoming increasingly prevalent on the future of energy supplies, and particularly crude oil, the current adequacy of supply is projected forward to anticipate no problems with supply in the future. Peak oil is now being suggested to occur, not because the supply is limited, but because, with the increasing use of renewable energy, demand will peak, and then decline. Bloomberg New Energy Finance founder Michael Liebreich is quoted as projecting that the growth in fossil fuel use will almost stop by 2030, while Citi Commodity Researchers are suggesting that the increases in prices will drive increases in efficiency that will bring a peak in oil demand “much sooner than the market expects.”


Figure 1. Projected changes in global oil demand from Citi Commodity Researchers)

This anticipation of future gains in efficiency of use is a common thread to pictures of the future from the three major oil companies that I recently reviewed. All three, ExxonMobil, Shell and BP expect that energy efficiency gains will have a major impact on demand. BP, for example, anticipates that through 2030 energy demand will increase 36%, but that without this improvement in efficiency global energy would have to double by 2030.

One of the problems in assessing the changes in efficiency over time is that, when looking at the past decade, one has to recognize the significant impact of the recession. For example, the Odyssee project looked at energy use in Europe and clearly showed the impact of the recession on demand.


Figure 2. Changes in electricity use in the countries of Europe following the start of the recession. (Odyssee)

What also caught my attention in looking where most of the energy savings were occurring was that it was in countries catching up to Western Europe, rather than in the more established West, and that when the overall savings are totaled these appear to have slowed significantly.


Figure 3. Overall energy savings in the EU relative to a 2000 baseline (Odyssee)

The second problem with the curve that Citi projects lies in the rate at which vehicles are switched from diesel and gasoline to natural gas power. There is currently an economic incentive in parts of the world to make this change, it currently sells at around the equivalent of $2.10/gallon in the USA. Yet it requires both infrastructure and an investment of capital to make the change at any level of significance. Nevertheless it remains a key ingredient of the Pickens Plan that Boone Pickens has been selling around the country for a number of years now.

The fact that Clean Energy Fuels can list all 22 stations that added natural gas pumps along the “Natural Gas Highway” in the November-January period, does not indicate a great rush to build that infrastructure. It is easier to change the local distributor networks, with companies such as Waste Management indicating that they will use CNG in 80% of their new trucks, than it is to see the rapid change of the longer distance haulers, and for passenger vehicles. A recent article in the Washington Post noted that only 20,381 vehicles ran on natural gas of the 14.5 million new cars and trucks sold last year. Further not only does a CNG vehicle cost more to purchase, it also has a lower range, although for some applications that may not be much of a handicap.


Figure 4. Average Annual Vehicle miles travelled by category (Alternate Fuels Data Center )

Yet, at the moment, it is the use of ethanol that is having the most impact on alternate fuel use. Other than that there has been little indication of much change in the market.


Figure 5. Alternate Fuel Vehicles in use from 1995 to 2010. (Alternate Fuels Data Center )

And in this regard Europe has also seen little movement toward the use of natural gas, in contrast with the use of biofuels, and neither has made large gains.


Figure 6. Comparative penetration of liquid fuels market in Europe by biofuels and natural gas (Odyssee)

The problem, of course, is that if these improvements in efficiency and switches to alternate fuels do not occur, then the demand will continue along the Business-As-Usual line, and, as BP forecasts, demand will double by 2030.

The question as to what will be available to meet that enhanced demand remains one of the great imponderables that folk seem, again, unwilling to face. Certainly with a steadily increasing demand, and the constraints on supply that these pages have continued to document over the years, it becomes very difficult to see how price stability can be maintained, where demand exceeds supply at a given price. The problems that this will bring, particularly those nations that now subsidize fuel, a policy that is unlikely to change in Asia, are likely to be major. Yet for countries such as India, which last year has spent the allocated fuel subsidy budget for the year by the end of July the political costs of change remain very high and could well remain in place until the financial burden becomes intolerable. Unfortunately, with the current complacency, at that point it will then be too late to start searching for alternate answers.

Read more!

Wednesday, April 17, 2013

OGPSS - The BP look into the future

So I suspect I should apologize. Here I am talking about the future projections for energy production that have been made by companies such as ExxonMobil and Shell, as though they were still the key and only players in the world. Yet, in reality, Saudi Aramco (12.5 mbdoe); Gazprom (9.7 mbdoe) and National Iranian Oil (6.4 mbdoe); appear in the list before ExxonMobil arrives (at 5.3 mbdoe), and then there is PetroChina (at 4.4 mbdoe) before BP arrives (at 4.1 mbdoe) and it is only then that we find Shell, which lies 7th at 3.9 mbdoe.

So the projections of the ExxonMobil’s of the world are of somewhat lesser value than they might, at one time, have been. (For those curious the list continues with Pemex (at 3.6 mbdoe); Chevron (at 3.5 mbdoe) and Kuwait Petroleum Co (3.2 mbdoe). This not only rounds out the top ten, it also closes out the list of those producing more than 3 mbdoe. (Abu Dhabi comes next at 2.9 mbdoe).

Yet, with those caveats, and recognizing that Saudi Arabia now produces only slightly less than ExxonMobil, Shell and BP combined, let me review the BP forecast, having already completed that for ExxonMobil and Shell. And while the latter two looked sufficiently far into the future as to obfuscate a little their shorter-term projections, BP is still focusing on the relatively short-term that runs to 2030.

Within that time frame BP expects overall energy demand to grow by 36%, though, as with the ExxonMobil projection, BP expects that a “tremendous increase” in energy efficiency will continue to develop, thereby slowing the need for future resources. They point out that, without this improvement in efficiency, global energy supply will need to double by 2030 in order to sustain economic growth.

This is particularly true for the United States, which BP sees approaching self-sufficiency in Energy, while it is the continued growth in demand from countries such as China and India and the Asian Pacific countries that provide most of additional need. Comparing their view from 2 years ago with the present there does not appear to be much change in the overall forecast. (Note that after the first two figures all the remainder come from the 2030 BP Energy Outlook).


Figure 1. Comparison of BP data and projections for population growth between their 2011 report (left) and that for 2013 (right)


Figure 2. Comparison of current and anticipated energy demand through 2030, from 2011 (left) and 2013 (right) BP reports.

There is a small increase in the overall demand from non-OECD countries in the more recent projection, but not a great difference. But this increase in demand reduces from a growth averaging 2.1% in the 2010-2020 time frame, to a growth of 1.3% in the following decade.

Within the period to 2030 BP anticipates that all major energy sources will continue to see an increase in overall energy production.
The fastest growing fuels are renewables (including biofuels) with growth averaging 7.6% p.a. 2011-30. Nuclear (2.6% p.a.) and hydro (2.0% p.a.) both grow faster than total energy. Among fossil fuels, gas grows the fastest (2.0% p.a.), followed by coal (1.2% p.a.), and oil (0.8% p.a.).

Figure 3. Growth in different energy sources through 2030

However, there is a change in the ranking of the different fossil fuels from the earlier projection. For while, two years ago, BP were projecting that coal, oil and natural gas would virtually tie in terms of market share by 2030, coal is now given a more dominant role, with natural gas falling below oil.


Figure 4. Change in market share for the different energy sources.

Coal is, within this time frame, not really bounded by available supply, though BP anticipate that more will be produced indigenously in the Asian Pacific than at present. Partly one assumes that this is necessary for financial reasons, although it will also be a need-based growth as the countries increasingly need electric power.

In terms of natural gas and oil supply questions are more urgent, and BP provide the following answer.


Figure 5. BP anticipated sources for the anticipated growth in demand for energy.

By far the largest production from the tight oil and gas shales will come from North America, where the current growth in production is anticipated to continue.


Figure 6. Anticipated production of tight oil and shale gas by region in 2030

One of the drivers that BP see, in the fall in oil demand, comes from its continued high price. This has already significantly lowered the use of oil as a power generating fuel, and the continued high price will drive the move to vehicles of increasingly greater efficiency. Thus, although global liquid fuel demand will continue to grow, it will only be at the rate of 0.8% pa, reaching 104 mbd by 2030. The sources to meet this are various:


Figure 7. Liquid fuel supplies through 2030

With the conventional supply of crude from non-OPEC countries diminishing, OPEC crude levels can be seen to increase over the next seventeen years, while the major increase in production from tight oils is anticipated to come from North America. In 2030 it will provide 9% of overall demand, providing almost half of the 16.1 mbd of overall increase in production. The increase will, however, slow post 2020, as the costs of production and the limits of the resource base. BP make the following prediction:
The US will likely surpass Russia and Saudi Arabia in 2013 as the largest liquids producer in the world (crude and biofuels) due to tight oil and biofuels growth, but also due to expected OPEC production cuts. Russia will likely pass Saudi Arabia for the second slot in 2013 and hold that until 2023. Saudi Arabia regains the top oil producer slot by 2027.
Other than tight oil, BP anticipates some increase in biofuel production, and from the oil sands, with significant increase in Iraqi production, and some gain from the remaining OPEC countries (one suspects Venezuela is included here) and from NGL production.
The largest increments of non-OPEC supply will come from the US (4.5 Mb/d), Canada (2.9 Mb/d), and Brazil (2.7 Mb/d), which offset declines in mature provinces such as Mexico and the North Sea. The largest increments of new OPEC supply will come from NGLs (2.5 Mb/d) and crude oil in Iraq (2.8 Mb/d).
In this regard BP believes that currently OPEC has a spare capacity of around 6 mbd, but will continue to cut production to sustain prices over the decade.

BP see roughly a 7% p.a. increase in shale gas production with most coming from the United States, Mexico and Canada. This will bring total natural gas production to 459 bcf/day by 2030. Of this North America will see a growth in production of 5.3% pa and by 2030 will be exporting roughly 8 bcf/d. In other countries the biggest growth will be in more conventional natural gas production, coming from the Middle East (31 bcf/d), Africa (15 bcf/d) and Russia (11 bcf/d).

This increase in supply, and the greater use of LNG tankers is likely to keep natural gas prices relatively stable.

Read more!

Saturday, January 28, 2012

The 2012 version of BP Energy Outlook 2030

There are many unintended consequences as fuel supplies become more scarce, and expensive. (With a h/t to Rune Likvern), I see that those Greeks who are being starved of affordable fuel are starting to chop down trees for warmth and income. This sort of desperation has devastated the countryside all over Albania, Africa and Asia, and is extremely difficult to recover from. To stop that practice spreading the world expects that fuel must be available at an affordable price, and one of the ongoing questions is as to whether it will continue to be.

In that regard BP has just released its Annual Energy Outlook 2030 looking at how the world energy supply, and mix, will change in the years up to 2030. The booklet is an update from the study that it released last year, and which was reviewed at the time. This year the introductory speech by Bob Dudley focused on energy demand in China and India; Middle East exports and transport fuel demand. BP see overall energy demand growing some 40% over the next two decades, with virtually all growth coming from the developing countries. More than half will come from China and India alone. And of that energy, they anticipate that the supply will break out as follows:

Summary of energy supply source contributions (BP Energy Outlook 2030)

Demand will grow across virtually all sections, apart from that of transportation in the OECD, which is expected to fall over the next two decades.

Demand changes in the next two decades (BP Energy Outlook 2030)

Oil will still be the basic source for transportation fuel, and though growth in demand is anticipated to be only 1% a year that turns into another 16 million barrels a day by 2030. One has to be careful therefore in assessing the contributions of the different sources of fuel, as percentages, since, while these may be falling relative to the whole, the actual volumes that are being consumed may still be rising.

Expected changes in the relative sources of energy supply prediction from last year (left) to this (right)through 2030 (BP Energy Outlook 2030)

On a minor note, the role of coal, some 20-years from now surpasses that of oil, while last year the two were about equivalent. Even though BP expect that, by 2020, coal’s share of the global market will begin to fall, though less steeply now than they anticipated last year. And BP expects that some of the change in the mix will be brought about by technical change.
Technology underlies many of the trends apparent in this report. For example, the supply of gas has been accelerated as a result of technologies that unlock shale gas and tight gas. In the transport sector, we believe the efficiency of the internal combustion engine is likely to double over the next 20 years. And that will save roughly a Saudi Arabia’s worth of production. By 2030, we expect hybrids to account for most car sales and roughly 30% of all vehicles on the road.
The interesting question is, of course, where BP think that all the oil will come from. Last year, when they projected the same growth rate, the sources were expected to be Saudi Arabia and Iraq. This year they project that more will come from Deep water, rising from the 9% of supply anticipated last year, to 10% in the current review. (Currently it is at about 7%) But, more interesting is that they see the roles of energy efficiency and technical exploitation of indigenous resources leading to a great change in the international fuel market.
we foresee both the Americas and Eurasia - or Europe including Russia and the former Soviet Union - achieving self-sufficiency in energy, while the Middle East will generate surplus supply for Asia’s surplus demand. In the US for example, oil imports have dropped by about one-third since peaking in 2005 and are likely to be half of today’s level in 2030. The US now produces over 50% of the liquid fuel it uses – as opposed to importing the majority, as was the case a few years ago.
For the U.S. and European pictures to change as much as they anticipate, cellulosic ethanol still appears to be the flag pole on which they have hung their future, and in which they remain heavily invested. Yet when one looks at the make-up of the sources for fuels in 2030, as projected this year over that suggested last there has been a slight gain in overall volumes required.

Anticipated sources of fuel in 2030 – last year’s projection (left) and this year (right)

The interesting changes come in the changes in the Non-OPEC growth, with the contribution from bio-fuels diminishing, growth in US production replacing that anticipated from the FSU (wonder where that went?) and a drop in the Non-OPEC declines. To answer my own question, I suspect that the growth in FSU supplies (which I am covering elsewhere) has been melded into the need to sustain production at current levels, and that may be a part of the reason for the drop in the Non-OPEC declines.

When one considers that BP are forecasting an increase in demand of 8 mbd from China, 3.5 mbd from India, and 4 mbd from the Middle East, with the non-OPEC decline being at 6 mbd, there is a total of 21.5 mbd of new production being forecast, over the next 20 years. And of this 12 mbd will come from OPEC, namely Saudi Arabia and Iraq, but with a significant contribution, 4 mbd, from NGLs.

At which point I cough gently and draw your attention to recent remarks (h/t Stuart Staniford) of the Saudi Oil Minister, who suggested that they have flexibility up to a full production of 12.5 mbd, with a little time, but, on the other hand, they will drop production to keep the price over $100 a barrel. And so there is a suspicion that as Libyan oil production returns to normal, Saudi production may fall, in balance. The upper limit on Saudi Production had earlier been set at 12 mbd, but both these figures are now coming under increasing question, particularly since Aramco has had problems in finding a market for their heavier crudes, which make up almost all of the surplus over current production. (And the Saudi refineries to treat them are still a couple of years away). Yet if the refineries to treat those oils do come on line, and that increases Saudi capability by 1 mbd of marketable product from Manifa, it will still only bring them up to about 11 mbd. And it may be that they will raise production that much, to offset increasing domestic use, and maintain the volume of exports that they need to sustain their economy. But how long they can do that, relying on their ageing major reservoirs remains, of course, the other big question. BP anticipates that they will increase production by 3 mbd over current levels, and still have a cushion of a million or so barrels a day.

And as for Iraq, the country exported 2.14 mbd in December having risen 275 kbd or 14.4% over the year. Whether that can be sustained in the face of continued troubles is not clear. The Al-Ahdab field has come on stream and is ahead of schedule, at 120 kbd, though it may well be that all that oil ends up in China. BP, however, are assuming that Iraq can double production, to 6 mbd, by 2030.

Growth in production in the Americas is anticipated to come from the oil sands (up 2.2 mbd); the Brazilian deep waters ( another 2 mbd) and U.S. shale oil ( at 2.2 mbd). Total biofuels growth of 3.5 mbd balances out the anticipated supply and demand at just under 105 mbd.

The continued growth in natural gas is divided into two parts, that which is shipped through pipelines, and that sent as LNG in tankers. Total demand will rise about 50% with the Middle East, China and India providing most of the increase in demand, and with supply coming from a number of sources.

Changes in natural gas demand and supply over the next 20 years (BP Energy Outlook 2030)

The growth in use will be across all sectors of the economy, but if I do an eyeball comparison it seems as though there is a significant drop in LNG increase over the numbers that BP were using last year. Back then they were seeing an increase of around 70 bcf/day over the interval, now while they are projecting a growth of 4.5% p.a. the overall volume is somewhat less.

Coal demand will continue to rise, largely due to increased demand for power and industrial use in China and India, while western nations slowly ease away from the fuel.

Changes in coal use over the next 20 years. (BP Energy Outlook 2030)

BP summarizes the changes that they have made, relative to last year’s forecast as:

Changes in BP forecasts from 2011 to 2012. (BP Energy Outlook 2030)

Overall it looks to be a rather optimistic view of the future.

Read more!

Tuesday, February 1, 2011

The ExxonMobil view of the future

A couple of weeks ago I reviewed the BP Energy Outlook to 2030, and noted, in passing, that there were a couple of assumptions that might be quite optimistic – though I did not get into the details of the forecast. ExxonMobil (EM) has also put out a forecast, and it could be informative to see what, comparatively, they anticipate for this same future period. I am going to try and follow the same steps that I did with the review of the BP plan, to make comparisons easier.

The first difference is in world population, which BP anticipates will grow by 1.4 billion by 2030, EM is a little more conservative, with growth closer to 1 billion for a total of 7.9 billion. (Current population is 6.9 billion. EM relies on the UN and the World Bank for its figure). In itself this changes the overall level of demand, since both expect that per capita consumption of energy will also rise. There is one oddity that I might initially mention (and yes I know the dollar base differs) but contrast these two graphs – the left is from BP and the right from EM.


While I did not get the scales exactly the same, you can see, to a first estimate, that the global GDP in 2030 for EM is roughly the same size as the Non-OECD GDP estimated by BP. (A quick check on Google says that the current GDP is at $58 trillion). This difference continues in the assumptions of the areas of greatest growth. While, as can be seen above, BP sees OECD growth as virtually flat and all the increment being from non-OECD, EM has OECD growing at 2% and non-OECD at 5%. But that will still only put the non-OECD at 40% of the global economy by 2030, which is the inverse of the BP projection.

Change in GDP does not however easily translate into changes in energy consumption, particularly given the much lower relative energy consumption of the non-OECD countries. EM sees energy use in the OECD staying relatively flat, the gain in GDP is accomplished with an increase in the efficiency of energy use. (Which agrees with the BP position). Thus by 2030 it is the non-OECD countries that will increase demand to the point that they will have an energy demand that is 75% higher than that of the OECD.

With that as background, where and how much energy does EM anticipate will be used in this future. To make the two forecasts simpler to follow I have had to convert since while BP works in millions of barrels of oil equivalent (mboe) throughout, EM uses Quadrillion Btu’s or Quads in places. (A barrel of oil is equivalent to 5.8 million Btu, or conversely 1 Quad is equivalent to 172 million boe). And then to make life a little more fun BP has used tons of oil equivalent, making the Quad equivalent to 24 million tons of oil equivalent. (Using 7.16 barrels to the ton to simplify future arithmetic). Having done that, and with a little Photoshop scaling, I can compare the two energy projections.

Comparison of BP and EM energy futures, (The vertical scale is in billions of tons of oil equivalent. )

One of the immediately obvious items is that the amount of coal use that EM is projecting is considerably less than that projected by BP, there is a little more use of oil, and about the same amount of NG.

BP had generated a graph that predicted that by 2030 oil’s share of the global market would continue to fall, while after an initial increase in percentage use, coal would fall on a parallel path with oil, so that, by 2030, both would share equally with natural gas at about 26% of the global energy market each. The remainder of the market, at about 7% each would be equally divided between Hydro, Nuclear and Renewables. Of these renewables (which include biofuels and biomass) would have the steepest increase.

Sources of Future Energy Supply (BP Energy Outlook)

EM on the other hand see the energy supply in 2030 being divided so that oil retains 32% of the overall; natural gas has risen to 26%, and coal has fallen to 21% of the overall. The non-fossil sources are divided 8% for nuclear, 3% for hydro and 11% for the renewables that include biofuels and waste (which is not separately identified by BP).

EM estimate of how fuel use will change over the next 20 years

The above plot shows percentage growth, rather than market share, so that while wind, solar and biofuel energy production grows strongly, by 2030 it is still providing only 3% of global energy.

Looking at the individual fossil fuels in turn – EM sees that India will provide the largest new market for coal, while Chinese demand will soon peak, and demand in the more industrialized nations declines in the face of increased concerns over carbon dioxide emissions.

Increased production from the Canadian oil sands will team with the growth of biofuels in a combined 5% contribution to global liquid fuels according to EM (this is a little less than that projected by BP, who has 2 mbd for oil sand and just over 4 mbd in biofuel growth). And, by 2030 EM expects that NGL supply will amount to about 10% of total hydrocarbon liquids, totaling around 11 mbd. This is quite a bit more than BP project (at about 4 mbd – though that is assigned only to the OPEC nations, and there could be more from other sources though that is not mentioned in the BP document).


EM’s answer to where all the additional oil is going to come from is Deepwater. It projects that by 2030 deepwater production will be at over 14 mbd. The more than doubling of production is anticipated to be almost across the globe, whether Africa, Europe, Latin America or North America.


Because of this emphasis on deepwater, and in order to provide reassurance against the likelihood of another major spill, EM discuss, within their document, the development of the Marine Well Containment System, which is designed to ensure against what happened this past year.

Natural Gas is the seen as the major growth fuel of the next 20 years, and EM anticipate that use of NG will rise to make it the second most popular fuel (bypassing coal but not oil) by 2030. Interestingly they see the supply of NG over the 2005 volumes as coming almost equally from conventional wells, from unconventional (gas shale) wells in the US and Canada, and from imports. (Though it doesn’t say where from). Unconventional supply is anticipated to grow five-fold.


In the end EM seems to be expecting more from natural gas than other fuels over the next twenty years, more so than BP. This seems to be a reasonable assumption, as I said when reviewing the BP projections, providing only that that there is that one new development (cheaper production and longer well life) that is needed for more viable shale gas production. This is particularly true when one looks at the primary sources of electric power generation, in the three main sectors of the world.


EM sees the United States and Europe being much more aggressive in reducing coal use, and expects a greater role to be played by nuclear power plants than BP.

In summary ExxonMobil has a much more positive view of the long term sustainability of oil as a fuel, with a much greater contribution from the deepwater than BP had projected. It sees the role of coal fading from the future energy field, while natural gas will continue to develop and gain market share.

Read more!

Thursday, January 20, 2011

The BP Energy Outlook to 2030 - a review

There is a significant reliance, among those who write on fossil fuels, on the statistics that BP annually compile on global energy production. For example it provides underlying information for Energy Export Databrowser, as well as many of the posts at The Oil Drum. And so when BP just released their forecast for Energy for the next 20 years (Energy Outlook 2030) it is worth having a look at to see what they predict. Bear in mind that this is only one company prediction, yet nevertheless it is an influential one.

The report is very briefly summarized in the introductory speech by Bob Dudley, the Chief Executive, who chose the following highlights:
• Global energy growth will average 1.7%, but will be generated by non-OECD nations, while demand from OECD will remain relatively stable.
• Oil supply will grow at around 1% per year, with major increases in supply coming from OPEC, particularly Saudi Arabia and Iraq.
• Coal use will grow at an average of 1.2% per year, largely through demand for power from non-OECD nations.
• Natural gas will be increasingly used as a power source, with demand growing at 2.1% per year.
• Renewable energy sources will continue to be favored, with growth being at around 8% per year, and with demand for biofuel tripling over the two decades.
• Deeepwater production of oil will rise from 7% of the global demand to 9% by 2020.

Those were the initial highlights, and there is slightly more detailed summary at the BP website. Since the booklet that summarizes the data is some 30 pages long, but uses a considerable number of graphics to show the projections, let me borrow some of these to summarize what I see as some of the critical points (and I will add a few editorial comments as I go).

The review (which is the first of its type that BP has released) recognizes that the face of energy consumption is changing. As the world population continues to grow, the shift in energy intensive industries to the developing countries has shifted the locations where demand will grow. Since industrialization also increases the energy use by their populations, there is a compounding rise in their energy use.

Projections of population and Energy Growth (BP Energy Outlook)

What is more interesting to me is how they see how this energy will be supplied. The overall projection is shown in this chart:

Projected future source of Energy Supplies (BP Energy Outlook)

The fastest growing of these segments is that of renewables (which includes biofuels). This can be seen more explicitly in this graph from the report:

Sources of Future Energy Supply (BP Energy Outlook)

The growing impact of renewable energy production will affect both electricity generation, and transportation (the latter mainly through biofuel growth).

Looking specifically at the different fuel sources, the report anticipates that oil growth, will be some 16.5 mbd over 20 years, but that this will have to also compensate for about 4.5 mbd of declines in non-OPEC producers. Non-OPEC will, however, see an increase in overall production, the gains coming from about 2 mbd of increased production from oil sands (with the assumption that this is Canadian, since it is not credited to OPEC, of which Venezuela is a member), from the FSU, and from a significant increase in biofuels, only some of which is anticipated to come from the sugar-based ethanol of Brazil.

Sources of future liquid fuel supply (BP Energy Outlook)

In looking at the above chart it is important to recognize the distinction between the FSU and Russia itself, since that country may well start into a decline in production within the year. The increased production will come from places such as Azerbaijan and Kazakhstan.

The second point is that relating to biofuels, where BP note that renewables currently provide 3% of liquid fuel for transport, but that this is expected to rise to 9%. (Within the next 20 years increased rail, electric, hybrid and CNG are not expected to make a material contribution, though CNG use is expected to be about 2%). The concern with biofuel production is that it is virtually all anticipated to come from ethanol. And, as we have just seen with the closure of the Range Fuels plant in Georgia this week, the commercial viability of cellulosic ethanol has yet to be established, challenging not only the BP view of the future, but also that of others. The practicality of further increase in corn ethanol production in the United States is doubtful, giving the rising cost of the raw feed stock (corn). However this is the projection, and increasingly BP expects that biofuels will meet increases in liquid fuel demand (rising to meeting 60% of the growth by 2030). There is, however, an allocation of 1 mbd for increases in refinery gains (which I have discussed earlier) and from natural gas and coal, which perhaps gives some indication of their opinion of this latter effort.

Anticipated size and source of Biofuel production (BP Energy Outlook)

It is the dramatic increase in transport demand, particularly in Asia, that will drive the increased demand for liquids, China alone is expected to pass the United States in oil consumption within this time frame. To further supply that growth, NGL increases of more than 4 mbd from OPEC, and crude oil production growth mainly from Saudi Arabia and Iraq is projected. (In this regard it should be noted that a year ago BP were anticipating that Iraq might be producing 10 mbd by 2020 – the current more realistic target is 5.5 mbd by 2030. And while Iraq has stated it may be able to reach 12.5 mbd by 2017, the condition of the infrastructure in the country, among other issues, would suggest that BP are now more likely correct). Whether Saudi Arabia will rise to the challenge of producing (and likely more critically exporting) at the levels BP projects, given the current age and production history of its main fields is a question, since recent pronouncements from that country suggest a more conservative production capacity of 12 mbd and a disinclination, perhaps, to produce at even that level. (BP assume that both Russia and Saudi Arabia will retain their market share of 12% over the two decades, which, with an assumed total of over 102 mbd would give them each an assumed production of over 12 mbd). To reach the Saudi target BP expect them to expand production capability after 2020.

The major change in fuel use over the next two decades is expected to come in the increasing move from coal to natural gas as the primary source for electricity generation. Because of overall increases in power demand absolute demand for both fuels will increase, but increasingly the demand will shift to NG.

Thus, for example, Chinese growth in demand will rise at 7.6% pa to 43 bcf/day, though this will still only be 9% of their total energy consumption. It is the BRIC countries, which include Brazil, Russia, India and China (and now South Africa) (H/t KLR) whose overall growth in demand, with that in the Middle East, will likely prove greatest over the next two decades.

Expected growth in NG demand in the next 20 years (BP Energy Outlook)

By 2030 BP project that most use of oil for power generation has been displaced, with coal and NG being the primary fossil sources. NG use will increase to about 40% of the market, outside of Europe, where it rises to 65%, given the European concern over climate change. However, in terms of the absolute market, Europe will see a much greater impact from renewable resources generating power, so that the percentage that NG provides will only rise to 24%. Over half the NG supply in North America will come from shale gas and coal bed methane (CBM), elsewhere the impact from those resources will, within this time frame, be much less. Whether or not these unconventional resources reach the 57% market supply by 2030 will likely depend on the development of at least one new technological breakthrough that lowers cost while increasing long-term yield from the wells, but that is a quite feasible assumption.

Electric Power generation by source (BP Energy Outlook)

The market for LNG is anticipated to grow significantly (4.4% pa), particularly in Europe and Asia. Supply is initially seen as coming from the Middle East, but this will be followed by production from Australia which will overtake Qatar by 2020, and then African deposits will come on line providing 41% of the supply by 2030. It is interesting to note the caveat that BP introduce into this projection.
We assume that policy supports the continued rapid growth of non- fossil power generation – especially renewables, which attain a global share of 10% by 2030. Where gas is available at a competitive price, it continues to displace coal.

Regional demand growth for LNG (BP Energy Outlook)

It is the response that China makes in changing their primary source of power as they continue to expand production, and thus energy demand, that will decide how far, and how fast the transition from coal will occur. BP anticipate that the market overall will continue to rise until just before 2030, at which time it will flatten. But whether that happens will likely depend on availability and price, of both coal, and its potential replacements. (Hence the caveat).

BP recognize that this is only a base case projection, and that there are many different factors that will likely change the final results. That is likely to be particularly true if there is an upsurge in interest in climate change legislation and regulation. I have made some comments on how accurately I think that the models have been developed, but that should not detract from the value of this particular document which, being freely downloadable, is well worth getting and saving.

Read more!