It is perhaps an odd time to be writing about oil shortages. The price of gas in our town has just moved above $2 a gallon up significantly from the $1.64 it was at its recent lowest point, but still very reasonable. Debate still rages as to whether the global price of a barrel of oil has found a bottom, although there are signs that the price is beginning to increase, in part due to other issues than overall availability of crude. So why be concerned?
There are several issues, and perhaps the first is that of industrial inertia. Despite the daily fluctuations in oil price, many of the events that occur between the time that oil is found in a layer of rock underground and the time that some of it is poured into your gas tank take a long time to initiate, and similarly can’t be turned off overnight. It takes, for example, roughly 47 days for a tanker to travel from Ras Tanura in Saudi Arabia to Houston.
One response to the drop in oil prices has been to reduce the number of rigs drilling for oil in the United States. Again this is not an immediate response, but rather one that grows with time. This is particularly true with the number of oil rigs that are used to gain access to the oil reservoirs. As the price for this oil falls, so rigs are idled and the potential for additional oil production also declines. This drop is particularly significant in fields that are horizontally drilled and fracked because of the very rapid decline in production with time in existing wells and the need for continued drilling to develop and produce new wells to sustain and grow production. The most recent figures show a fall of 98 rigs in the week from the 6th to the 13th of February, with the overall count now standing at 1,358. This rate of decline has held at nearly 100 rigs a week now for the past three with no indication of any immediate change in the slope of the curve. At the same time the number of well completions in the Bakken is falling, as producers hold back on the costs for producing oil that would be sold at a loss.
The impact from this will take time to appear, North Dakota has reached a production rate of 1.2 mbd in December and the DMR estimates that it will need around 140 rigs to sustain that production level this year, with the most recent rig count being 137. This number is likely to continue to fall through the first six months of the year.
The impact is not just in the immediate loss of production. Rather, once the rigs are idled it will take time, even after the markets recover, for the companies to adjust their planning and finances, and to re-activate the rigs. What this effectively does is to shift the production increment into later years, when the production base from existing wells will have declined beyond current levels. This means that the peak level of production will likely also be lower than would otherwise be the case, and the period over which this peak production is sustained will also be shorter.
The problem that this all presages is that lower levels of production against an increasing world demand will induce a faster rise in price than many now anticipate. There is a complacent feeling that oil prices won’t reach $100 a barrel for some considerable time - perhaps even years. If the current difference between available oil supply and demand is below 2 mbd, Euan Mearns has suggested that roughly half of this might be eaten up by increased demand, while the other half would disappear as production levels drop, although he doesn’t see this bringing the two volumes into rough balance until the end of 2016.
I rather think that it will happen faster than that, and that the price trough will steepen faster than currently anticipated, and likely before the end of this year. The problem (if you want to call it that) with the perceptions of the ability of global production to meet demand is that it is all tied to the production of the United States and Canada. I have noted, over the past two years, how future projections of increasing global oil demand have been met, in models, by increased production from the United States, and that this was anticipated to continue. (Increased production from Iraq, if sustained, is more likely to be needed just to balance declines in production from other countries).
Yet the US industry is going into a relatively rapid decline because of the way that it is structured that is going to be hard to stop, and much slower to reverse than anticipated. (In a way it is similar to the intermittent traffic congestion one finds on roads which result because we brake a lot faster than we then accelerate). This will not only stop the growth in production that is currently anticipated, but will go further and before the end of the year will lead to a drop in overall volumes produced. Yet demand is expected to increase. Where will the supply come from, if not the United States?
While Saudi Arabia can produce more, one gets the sense that they are quite comfortable where they are, thank you and won’t be increasing their contribution, and while Russia may bemoan the price they are getting for their oil, if the price goes up they are not going to be able to meet an increased demand, nor are there likely to be others with spare capacity that they can bring to the table. And because of the inertia in the system the United States will still be in a mode of declining production.
So I rather suspect that what we can anticipate is that prices will start to recover through the summer, and then, as the full impact of the rebalanced situation starts to become evident, will move higher at an increasing rate. Because if, in fact, we are reaching the period of a tighter balance between demand and available supply, then the market will change its perceptions quite quickly and be driven by a totally different metric.
Showing posts with label crude oil production. Show all posts
Showing posts with label crude oil production. Show all posts
Monday, February 16, 2015


Saturday, December 13, 2014
Tech Talk - A Gentle Cough!
When I last wrote about the global supply of oil, it was back in October, as the fall in oil prices was developing. Since then the price has continued to fall, with prices now below $60 a barrel. I was doubtful back then that the price would fall as far as it has, and remain cynical that it will remain down for very long. Since this seems to go against much current wisdom, let me explain why I remain pessimistic that the boost to the global economy from access to cheaper fuel will continue for any great length of time.
It depends on whose data you believe credible as to how much more oil is available than that currently in demand. When looking at the numbers in the past I used a number of roughly 1 mbd, but this is hard to realistically quantify. Why – well the problem comes with the regions of the Middle East and North Africa (MENA) where there are current conflicts. The ones of particular concern are Libya and Iraq, although the fluctuating state of exports from Iran cannot be neglected. When the Libyan conflict first impacted the export of oil from that country Saudi Arabia began increasing its production to offset the loss in Libyan exports.
There came a time in September when Libyan exports, which had fallen to around 300 kbd from a high of over 1.6 mbd, shot back up to around 900 kbd. The EIA has recently shown an inverse correlation between Libyan production and oil price:

Figure 1. Brent Oil Price and Libyan oil production (EIA )
Thus, when an additional 600 kbd suddenly appeared back in the marketplace, it is not surprising that it had an impact on prices. However while there was already some surplus in the market (from increased production in the US etc, as I will comment on below) the volume of the addition had a more significant impact on prices, and when KSA decided not to reduce production this led the market to assume that we had returned to plentiful sufficiency, and prices have continued to fall since.
However, this perception is already unraveling. Libyan conflict has continued to embroil their oil fields. The Sharara field, which produces 300 kbd closed in November as conflict overwhelmed it. At the moment two of the oil export terminals are threatened, and with them another 300 kbd of oil. But it is not possible, at this point, to predict what is going to happen in either location. There is little sign that the conflict is any closer to resolution, meaning the production will continue to be threatened into the foreseeable future. Sadly it it more likely that this will have negative impact on oil production, so that it might be wiser to assume lower rather than higher volumes coming from the country.
The situation is a little clearer and more optimistic in Iraq, where the pipeline through Kurdish territory has lessened the impact of the Islamic State take-over of a large swath of the country. The recent agreement between the Iraqi Federal Government (IFG) and the Kurdistan Regional Government (KRG) approved early this month is already raising questions over the volumes that the KRG will put onto the market. The agreement calls for sales of around 550 kbd, but there is an additional 100 kbd that is available, the status of which is unclear. The country is exporting, overall, around 2.51 mbd and the pipeline to Turkey is currently carrying 280 kbd, but is being boosted to carry 400 kbd, with an ultimate throughput of 700 kbd. Part of the problem in assessing the market for this, however, in the short term is that the Iraqi crude is often heavier and of relatively lower quality than the market average. This is currently causing some marketing problems, leading the IFG to lower prices in order to find a market. In neither case, however, is the current conflict likely to impact the production for export, and while it is difficult to anticipate much production above 3.5 mbd. (The December OPEC MOMR suggests that they are producing 3.36 mbd at the moment) we are unlikely to se any significant reduction in production going forward. The significant growth in global production to meet a still predicted rise in demand next year (albeit down slightly from previous estimates) will, therefore, not come from OPEC, who still anticipate that they will produce, on average 400 kbd less than they have this year. It is still expected that American production will continue to rise to meet expectations of increased global demand.
The problem, unfortunately, with that view, is that increases in US production are tied to output from fracked horizontal wells that are expensive to drill, and have a relatively short production life, with the majority of production coming in the first year of operation. Thus, in order to sustain production, more wells must be drilled each month to cover the loss in production from existing operations. The North Dakota Department of Mineral Resources projects that 225 or more drilling rigs are needed to sustain the growth of production from the state over the next three years (at which time it will plateau at around 1.5 mbd). Presently there are roughly 180 rigs operating, with the count falling by the week, as the rewards, at present, do not match the cost. The agency anticipates that the number will fall by an additional 40-50 rigs by the middle of next year. Well completions are also falling by the month, as the industry likely plans to wait out the current hiatus in prices. The impact of this on even short term production should not be discounted. There has already been a slight fall in production, rather than a gain, in October, and that will likely accelerate.
Without any gain in production, and in fact seeing the potential for a drop in US production over the next year, then the anticipated surplus between oil supply and demand will likely disappear. Remember that the MENA nations are seeing a growth in their internal demand for oil (in the KSA this has already passed 3 mbd) so that if they had no impetus to reduce production and exports in the face of falling prices, so they are unlikely to increase production when prices pick up. (They haven’t before).
When will this all happen? Well I got the size of the price fall wrong, so don’t hold me to the exact timing, but I would anticipate that when we see the start of the driving season next year, the oil market will tighten rather quickly. Following that (given the inertia in getting production back in the US) we will (as I have been expecting for a couple of years) see the global concern over supply start to be a significant factor in 2016.
Have a Happy Holiday!
It depends on whose data you believe credible as to how much more oil is available than that currently in demand. When looking at the numbers in the past I used a number of roughly 1 mbd, but this is hard to realistically quantify. Why – well the problem comes with the regions of the Middle East and North Africa (MENA) where there are current conflicts. The ones of particular concern are Libya and Iraq, although the fluctuating state of exports from Iran cannot be neglected. When the Libyan conflict first impacted the export of oil from that country Saudi Arabia began increasing its production to offset the loss in Libyan exports.
There came a time in September when Libyan exports, which had fallen to around 300 kbd from a high of over 1.6 mbd, shot back up to around 900 kbd. The EIA has recently shown an inverse correlation between Libyan production and oil price:

Figure 1. Brent Oil Price and Libyan oil production (EIA )
Thus, when an additional 600 kbd suddenly appeared back in the marketplace, it is not surprising that it had an impact on prices. However while there was already some surplus in the market (from increased production in the US etc, as I will comment on below) the volume of the addition had a more significant impact on prices, and when KSA decided not to reduce production this led the market to assume that we had returned to plentiful sufficiency, and prices have continued to fall since.
However, this perception is already unraveling. Libyan conflict has continued to embroil their oil fields. The Sharara field, which produces 300 kbd closed in November as conflict overwhelmed it. At the moment two of the oil export terminals are threatened, and with them another 300 kbd of oil. But it is not possible, at this point, to predict what is going to happen in either location. There is little sign that the conflict is any closer to resolution, meaning the production will continue to be threatened into the foreseeable future. Sadly it it more likely that this will have negative impact on oil production, so that it might be wiser to assume lower rather than higher volumes coming from the country.
The situation is a little clearer and more optimistic in Iraq, where the pipeline through Kurdish territory has lessened the impact of the Islamic State take-over of a large swath of the country. The recent agreement between the Iraqi Federal Government (IFG) and the Kurdistan Regional Government (KRG) approved early this month is already raising questions over the volumes that the KRG will put onto the market. The agreement calls for sales of around 550 kbd, but there is an additional 100 kbd that is available, the status of which is unclear. The country is exporting, overall, around 2.51 mbd and the pipeline to Turkey is currently carrying 280 kbd, but is being boosted to carry 400 kbd, with an ultimate throughput of 700 kbd. Part of the problem in assessing the market for this, however, in the short term is that the Iraqi crude is often heavier and of relatively lower quality than the market average. This is currently causing some marketing problems, leading the IFG to lower prices in order to find a market. In neither case, however, is the current conflict likely to impact the production for export, and while it is difficult to anticipate much production above 3.5 mbd. (The December OPEC MOMR suggests that they are producing 3.36 mbd at the moment) we are unlikely to se any significant reduction in production going forward. The significant growth in global production to meet a still predicted rise in demand next year (albeit down slightly from previous estimates) will, therefore, not come from OPEC, who still anticipate that they will produce, on average 400 kbd less than they have this year. It is still expected that American production will continue to rise to meet expectations of increased global demand.
The problem, unfortunately, with that view, is that increases in US production are tied to output from fracked horizontal wells that are expensive to drill, and have a relatively short production life, with the majority of production coming in the first year of operation. Thus, in order to sustain production, more wells must be drilled each month to cover the loss in production from existing operations. The North Dakota Department of Mineral Resources projects that 225 or more drilling rigs are needed to sustain the growth of production from the state over the next three years (at which time it will plateau at around 1.5 mbd). Presently there are roughly 180 rigs operating, with the count falling by the week, as the rewards, at present, do not match the cost. The agency anticipates that the number will fall by an additional 40-50 rigs by the middle of next year. Well completions are also falling by the month, as the industry likely plans to wait out the current hiatus in prices. The impact of this on even short term production should not be discounted. There has already been a slight fall in production, rather than a gain, in October, and that will likely accelerate.
Without any gain in production, and in fact seeing the potential for a drop in US production over the next year, then the anticipated surplus between oil supply and demand will likely disappear. Remember that the MENA nations are seeing a growth in their internal demand for oil (in the KSA this has already passed 3 mbd) so that if they had no impetus to reduce production and exports in the face of falling prices, so they are unlikely to increase production when prices pick up. (They haven’t before).
When will this all happen? Well I got the size of the price fall wrong, so don’t hold me to the exact timing, but I would anticipate that when we see the start of the driving season next year, the oil market will tighten rather quickly. Following that (given the inertia in getting production back in the US) we will (as I have been expecting for a couple of years) see the global concern over supply start to be a significant factor in 2016.
Have a Happy Holiday!
Read more!
Wednesday, April 16, 2014
Tech Talk - Of production stability, peaks and the future
Jeffrey Brown (Westexas from TOD) is quoted extensively in Kurt Cobb’s recent piece that points out that global crude production has pretty reasonably stayed constant at between 64 and 67 mbd since 2005. (H/t Nate Hagens). While there has been a total increase in the total refined products side of the house (with the total number floating around 90 mbd) this includes a number of different sources that, within generally defined standards, are not considered crude. The four main culprits that he lists are biofuels, natural gas plant liquids (NGLs), lease condensate and refinery gains. He makes a good point.

Figure 1. Crude oil production alone over the past decade (Kurt Cobb)
I can remember that it was some years ago, when looking at the OPEC reports on production, that I suddenly realized that the projected increases in NGL production made a significant difference in the overall volumes that they were producing. (It is anticipated to average 5.95 mbd in 2014). Back in 2001 OPEC just defined the fluid as natural gas liquids, but went through significant revisions of numbers in 2002 and in March 2004 redefined the volume counted as “OPEC natural gas liquids and non-conventional oils”.

Figure 2. NGL and unconventional oil production by OPEC (OPEC MOMR )
Over the past decade volumes have almost doubled. In the United States, with the increased development of the shale gases, production has also increased.

Figure 3. Increase in production of NGL in the United States (EIA )
The price obtained for these fluids, however, falls below that of conventional gasoline. For example:

Figure 4. Relative prices of NGL fuels relative to crude and gasoline. (EIA)
The EIA is reporting a continued growth in US production:
Looking at the supply side for this year, and bearing in mind that gains must more than offset lost production if the total increase in supply OPEC are projecting an overall gain in supply of 1.34 mbd, largely to come from outside of OPEC. This is expected to come from the OECD Americas (the USA, Canada and Mexico) group, while the increased production from countries such as those of the Former Soviet Union is expected, to rise by 150 kbd or less.
There has been relatively little change in the estimates of where the increases in North American production are anticipated to come. By the end of the year US production is expected to reach 12.45 mbd by the last quarter of the year. As OPEC noted:
The total gain in production from the Gulf is currently anticipated to increase, this year alone, to perhaps 1.55 mbd, and to pass the previous record Gulf production of 1.8 mbd by 2016. In addition the Cardamom project is expected to add 50 kbd to the Olympus figure, and the start of oil production from Phase 3 of the Na Kika field is expected to add an additional 40 kbd to the 130 kbd which Na Kika is currently producing. However Gulf wells have a habit of going south a little earlier than predicted and I have borrowed the following graph from Ron Patterson which illustrates the cumulative fate of the combined Atlantis, Thunder Horse, Tahiti and Blind Faith fields.

Figure 5. Changes in production from major Gulf of Mexico fields over time (Ron Patterson )
When this is combined with Dennis Coyle’s prediction that the Eagle Ford field will peak in 2015, at 1.4 mbd, with a declining rate of production increase as one reaches that peak. Similarly the number of wells that can continue to be drilled in North Dakota in the sweeter counties of the state are limited, and beyond that there is a concern (which I have expressed before, and which others have explained much better than I) that as the estimates of production fall in the less successful regions of the state that it will become harder to raise the capital for the new wells needed to sustain and increase production.
That being said, I am beginning to suspect that this may be the year that the OPEC estimates for US production may get a bit ahead of what actually is produced. And if that is the case, then that means that the following two years will become even more interesting as the nations of the world start to realize that yes, there is a peak. Which might mean that the coal resurrection might be greater than I currently anticipate, but perhaps I will have more on that next time.

Figure 1. Crude oil production alone over the past decade (Kurt Cobb)
I can remember that it was some years ago, when looking at the OPEC reports on production, that I suddenly realized that the projected increases in NGL production made a significant difference in the overall volumes that they were producing. (It is anticipated to average 5.95 mbd in 2014). Back in 2001 OPEC just defined the fluid as natural gas liquids, but went through significant revisions of numbers in 2002 and in March 2004 redefined the volume counted as “OPEC natural gas liquids and non-conventional oils”.

Figure 2. NGL and unconventional oil production by OPEC (OPEC MOMR )
Over the past decade volumes have almost doubled. In the United States, with the increased development of the shale gases, production has also increased.

Figure 3. Increase in production of NGL in the United States (EIA )
The price obtained for these fluids, however, falls below that of conventional gasoline. For example:

Figure 4. Relative prices of NGL fuels relative to crude and gasoline. (EIA)
The EIA is reporting a continued growth in US production:
Altogether, in the Bakken, Niobrara, Permian, and Eagle Ford, oil production is expected to increase by 70,000 bbl/d in May 2014. The monthly growth rate is 3,000 bbl/d more than in April 2014 due to solid gains in Permian rig count and continuous rig productivity gains across the regions. While the DPR does not forecast weather impact, the spring thaw season has officially started in the Bakken region and may disrupt some drilling activity between now and June.These additional resources take on an increasing importance as world demand is anticipated to increase another 1.14 mbd this year, slightly up on this year’s figure. This gain in demand was largely offset by increased production from the Americas, though OPEC note that overall global suppliy decreased last month to average 90.63 mbd but is expected to reach peak demand in the fall, at 92.24 mbd.
Looking at the supply side for this year, and bearing in mind that gains must more than offset lost production if the total increase in supply OPEC are projecting an overall gain in supply of 1.34 mbd, largely to come from outside of OPEC. This is expected to come from the OECD Americas (the USA, Canada and Mexico) group, while the increased production from countries such as those of the Former Soviet Union is expected, to rise by 150 kbd or less.
There has been relatively little change in the estimates of where the increases in North American production are anticipated to come. By the end of the year US production is expected to reach 12.45 mbd by the last quarter of the year. As OPEC noted:
Based on the US Energy Information Administration (EIA)’s monthly oil production report for January, regular crude oil output registered at 4.93 mb/d, tight oil production increased to 3 mb/d, NGLs output reached 2.64 mb/d and biofuels and other non- conventional oils recorded the highest output at 1.22 mb/d. The use of energy from biomass resources in the United States grew by more than 60% over the decade between 2002 and 2013 — primarily through increased use of biofuels like ethanol and biodiesel which are produced from biomass. According to the EIA, biomass accounted for about half of all renewable energy consumed in 2013 and 5% of total US energy consumed.This month the OPEC MOMR focused on increased production from the Gulf of Mexico, with anticipated gains from the Olympus project at Mars B.
The total gain in production from the Gulf is currently anticipated to increase, this year alone, to perhaps 1.55 mbd, and to pass the previous record Gulf production of 1.8 mbd by 2016. In addition the Cardamom project is expected to add 50 kbd to the Olympus figure, and the start of oil production from Phase 3 of the Na Kika field is expected to add an additional 40 kbd to the 130 kbd which Na Kika is currently producing. However Gulf wells have a habit of going south a little earlier than predicted and I have borrowed the following graph from Ron Patterson which illustrates the cumulative fate of the combined Atlantis, Thunder Horse, Tahiti and Blind Faith fields.

Figure 5. Changes in production from major Gulf of Mexico fields over time (Ron Patterson )
When this is combined with Dennis Coyle’s prediction that the Eagle Ford field will peak in 2015, at 1.4 mbd, with a declining rate of production increase as one reaches that peak. Similarly the number of wells that can continue to be drilled in North Dakota in the sweeter counties of the state are limited, and beyond that there is a concern (which I have expressed before, and which others have explained much better than I) that as the estimates of production fall in the less successful regions of the state that it will become harder to raise the capital for the new wells needed to sustain and increase production.
That being said, I am beginning to suspect that this may be the year that the OPEC estimates for US production may get a bit ahead of what actually is produced. And if that is the case, then that means that the following two years will become even more interesting as the nations of the world start to realize that yes, there is a peak. Which might mean that the coal resurrection might be greater than I currently anticipate, but perhaps I will have more on that next time.
Read more!
Tuesday, December 3, 2013
Tech Talk - Falling gas prices and Iraq
Filling up at the local gas station yesterday I noted that prices are still below $3.00 a gallon, though at $2.99 only just below. Going back to the BBC Calculator this is still $2.04 less per tank than the regional average, and $86 less than I would pay in Italy. So even though the costs are rising over the last time I looked, they are still relatively low.

Figure 1. Relative fuel costs ($/gal) in different locations around the world. (BBC Calculator)
The orange line in figure 1 shows what I paid, and the darker grey horizontal line the regional cost here in the MidWest.
The EIA have noted in last week’s TWIP that the national price is as low as it has been since the beginning of 2011.

Figure 2. Average US retail prices for gasoline (EIA).
The EIA continues to describe the causes of these relatively low prices:
The problems in Iraq, for example, have now reached the point that the Turkish government is directly working with the Kurds in Northern Iraq, to develop the oil in the Kurdish northern part of Iraq. This comes at a time that Iraq has been negotiating with the different major oil companies that had contracted to help Iraq reach an overall production target of 12 mbd by 2017. There have been considerable doubts cast on that original estimate, with the IEA producing a report, reviewed in an earlier post that concluded that the country would be lucky to achieve a production goal of 6 mbd by 2020, with an out year estimate that the country would be able to reach 8.3 mbd only by 2035.
Recognizing some of the difficulties in gearing up oil production at the different oilfields around Iraq (some of which were discussed in another post last June) production targets for 2017 had already been scaled back to a goal of 9 mbd by 2017, a drop of 25%. Now there has been discussion between Iraq and its partners for the various fields to drop those target values further, despite the large scale of the reserves that are considered available.

Figure 3. Oil reserves by field (Financial Times)
Exxon Mobil had 60% of the stake in the West Qurna oil field, but after it had started to work with the Kurds independently of Baghdad it found that relations with the Central Government rather chilled. Exxon Mobil has thus sold 25% of their stake to Petro China, and 10% to Pertamina of Indonesia, bringing the EM stake down to 25%. The current discussions between the companies and the Iraqi government are aimed at reducing the production target of the field by around 1 mbd..
Oil has just started to be produced at West Qurna Two, but the initial target is to have commercial production by the end of the year has suffered from local disruptions and the initial goal to reach a production of 400 kbd by the end of 2014 is now also in doubt. Commercial production is now not estimated to begin until perhaps the end of the first quarter of 2014. Initially the field was to be producing 1.9 mbd by 2017. That goal had been lowered to 1.2 mbd at the end of 2012. How the current disruptions will play into that target is difficult to estimate yet, but a year ago the parties were assuming that production would have already reached 150 kbd.
Earlier this year ENI had agreed with the Ministry of Oil to lower the target peak production from the Zubair field from 1.2 mbd to 850 kbd with that goal to be reached in 2016.
Discussions are not yet complete on new target production to be achieved from the Majnoon field. Shell has just announced the start of production from the field with the intent of raising production to over 175 kbd by the end of the year. However the long term target of raising production to 1.8 mbd is now in question. Shell is reportedly suggesting that the 2017 target be lowered to 1 mbd.
Similarly over at the Rumaila field BP is in discussion over long-term production, although earlier last month Schlumberger stopped work at the field because of local disturbances. With the field producing 1.4 mbd the disturbance was short-lived and is not reported to have affected current production, though it is indicative of tensions within the country. Current discussions are aimed at lowering the 2017 target production by around 800 kbd.
When these cuts are combined the total reduction is around 3.65 mbd, taking 2017 production down to 5.35 mbd, which is below the earlier best case scenario envisaged by the IEA.
OPEC notes that, after reaching a peak recent production of 3.194 mbd in August, production has fallen back below 3 mbd in September and October, and with Saudi Arabia also cutting back below 10 mbd in October the Organization is lowering production to meet the reduced winter demand, albeit the reduction from Iraq might not have been anticipated.

Figure 4. OPEC production figures through Oct 13, 2013 as reported by others to OPEC (OPEC MOMR )
This means, unfortunately, that if the world was anticipating that the roughly 4 mbd increase in global demand by 2017 would be met largely by increased oil production from Iraq then they are likely to be sadly disappointed. Enjoy the lower gas prices while you may.

Figure 1. Relative fuel costs ($/gal) in different locations around the world. (BBC Calculator)
The orange line in figure 1 shows what I paid, and the darker grey horizontal line the regional cost here in the MidWest.
The EIA have noted in last week’s TWIP that the national price is as low as it has been since the beginning of 2011.

Figure 2. Average US retail prices for gasoline (EIA).
The EIA continues to describe the causes of these relatively low prices:
Lower global crude oil prices, high profitability for diesel fuel that has been encouraging refiners to increase throughput, high inventories, and the switch to less-costly winter grades of gasoline are among the factors currently driving gasoline prices.The OPEC Monthly Oil Market Report (MOMR) reports that global oil prices have fallen $2.04 a barrel (to $106.69) – the first decline in five months, as stocks increase and the Northern Hemisphere moves into winter. The estimate for global demand growth this year remains at 0.9 mbd, with the growth for next year anticipated to be at 1.04 mbd. This steady growth in global demand of a million barrels a day keeps raising the question as to where the increase is likely to come from. This is particularly germane given the disturbed conditions in a number of the MENA countries that provide a significant amount of baseline production, as well as anticipated increases.
The problems in Iraq, for example, have now reached the point that the Turkish government is directly working with the Kurds in Northern Iraq, to develop the oil in the Kurdish northern part of Iraq. This comes at a time that Iraq has been negotiating with the different major oil companies that had contracted to help Iraq reach an overall production target of 12 mbd by 2017. There have been considerable doubts cast on that original estimate, with the IEA producing a report, reviewed in an earlier post that concluded that the country would be lucky to achieve a production goal of 6 mbd by 2020, with an out year estimate that the country would be able to reach 8.3 mbd only by 2035.
Recognizing some of the difficulties in gearing up oil production at the different oilfields around Iraq (some of which were discussed in another post last June) production targets for 2017 had already been scaled back to a goal of 9 mbd by 2017, a drop of 25%. Now there has been discussion between Iraq and its partners for the various fields to drop those target values further, despite the large scale of the reserves that are considered available.

Figure 3. Oil reserves by field (Financial Times)
Exxon Mobil had 60% of the stake in the West Qurna oil field, but after it had started to work with the Kurds independently of Baghdad it found that relations with the Central Government rather chilled. Exxon Mobil has thus sold 25% of their stake to Petro China, and 10% to Pertamina of Indonesia, bringing the EM stake down to 25%. The current discussions between the companies and the Iraqi government are aimed at reducing the production target of the field by around 1 mbd..
Oil has just started to be produced at West Qurna Two, but the initial target is to have commercial production by the end of the year has suffered from local disruptions and the initial goal to reach a production of 400 kbd by the end of 2014 is now also in doubt. Commercial production is now not estimated to begin until perhaps the end of the first quarter of 2014. Initially the field was to be producing 1.9 mbd by 2017. That goal had been lowered to 1.2 mbd at the end of 2012. How the current disruptions will play into that target is difficult to estimate yet, but a year ago the parties were assuming that production would have already reached 150 kbd.
Earlier this year ENI had agreed with the Ministry of Oil to lower the target peak production from the Zubair field from 1.2 mbd to 850 kbd with that goal to be reached in 2016.
Discussions are not yet complete on new target production to be achieved from the Majnoon field. Shell has just announced the start of production from the field with the intent of raising production to over 175 kbd by the end of the year. However the long term target of raising production to 1.8 mbd is now in question. Shell is reportedly suggesting that the 2017 target be lowered to 1 mbd.
Similarly over at the Rumaila field BP is in discussion over long-term production, although earlier last month Schlumberger stopped work at the field because of local disturbances. With the field producing 1.4 mbd the disturbance was short-lived and is not reported to have affected current production, though it is indicative of tensions within the country. Current discussions are aimed at lowering the 2017 target production by around 800 kbd.
When these cuts are combined the total reduction is around 3.65 mbd, taking 2017 production down to 5.35 mbd, which is below the earlier best case scenario envisaged by the IEA.
OPEC notes that, after reaching a peak recent production of 3.194 mbd in August, production has fallen back below 3 mbd in September and October, and with Saudi Arabia also cutting back below 10 mbd in October the Organization is lowering production to meet the reduced winter demand, albeit the reduction from Iraq might not have been anticipated.

Figure 4. OPEC production figures through Oct 13, 2013 as reported by others to OPEC (OPEC MOMR )
This means, unfortunately, that if the world was anticipating that the roughly 4 mbd increase in global demand by 2017 would be met largely by increased oil production from Iraq then they are likely to be sadly disappointed. Enjoy the lower gas prices while you may.
Read more!
Sunday, September 29, 2013
Tech Talk - Iran and a slight cough toward CNN
There has been considerable comment this week over the telephone call between President Obama and the President Rouhani of Iran. Certainly the election of a new President in Iran gives the opportunity for a fresh start, particularly given the belligerent attitudes of his predecessor. However the cynical side of me does wonder if there is more driving this than simply the change of personalities.
There are two points that need to be considered, as a possible new relationship between the two countries might slowly coalesce out of the mists of diplomatic effort. Firstly the major driver seen in moving Iran toward a more positive position is said to be the increasing bite that sanctions, and particularly oil sanctions, are having on their economy. As sanctions have tightened, so Iranian oil production has fallen, with reports suggesting that oil exports have fallen from 2.2 mbd to May’s value of 0.7 mbd. The reduction in income that this has had on the Iranian economy is significant, with the currency officially devalued to half, though the effect has been more of an 80% fall from peak, as inflation has reached 42%.
Easing sanctions to allow more oil flow would significantly improve the situation, although there is concern, expressed for example at CNN, that the increase in oil flow would weaken the positions of the Kingdom of Saudi Arabia and Iraq. They suggest that the advent of Iranian oil (presuming that they can bring 1.5 mbd to the market relatively quickly) is foreseen as having a potential impact on the United States in that it may, at least transiently, produce a glut in the market. That would drive down prices, until such time as KSA could drop production and bring the supply and demand back into balance, raising prices back to around $100.
In a peaceful world such a scenario might have some viability, but consider what is really happening in the world of global supply. Instead of the KSA moving toward a supply of 12.5 mbd (which was only a capacity number in the first place) they have backed this down to 12 mbd and have talked recently as lowering that number further as they hire more and more rigs to help sustain existing production at just under 10 mbd. Iraq, which was promising to rapidly increase production toward a target of 11 mbd, is instead considered by the IEA likely to reach no more than 6 mbd by 2020. Further with the ongoing increase in violence in the country being able to sustain current production at around 3 mbd and increase it beyond 3.5 mbd as the Majnoon field comes on line. However Shell’s target for the field is already below initial estimates for this year, and it is discussing lowering the 2017 target from 1.8 mbd to 1.0 mbd. There has recently been an outbreak of violence in Kurdistan, which might portend that even in this relatively stable part of the country oil production and security is becoming a greater target.
These events suggest that future increases in production from around the region are not as assured as one might hope. At the same time, while there are those who continue to expect the United States to become oil-independent in the next few years, the reality is somewhat different, and further increases in production much above current figures become more difficult to justify. If Russia, similarly, is unlikely to increase production – which it is not – then the questions that should be asked are rather where is the world going to get the additional 1 mbd that it requires every year to balance increasing demand against supply.
Over the course of this year Saudi Arabia has had to increase production from 9.1 to 9.96 mbd to keep supply in balance, and prices stable. At the same time production from Libya, which has run at around 1.6 mbd had fallen to 150 kbd at the beginning of this month. Hopes that this could be increased back up to 700 kbd rely on tribal militias that control strategic parts of the country, and their long term co-operation is dubious, while the fields and pipelines in the east remain shut down. It seems reasonable to anticipate that there will be at least a million barrels a day of Libyan production held off the market for some time.
If one goes around the world one sees that Brazilian promises of production increase are behind schedule, as are promises of production increases from countries such as Veneuela. And suddenly one is left with not much in the way of places left to balance off the current declines in supply and increases in demand.
At this point that 1.5 mbd of potential supply from Iran starts to look a little more promising as an answer. It might allow KSA to ease back on production levels that might be starting to impose a little strain on their infrastructure. It would help to provide balance if production increases around the world fail to show on time. One should recognize that negotiations to bring Iran back into the fold are going to take at least a year or two before it is realistic to anticipate full return to supply, but even the easing of sanctions a little might cause the flow to China, India and Asia to increase to meet the burgeoning demands that they have, and oil is still to some degree fungible.
But in that regard, Iran has also just recently reached 100% output from the first of the nuclear power stations at Bushehr and is about to start construction of the second unit. Nuclear fuel will be provided by Russia, and spent fuel returned to Russia. It is a 1,000-megawatt unit, and since the unit was built under supervision by the International Atomic Energy Agency it is not subject to sanctions.

Figure 1. Bushehr Nuclear Plant
If the protocols that worked to make this happen can be expanded, then it is possible that, though negotiation, the tension in the region can be eased. This could well have benefits all around, most particularly for ensuring that, for at least a sadly few more years, there will be enough oil on the market to meet demand at a reasonable price.

Figure 2. Location of the Bushehr Plant
There are two points that need to be considered, as a possible new relationship between the two countries might slowly coalesce out of the mists of diplomatic effort. Firstly the major driver seen in moving Iran toward a more positive position is said to be the increasing bite that sanctions, and particularly oil sanctions, are having on their economy. As sanctions have tightened, so Iranian oil production has fallen, with reports suggesting that oil exports have fallen from 2.2 mbd to May’s value of 0.7 mbd. The reduction in income that this has had on the Iranian economy is significant, with the currency officially devalued to half, though the effect has been more of an 80% fall from peak, as inflation has reached 42%.
Easing sanctions to allow more oil flow would significantly improve the situation, although there is concern, expressed for example at CNN, that the increase in oil flow would weaken the positions of the Kingdom of Saudi Arabia and Iraq. They suggest that the advent of Iranian oil (presuming that they can bring 1.5 mbd to the market relatively quickly) is foreseen as having a potential impact on the United States in that it may, at least transiently, produce a glut in the market. That would drive down prices, until such time as KSA could drop production and bring the supply and demand back into balance, raising prices back to around $100.
In a peaceful world such a scenario might have some viability, but consider what is really happening in the world of global supply. Instead of the KSA moving toward a supply of 12.5 mbd (which was only a capacity number in the first place) they have backed this down to 12 mbd and have talked recently as lowering that number further as they hire more and more rigs to help sustain existing production at just under 10 mbd. Iraq, which was promising to rapidly increase production toward a target of 11 mbd, is instead considered by the IEA likely to reach no more than 6 mbd by 2020. Further with the ongoing increase in violence in the country being able to sustain current production at around 3 mbd and increase it beyond 3.5 mbd as the Majnoon field comes on line. However Shell’s target for the field is already below initial estimates for this year, and it is discussing lowering the 2017 target from 1.8 mbd to 1.0 mbd. There has recently been an outbreak of violence in Kurdistan, which might portend that even in this relatively stable part of the country oil production and security is becoming a greater target.
These events suggest that future increases in production from around the region are not as assured as one might hope. At the same time, while there are those who continue to expect the United States to become oil-independent in the next few years, the reality is somewhat different, and further increases in production much above current figures become more difficult to justify. If Russia, similarly, is unlikely to increase production – which it is not – then the questions that should be asked are rather where is the world going to get the additional 1 mbd that it requires every year to balance increasing demand against supply.
Over the course of this year Saudi Arabia has had to increase production from 9.1 to 9.96 mbd to keep supply in balance, and prices stable. At the same time production from Libya, which has run at around 1.6 mbd had fallen to 150 kbd at the beginning of this month. Hopes that this could be increased back up to 700 kbd rely on tribal militias that control strategic parts of the country, and their long term co-operation is dubious, while the fields and pipelines in the east remain shut down. It seems reasonable to anticipate that there will be at least a million barrels a day of Libyan production held off the market for some time.
If one goes around the world one sees that Brazilian promises of production increase are behind schedule, as are promises of production increases from countries such as Veneuela. And suddenly one is left with not much in the way of places left to balance off the current declines in supply and increases in demand.
At this point that 1.5 mbd of potential supply from Iran starts to look a little more promising as an answer. It might allow KSA to ease back on production levels that might be starting to impose a little strain on their infrastructure. It would help to provide balance if production increases around the world fail to show on time. One should recognize that negotiations to bring Iran back into the fold are going to take at least a year or two before it is realistic to anticipate full return to supply, but even the easing of sanctions a little might cause the flow to China, India and Asia to increase to meet the burgeoning demands that they have, and oil is still to some degree fungible.
But in that regard, Iran has also just recently reached 100% output from the first of the nuclear power stations at Bushehr and is about to start construction of the second unit. Nuclear fuel will be provided by Russia, and spent fuel returned to Russia. It is a 1,000-megawatt unit, and since the unit was built under supervision by the International Atomic Energy Agency it is not subject to sanctions.

Figure 1. Bushehr Nuclear Plant
If the protocols that worked to make this happen can be expanded, then it is possible that, though negotiation, the tension in the region can be eased. This could well have benefits all around, most particularly for ensuring that, for at least a sadly few more years, there will be enough oil on the market to meet demand at a reasonable price.
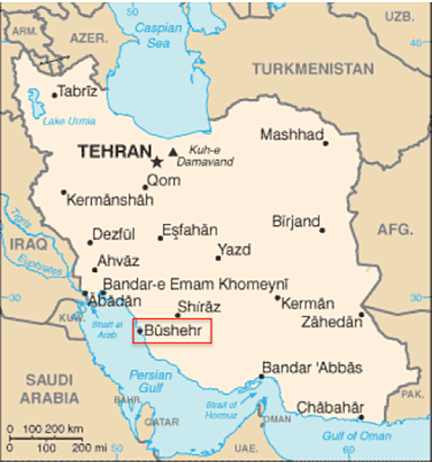
Figure 2. Location of the Bushehr Plant
Read more!
Thursday, June 20, 2013
OGPSS - Insecurity in the Middle East
The continuing conflict in Syria, and the slow spread of violence in the region around it, continue to make it difficult to make accurate predictions about the future of oil exports from the region. Within Syria itself production had fallen into decline about ten years ago, before the current struggle began. The precipitate drop over the last two years has, however, been much more dramatic. As Energy Export Databrowser noted from the BP statistic review, production fell by 49% last year.

Figure 1. Syrian oil production showing the recent fall in volume. (Energy Export Databrowser ).
As with most oil-producing nations oil consumption had, on the other hand, been steadily rising with net exports (some is exported as crude and re-imported as refined product) falling to around 100 kbd. The conflict has, however, also reduced internal consumption at similar rates earlier in the conflict.

Figure 2. Syrian production and consumption until 2011. (EIA )
At the same time that Syrian exports have sensibly disappeared, the exports from Iran have continued to fall. Data through the end of last year shows that sanctions continued to bite, with exports falling 31% last year.

Figure 3. Oil production, consumption and exports for Iran (Energy Export Databrowser)
Much of the oil from Iran goes to China, India and Turkey. In May 2013 the total exports are reported to have fallen to 700 kbd although individual monthly numbers fluctuate given the complexity of now getting oil into the hands of customers. (H/t Gail - that report may only cover Chinese imports, since Bloomberg reports a different set of numbers, and an IEA estimate that Iran is averaging 1 mbd of exports this year.) India is hoping that the change in the Iranian Presidency will lead to an easing of sanctions. In the interim, the exemptions that China, India and Turkey are receiving to some of the sanctions have just been extended another six months. Part of this comes from the cuts those countries have already made. India, for example is now down to around 117 kbd around half that of a year ago.
Oil imports into China are reported to have increased, perhaps because the Chinese have just agreed to buy a number of Chinese drilling rigs. Total exports are projected to fall to 1.3 mbd over the current Iranian fiscal year (which started in March). If Iran is having to store more of its oil in off-shore tankers, this may explain the fall in regional tanker availability over the past month.
In a recent post I discussed my concern over the likelihood of Iraq being able to achieve the increased volumes of production within the time frame that their Central Government has suggested. However, as Leanan caught recently, Kurdish Iraq is moving more and more toward independent action in regards to their oil. From the Turkish side a pipeline will be allowed, that can go to the border, but not cross it. Mysteriously it will likely then fill, over time, with a flow of 1 mbd. Turkey is working with BP to develop the resources of Kurdish Iraq. In the interim Turkish demand has stabilized to a greater degree than it has in its southern neighbors.

Figure 4. Oil imports and consumption in Turkey (Energy Export Databrowser)
To a degree the instability is feeding off itself. Egypt continues to have problems in ensuring an adequate supply of fuel, and while Iraq and Libya have agreed to help, they prefer cash up front for the delivery, and that is proving to be a bone of contention. The country has reached the point where domestic production can no longer keep up with consumer demand, and these imports are going to become more critical to the budget, and, as a follow-on, national stability.

Figure 5. Change in oil consumption and the need for more imports for Egypt (Energy Export Databrowser)
The hope is that a pipeline can be built from Iraq, through Jordan, but that requires that a mutually acceptable line of credit be established, and that appears to be a problem. Egypt has the same soft-credit deal with Libya for a supply of a million barrels a month. The price, however, will be at that of the world market.
Unfortunately as the level of violence continues to grow one starts to get into an almost inevitable snowball effect, and there is a consequent negative impact on much industry, likely including that of oil production. The most likely consequence will be a further fall in the regional export of oil, which has a follow-on consequence in that the customers who have lost this supply (Japan has given up all Iranian oil for example) must then go onto the world market to find an alternate source of supply.
As those sources become even scarcer than they are already, marginal amounts of oil become more critical to maintaining a global balance. But such supplies don’t become available at the drop of a hat.
It seems to be a drum that I beat perhaps a bit often, but it is a message that bears repeating. Without significant and ongoing investment in the more difficult regions of the world, funds to identify the necessary availability of resource, and then to drill, in a timely manner, to prove the resource and start the process of turning it into a reserve, the oil balance cannot be sustained at a viable and acceptable price. It does not matter how glowing a set of reports are put out about how we can all relax because the world has plenty of oil in shale.
The largest of those resource sites is in Russia, where there may be as much as 75 billion barrels. But two things should be remembered. The first is that peak oil is reached, not when we run out of oil, but when we start producing less each year than in the previous. And the second is that getting much of the oil in the shale into the proven reserve category is going to take a fair amount of time, after which production rates, going from the results seen, for example, in the Bakken will decline at such a rate that a continued and expansive program of expensive drilling will be required to sustain production. And all this time the flow of oil from existing reservoirs will continue to fall.

Figure 6. A pretty wall hanging . (EIA)
Editorial Note: Because of one of those delightful family events that occur from time to time, this series will be on hiatus for a couple of weeks, since we will be traveling, when I would otherwise be writing.

Figure 1. Syrian oil production showing the recent fall in volume. (Energy Export Databrowser ).
As with most oil-producing nations oil consumption had, on the other hand, been steadily rising with net exports (some is exported as crude and re-imported as refined product) falling to around 100 kbd. The conflict has, however, also reduced internal consumption at similar rates earlier in the conflict.

Figure 2. Syrian production and consumption until 2011. (EIA )
At the same time that Syrian exports have sensibly disappeared, the exports from Iran have continued to fall. Data through the end of last year shows that sanctions continued to bite, with exports falling 31% last year.

Figure 3. Oil production, consumption and exports for Iran (Energy Export Databrowser)
Much of the oil from Iran goes to China, India and Turkey. In May 2013 the total exports are reported to have fallen to 700 kbd although individual monthly numbers fluctuate given the complexity of now getting oil into the hands of customers. (H/t Gail - that report may only cover Chinese imports, since Bloomberg reports a different set of numbers, and an IEA estimate that Iran is averaging 1 mbd of exports this year.) India is hoping that the change in the Iranian Presidency will lead to an easing of sanctions. In the interim, the exemptions that China, India and Turkey are receiving to some of the sanctions have just been extended another six months. Part of this comes from the cuts those countries have already made. India, for example is now down to around 117 kbd around half that of a year ago.
Oil imports into China are reported to have increased, perhaps because the Chinese have just agreed to buy a number of Chinese drilling rigs. Total exports are projected to fall to 1.3 mbd over the current Iranian fiscal year (which started in March). If Iran is having to store more of its oil in off-shore tankers, this may explain the fall in regional tanker availability over the past month.
In a recent post I discussed my concern over the likelihood of Iraq being able to achieve the increased volumes of production within the time frame that their Central Government has suggested. However, as Leanan caught recently, Kurdish Iraq is moving more and more toward independent action in regards to their oil. From the Turkish side a pipeline will be allowed, that can go to the border, but not cross it. Mysteriously it will likely then fill, over time, with a flow of 1 mbd. Turkey is working with BP to develop the resources of Kurdish Iraq. In the interim Turkish demand has stabilized to a greater degree than it has in its southern neighbors.

Figure 4. Oil imports and consumption in Turkey (Energy Export Databrowser)
To a degree the instability is feeding off itself. Egypt continues to have problems in ensuring an adequate supply of fuel, and while Iraq and Libya have agreed to help, they prefer cash up front for the delivery, and that is proving to be a bone of contention. The country has reached the point where domestic production can no longer keep up with consumer demand, and these imports are going to become more critical to the budget, and, as a follow-on, national stability.

Figure 5. Change in oil consumption and the need for more imports for Egypt (Energy Export Databrowser)
The hope is that a pipeline can be built from Iraq, through Jordan, but that requires that a mutually acceptable line of credit be established, and that appears to be a problem. Egypt has the same soft-credit deal with Libya for a supply of a million barrels a month. The price, however, will be at that of the world market.
Unfortunately as the level of violence continues to grow one starts to get into an almost inevitable snowball effect, and there is a consequent negative impact on much industry, likely including that of oil production. The most likely consequence will be a further fall in the regional export of oil, which has a follow-on consequence in that the customers who have lost this supply (Japan has given up all Iranian oil for example) must then go onto the world market to find an alternate source of supply.
As those sources become even scarcer than they are already, marginal amounts of oil become more critical to maintaining a global balance. But such supplies don’t become available at the drop of a hat.
It seems to be a drum that I beat perhaps a bit often, but it is a message that bears repeating. Without significant and ongoing investment in the more difficult regions of the world, funds to identify the necessary availability of resource, and then to drill, in a timely manner, to prove the resource and start the process of turning it into a reserve, the oil balance cannot be sustained at a viable and acceptable price. It does not matter how glowing a set of reports are put out about how we can all relax because the world has plenty of oil in shale.
The largest of those resource sites is in Russia, where there may be as much as 75 billion barrels. But two things should be remembered. The first is that peak oil is reached, not when we run out of oil, but when we start producing less each year than in the previous. And the second is that getting much of the oil in the shale into the proven reserve category is going to take a fair amount of time, after which production rates, going from the results seen, for example, in the Bakken will decline at such a rate that a continued and expansive program of expensive drilling will be required to sustain production. And all this time the flow of oil from existing reservoirs will continue to fall.

Figure 6. A pretty wall hanging . (EIA)
Editorial Note: Because of one of those delightful family events that occur from time to time, this series will be on hiatus for a couple of weeks, since we will be traveling, when I would otherwise be writing.
Read more!
Thursday, April 25, 2013
OGPSS - OPEC and EIA short term projections
Just this month Saudi Aramco announced that production had begun at their Manifa oilfield, and by July would be supplying up to 500 kbd to the new refinery that is being built at Jamail with the collaboration of Total. The first oil from the refinery is expected to ship in August, and both projects are currently ahead of schedule. Manifa will further increase in production next year, to 900 kbd, with the additional flow going to the Yanbu refinery being built with the collaboration of Sinopec. Both these refineries are designed to take heavy crude, and can also accept oil from the ongoing projects to expand production at Safaniya. Collectively this is said to ensure that the company will be able to achieve a maximum sustainable production of 12 mbd.
The gains in available reserves are required as the current production from Ghawar and the other major fields in the Kingdom continue to decline in production, as was discussed last year. I remain relatively convinced that Saudi Aramco will not increase their crude oil production above 10 mbd, despite the wishes and projections of others that they will end up doing so. By the time that their domestic consumption reaches the point that it lowers exports to a level that would hurt the KSA economy at current prices, the shortages globally will have raised the price sufficiently that the available production at that time will continue to suffice to meet their needs. (This is, however, a projection only for this decade).
This month’s OPEC Monthly Oil Market Report continues to anticipate a significant increase in available crude over the next three years, although this is indirectly recognized through the growth in crude distillation unit (CDU) capacity around the globe in that interval.

Figure 1. Increase in crude distillation capacity by regions in the near term. (OPEC April MOMR.)
Given that the world must increasingly deal with a heavier crude supply, the need for new refineries, as exemplified by the new Saudi construction, is evident. Increased demand to absorb this supply will come, in part, by an increase in the growth rate of the GDP of the BRIC nations, although the poor growth in the developed nations continues to hamper their export markets.
Overall demand is still anticipated to increase by around 0.8 mbd, with half of that coming from China and the rest of the non-OECD nations contributing an additional 0.7 mbd, offset by a decline in demand from the OECD nations of around 0.3 mbd, taking global demand, by the end of the year to nearly 91 mbd. Internal demand in the Middle East will continue to sap a fraction of this relative to exports. Overall the Middle East demand is anticipated to increase by 280 kbd, though the impact of the turbulence in various nations is hard to estimate.

Figure 2. OPEC estimate of global demand for 2013. (OPEC April MOMR.)
Virtually all the growth in supply is anticipated to come from North America, with a slight increase in production from South America coming from Colombia and Brazil. There is some concern, however, over the impact of attacks on the energy structure in Colombia.

Figure 3. Anticipated regional change in supply in 2013. (OPEC April MOMR.)
For the US the OPEC report has the following projection:
OPEC is anticipating that Norwegian production will fall 110 kbd this year, with a small decline of 40 kbd in UK production. OPEC expects that Russian production will increase to average 10.43 mbd in 2013, slightly down from first quarter numbers, while, in anticipation of Kashagan production, OPEC expects Kazakhstan to increase production to 1.67 mbd. The decline in production from the Azeri-Chirag-Guneshli field is expected to cause a slight ( 50 kbd) reduction in Azerbaijan production. There is, as previously, some difference between the production that the individual nations of OPEC report each month and that reported by secondary sources.

Figure 4. OPEC crude production from secondary sources.(OPEC April MOMR.)

Figure 5. OPEC crude production based on national direct reporting.(OPEC April MOMR.)
In short, over the course of this year OPEC remains relatively complacent that North American production gains will continue to meet the global demand, and that OPEC (i.e. largely the KSA) can back away from full production in order to balance supply and demand at a price level that keeps the OPEC bankers happy.
Back in March the EIA TWIP noted the change over the years, not only in amounts, but also in the sources of US imports, which remain significant. There has been quite a bit of change since 2005, when imports were at their highest level (10.1 mbd).

Figure 6. Change in the countries and volumes for the ten largest suppliers of crude to the USA. (EIA )
The EIA anticipates that US liquid fuels consumption will remain sensibly stable through the end of 2014, ending that year at 18.61 mbd. At this time production is expected to rise to 11.75 mbd.

Figure 7. EIA estimates of US liquid fuels production through 2014. ( EIA)
In that interval they anticipate that the price of gasoline in the United States will slowly decline. In contrast with the reports by the major oil companies that were discussed recently, these forecasts are short enough that it will be fairly quickly evident how accurate they are.
The gains in available reserves are required as the current production from Ghawar and the other major fields in the Kingdom continue to decline in production, as was discussed last year. I remain relatively convinced that Saudi Aramco will not increase their crude oil production above 10 mbd, despite the wishes and projections of others that they will end up doing so. By the time that their domestic consumption reaches the point that it lowers exports to a level that would hurt the KSA economy at current prices, the shortages globally will have raised the price sufficiently that the available production at that time will continue to suffice to meet their needs. (This is, however, a projection only for this decade).
This month’s OPEC Monthly Oil Market Report continues to anticipate a significant increase in available crude over the next three years, although this is indirectly recognized through the growth in crude distillation unit (CDU) capacity around the globe in that interval.

Figure 1. Increase in crude distillation capacity by regions in the near term. (OPEC April MOMR.)
Given that the world must increasingly deal with a heavier crude supply, the need for new refineries, as exemplified by the new Saudi construction, is evident. Increased demand to absorb this supply will come, in part, by an increase in the growth rate of the GDP of the BRIC nations, although the poor growth in the developed nations continues to hamper their export markets.
Overall demand is still anticipated to increase by around 0.8 mbd, with half of that coming from China and the rest of the non-OECD nations contributing an additional 0.7 mbd, offset by a decline in demand from the OECD nations of around 0.3 mbd, taking global demand, by the end of the year to nearly 91 mbd. Internal demand in the Middle East will continue to sap a fraction of this relative to exports. Overall the Middle East demand is anticipated to increase by 280 kbd, though the impact of the turbulence in various nations is hard to estimate.

Figure 2. OPEC estimate of global demand for 2013. (OPEC April MOMR.)
Virtually all the growth in supply is anticipated to come from North America, with a slight increase in production from South America coming from Colombia and Brazil. There is some concern, however, over the impact of attacks on the energy structure in Colombia.

Figure 3. Anticipated regional change in supply in 2013. (OPEC April MOMR.)
For the US the OPEC report has the following projection:
The expected growth in 2013 is supported by the anticipated supply increase from shale oil plays in North Dakota and Texas, as well as by minor growth from other areas in Oklahoma, Kansas, Colorado and Wyoming. The infrastructure situation is improving in North Dakota, with reports suggesting that the railroad loading capacity will reach 1 mb/d. Eagle Ford oil production in January continued to increase from the same period a year earlier. On a quarterly basis, US supply is expected to average 10.57 mb/d, 10.62 mb/d, 10.56 mb/d and 10.55 mb/d respectively.Canada is expected to reach a production total of 4 mbd by the end of the year, with the largest impact coming from the Kearl Oil Sands production anticipated to bring 110 kbd to market in the third quarter. (This is not dependent on the Keystone pipeline.) Mexico will see a slight decline in production though the Kambesah field (at 13.7 kbd) and increased production from Tsimin will offset most of that.
OPEC is anticipating that Norwegian production will fall 110 kbd this year, with a small decline of 40 kbd in UK production. OPEC expects that Russian production will increase to average 10.43 mbd in 2013, slightly down from first quarter numbers, while, in anticipation of Kashagan production, OPEC expects Kazakhstan to increase production to 1.67 mbd. The decline in production from the Azeri-Chirag-Guneshli field is expected to cause a slight ( 50 kbd) reduction in Azerbaijan production. There is, as previously, some difference between the production that the individual nations of OPEC report each month and that reported by secondary sources.

Figure 4. OPEC crude production from secondary sources.(OPEC April MOMR.)

Figure 5. OPEC crude production based on national direct reporting.(OPEC April MOMR.)
In short, over the course of this year OPEC remains relatively complacent that North American production gains will continue to meet the global demand, and that OPEC (i.e. largely the KSA) can back away from full production in order to balance supply and demand at a price level that keeps the OPEC bankers happy.
Back in March the EIA TWIP noted the change over the years, not only in amounts, but also in the sources of US imports, which remain significant. There has been quite a bit of change since 2005, when imports were at their highest level (10.1 mbd).

Figure 6. Change in the countries and volumes for the ten largest suppliers of crude to the USA. (EIA )
The EIA anticipates that US liquid fuels consumption will remain sensibly stable through the end of 2014, ending that year at 18.61 mbd. At this time production is expected to rise to 11.75 mbd.

Figure 7. EIA estimates of US liquid fuels production through 2014. ( EIA)
In that interval they anticipate that the price of gasoline in the United States will slowly decline. In contrast with the reports by the major oil companies that were discussed recently, these forecasts are short enough that it will be fairly quickly evident how accurate they are.
Read more!
Wednesday, April 17, 2013
OGPSS - The BP look into the future
So I suspect I should apologize. Here I am talking about the future projections for energy production that have been made by companies such as ExxonMobil and Shell, as though they were still the key and only players in the world. Yet, in reality, Saudi Aramco (12.5 mbdoe); Gazprom (9.7 mbdoe) and National Iranian Oil (6.4 mbdoe); appear in the list before ExxonMobil arrives (at 5.3 mbdoe), and then there is PetroChina (at 4.4 mbdoe) before BP arrives (at 4.1 mbdoe) and it is only then that we find Shell, which lies 7th at 3.9 mbdoe.
So the projections of the ExxonMobil’s of the world are of somewhat lesser value than they might, at one time, have been. (For those curious the list continues with Pemex (at 3.6 mbdoe); Chevron (at 3.5 mbdoe) and Kuwait Petroleum Co (3.2 mbdoe). This not only rounds out the top ten, it also closes out the list of those producing more than 3 mbdoe. (Abu Dhabi comes next at 2.9 mbdoe).
Yet, with those caveats, and recognizing that Saudi Arabia now produces only slightly less than ExxonMobil, Shell and BP combined, let me review the BP forecast, having already completed that for ExxonMobil and Shell. And while the latter two looked sufficiently far into the future as to obfuscate a little their shorter-term projections, BP is still focusing on the relatively short-term that runs to 2030.
Within that time frame BP expects overall energy demand to grow by 36%, though, as with the ExxonMobil projection, BP expects that a “tremendous increase” in energy efficiency will continue to develop, thereby slowing the need for future resources. They point out that, without this improvement in efficiency, global energy supply will need to double by 2030 in order to sustain economic growth.
This is particularly true for the United States, which BP sees approaching self-sufficiency in Energy, while it is the continued growth in demand from countries such as China and India and the Asian Pacific countries that provide most of additional need. Comparing their view from 2 years ago with the present there does not appear to be much change in the overall forecast. (Note that after the first two figures all the remainder come from the 2030 BP Energy Outlook).

Figure 1. Comparison of BP data and projections for population growth between their 2011 report (left) and that for 2013 (right)

Figure 2. Comparison of current and anticipated energy demand through 2030, from 2011 (left) and 2013 (right) BP reports.
There is a small increase in the overall demand from non-OECD countries in the more recent projection, but not a great difference. But this increase in demand reduces from a growth averaging 2.1% in the 2010-2020 time frame, to a growth of 1.3% in the following decade.
Within the period to 2030 BP anticipates that all major energy sources will continue to see an increase in overall energy production.
Figure 3. Growth in different energy sources through 2030
However, there is a change in the ranking of the different fossil fuels from the earlier projection. For while, two years ago, BP were projecting that coal, oil and natural gas would virtually tie in terms of market share by 2030, coal is now given a more dominant role, with natural gas falling below oil.

Figure 4. Change in market share for the different energy sources.
Coal is, within this time frame, not really bounded by available supply, though BP anticipate that more will be produced indigenously in the Asian Pacific than at present. Partly one assumes that this is necessary for financial reasons, although it will also be a need-based growth as the countries increasingly need electric power.
In terms of natural gas and oil supply questions are more urgent, and BP provide the following answer.

Figure 5. BP anticipated sources for the anticipated growth in demand for energy.
By far the largest production from the tight oil and gas shales will come from North America, where the current growth in production is anticipated to continue.

Figure 6. Anticipated production of tight oil and shale gas by region in 2030
One of the drivers that BP see, in the fall in oil demand, comes from its continued high price. This has already significantly lowered the use of oil as a power generating fuel, and the continued high price will drive the move to vehicles of increasingly greater efficiency. Thus, although global liquid fuel demand will continue to grow, it will only be at the rate of 0.8% pa, reaching 104 mbd by 2030. The sources to meet this are various:

Figure 7. Liquid fuel supplies through 2030
With the conventional supply of crude from non-OPEC countries diminishing, OPEC crude levels can be seen to increase over the next seventeen years, while the major increase in production from tight oils is anticipated to come from North America. In 2030 it will provide 9% of overall demand, providing almost half of the 16.1 mbd of overall increase in production. The increase will, however, slow post 2020, as the costs of production and the limits of the resource base. BP make the following prediction:
BP see roughly a 7% p.a. increase in shale gas production with most coming from the United States, Mexico and Canada. This will bring total natural gas production to 459 bcf/day by 2030. Of this North America will see a growth in production of 5.3% pa and by 2030 will be exporting roughly 8 bcf/d. In other countries the biggest growth will be in more conventional natural gas production, coming from the Middle East (31 bcf/d), Africa (15 bcf/d) and Russia (11 bcf/d).
This increase in supply, and the greater use of LNG tankers is likely to keep natural gas prices relatively stable.
So the projections of the ExxonMobil’s of the world are of somewhat lesser value than they might, at one time, have been. (For those curious the list continues with Pemex (at 3.6 mbdoe); Chevron (at 3.5 mbdoe) and Kuwait Petroleum Co (3.2 mbdoe). This not only rounds out the top ten, it also closes out the list of those producing more than 3 mbdoe. (Abu Dhabi comes next at 2.9 mbdoe).
Yet, with those caveats, and recognizing that Saudi Arabia now produces only slightly less than ExxonMobil, Shell and BP combined, let me review the BP forecast, having already completed that for ExxonMobil and Shell. And while the latter two looked sufficiently far into the future as to obfuscate a little their shorter-term projections, BP is still focusing on the relatively short-term that runs to 2030.
Within that time frame BP expects overall energy demand to grow by 36%, though, as with the ExxonMobil projection, BP expects that a “tremendous increase” in energy efficiency will continue to develop, thereby slowing the need for future resources. They point out that, without this improvement in efficiency, global energy supply will need to double by 2030 in order to sustain economic growth.
This is particularly true for the United States, which BP sees approaching self-sufficiency in Energy, while it is the continued growth in demand from countries such as China and India and the Asian Pacific countries that provide most of additional need. Comparing their view from 2 years ago with the present there does not appear to be much change in the overall forecast. (Note that after the first two figures all the remainder come from the 2030 BP Energy Outlook).

Figure 1. Comparison of BP data and projections for population growth between their 2011 report (left) and that for 2013 (right)

Figure 2. Comparison of current and anticipated energy demand through 2030, from 2011 (left) and 2013 (right) BP reports.
There is a small increase in the overall demand from non-OECD countries in the more recent projection, but not a great difference. But this increase in demand reduces from a growth averaging 2.1% in the 2010-2020 time frame, to a growth of 1.3% in the following decade.
Within the period to 2030 BP anticipates that all major energy sources will continue to see an increase in overall energy production.
The fastest growing fuels are renewables (including biofuels) with growth averaging 7.6% p.a. 2011-30. Nuclear (2.6% p.a.) and hydro (2.0% p.a.) both grow faster than total energy. Among fossil fuels, gas grows the fastest (2.0% p.a.), followed by coal (1.2% p.a.), and oil (0.8% p.a.).

Figure 3. Growth in different energy sources through 2030
However, there is a change in the ranking of the different fossil fuels from the earlier projection. For while, two years ago, BP were projecting that coal, oil and natural gas would virtually tie in terms of market share by 2030, coal is now given a more dominant role, with natural gas falling below oil.

Figure 4. Change in market share for the different energy sources.
Coal is, within this time frame, not really bounded by available supply, though BP anticipate that more will be produced indigenously in the Asian Pacific than at present. Partly one assumes that this is necessary for financial reasons, although it will also be a need-based growth as the countries increasingly need electric power.
In terms of natural gas and oil supply questions are more urgent, and BP provide the following answer.

Figure 5. BP anticipated sources for the anticipated growth in demand for energy.
By far the largest production from the tight oil and gas shales will come from North America, where the current growth in production is anticipated to continue.

Figure 6. Anticipated production of tight oil and shale gas by region in 2030
One of the drivers that BP see, in the fall in oil demand, comes from its continued high price. This has already significantly lowered the use of oil as a power generating fuel, and the continued high price will drive the move to vehicles of increasingly greater efficiency. Thus, although global liquid fuel demand will continue to grow, it will only be at the rate of 0.8% pa, reaching 104 mbd by 2030. The sources to meet this are various:

Figure 7. Liquid fuel supplies through 2030
With the conventional supply of crude from non-OPEC countries diminishing, OPEC crude levels can be seen to increase over the next seventeen years, while the major increase in production from tight oils is anticipated to come from North America. In 2030 it will provide 9% of overall demand, providing almost half of the 16.1 mbd of overall increase in production. The increase will, however, slow post 2020, as the costs of production and the limits of the resource base. BP make the following prediction:
The US will likely surpass Russia and Saudi Arabia in 2013 as the largest liquids producer in the world (crude and biofuels) due to tight oil and biofuels growth, but also due to expected OPEC production cuts. Russia will likely pass Saudi Arabia for the second slot in 2013 and hold that until 2023. Saudi Arabia regains the top oil producer slot by 2027.Other than tight oil, BP anticipates some increase in biofuel production, and from the oil sands, with significant increase in Iraqi production, and some gain from the remaining OPEC countries (one suspects Venezuela is included here) and from NGL production.
The largest increments of non-OPEC supply will come from the US (4.5 Mb/d), Canada (2.9 Mb/d), and Brazil (2.7 Mb/d), which offset declines in mature provinces such as Mexico and the North Sea. The largest increments of new OPEC supply will come from NGLs (2.5 Mb/d) and crude oil in Iraq (2.8 Mb/d).In this regard BP believes that currently OPEC has a spare capacity of around 6 mbd, but will continue to cut production to sustain prices over the decade.
BP see roughly a 7% p.a. increase in shale gas production with most coming from the United States, Mexico and Canada. This will bring total natural gas production to 459 bcf/day by 2030. Of this North America will see a growth in production of 5.3% pa and by 2030 will be exporting roughly 8 bcf/d. In other countries the biggest growth will be in more conventional natural gas production, coming from the Middle East (31 bcf/d), Africa (15 bcf/d) and Russia (11 bcf/d).
This increase in supply, and the greater use of LNG tankers is likely to keep natural gas prices relatively stable.
Read more!
Thursday, February 7, 2013
OGPSS - Future Bakken production and hydrofracking
Before there were refrigerators folks kept drinks cool by putting them into clay jars that had been soaked in water. The evaporation of the water from the clay cooled the container and its contents, which today includes wine bottles. On the other hand, for many years artisans have taken clay in a slightly different form, shaped it and baked it and provided the teacups which keep the liquid inside until we drink it.
Two different forms of the same basic geological material, with two different behaviors and uses. Why bring this up? Well there is a growing series of articles which continue to laud the volumes of oil and natural gas that the world can expect from the artificial fracturing of the layers of shale in which these hydrocarbons have been trapped for the past few million years. It has been suggested that there is no difference between this “unconventional” oil and the “conventional” oil that has been produced over the past century to power the global economy. And yet, despite the scientific detail which some of these critics discuss other issues, they seem unable to grasp the relatively simple geologic and temporal facts that make the reserves in such locations as the Marcellus Shale of Pennsylvania and the Bakken of North Dakota both unconventional and temporally transient. Let me therefore try again to explain why, despite the fact that the oil itself may be relatively similar, the recovery and economics of that oil are quite different from those involved in extracting conventional deposits.
But, before getting to that, let’s first look at the current situation in North Dakota, using the information from the Department of Mineral Resources (DMR). According to the January Director’s Cut the rig count in the state has varied from 188 in October, through 186 in November, and 184 in December, to 181 at the time of the report. Why is this number important? Well, as I will explain in more detail later, the decline rate of an individual well in the region is very high, and thus the industry has to continue to drill wells at a rapid rate, just to replace the decline. (This is the “Red Queen” scenario that Rune Likvern has explained so well.) The DMR recognize this by showing the effect of several different scenarios as the number of rigs changes.
For example they project that 170 rigs will be able to drill around 2,000 wells a year. At that level, and with some assumptions about the productivity of individual wells that I am not going to address here, but which Rune discussed. I would, however, suggest that it is irrational to expect that new wells will continue to sustain existing first year levels as the wells move away from formation sweet spots. Yet, accepting their assumptions for now, DMR project that the 170 rigs will generate the following production from the state:

Figure 1. Achieved and projected North Dakota production when 170 rigs are used to continue to develop the field into the foreseeable future. (ND DMR).
The DMR plot also assumes that the wells are developed and brought into production in a timely manner. In October the state produced an average of 749 kbd of oil, which was through mid-January the current peak level of production. Currently it is estimated to cost $2 million to frack a well, and in January there were 410 wells waiting on that service.
In order to reach a higher level of production (and bear in mind that OPEC has been projecting significant further increases in production to make their anticipated supply and demand levels balance) the DMR looked at estimates of production if there were 225-250 rigs, and contrasted that with what would happen if the rig count fell almost immediately to 60.
 Figure 2. North Dakota oil production with either 225-250 rigs, or with 60. (ND DMR)
Note that at 60 rigs the state production goes into an immediate decline. Somewhere in between those two extremes lies the likely future, but with the Director noting a December price of $77.09 that future may be at the lower, rather than higher end of the scale. (Though in January it popped back up to $87.25).
To illustrate the sensitivity of these numbers consider that if the rig count fell from 170 to 100, then production would decline to 800 kbd but would still fall into decline in 2020, while at 200 rigs the production would rise to a peak of 1 mbd, although the peak interval might only be four years from the 2,400 new wells added each year.
The ferocity of the decline rates of these wells is part of the reason that they are called unconventional, since they do not behave in the same manner as a conventional well, nor can they be developed in a similar way.
To return to the geology of the deposits (and shale is a consolidated clay) the middle Bakken formation is made up of a combination of layers of shale, sandstone, siltstone and limestone. These are, in general, rocks that have a very low permeability, and that property was explained in more detail in an earlier post. Simplistically it is a measure of how easy it is for fluid to flow through the rock, and for most of the Bakken rock it is not easy at all. If it were then there would be no need to put in the crack paths that the oil uses to reach the well. Let me repeat a figure from that post:

Figure 3. Block of sandstone with a crack in it (shown by the arrows).
I have been on a site where my hosts (a federal agency) had injected fluid that they were hoping would penetrate a layer of ground so that it would form an impermeable barrier. It had not, even though the ground was relatively easy for the fluid to penetrate. Instead it had all flowed into a crack no bigger than the one shown in the picture above, and the attempt was a failure.
Put that into reverse where you are trying to pull fluid out of the ground. There are two places where the fluid (oil or gas) is located, in the natural cracks and joints of the rock – which the hydrofrack is designed to cut across. And in the much lower permeability of the blocks of rock that are edged by these fractures, bedding planes and joints.

Figure 4. Representation of a horizontal well drilled in the Marcellus, shown against the natural fracture pattern (Source AAPG )
Over the millennia the oil/gas has migrated to those bedding planes and natural joints and fractures in the rock. When the well is first put in place it is that fluid that is more easily available to flow through the intersecting crack pattern to the well. But as those interstices empty out it is much more difficult to move the oil from the rock surrounding the natural cracks into that crack and thence to the well.
Most illustrations of hydraulic fracturing show a network of artificially induced cracks getting more numerous as they move away from the well. That, actually, is not the way it normally happens. The majority of the cracks that open are already there, and these are much easier to develop – as my unfortunate hosts learned – that it is to try and generate a multiplicity of new fractures, as I have previously explained here and here. The production, to go back to my initial metaphor, begins to move, over that first year of production, and dramatic fall in yield, from relying on the permeability of the wine cooler part of the rock, to that of the teacup.
Two different forms of the same basic geological material, with two different behaviors and uses. Why bring this up? Well there is a growing series of articles which continue to laud the volumes of oil and natural gas that the world can expect from the artificial fracturing of the layers of shale in which these hydrocarbons have been trapped for the past few million years. It has been suggested that there is no difference between this “unconventional” oil and the “conventional” oil that has been produced over the past century to power the global economy. And yet, despite the scientific detail which some of these critics discuss other issues, they seem unable to grasp the relatively simple geologic and temporal facts that make the reserves in such locations as the Marcellus Shale of Pennsylvania and the Bakken of North Dakota both unconventional and temporally transient. Let me therefore try again to explain why, despite the fact that the oil itself may be relatively similar, the recovery and economics of that oil are quite different from those involved in extracting conventional deposits.
But, before getting to that, let’s first look at the current situation in North Dakota, using the information from the Department of Mineral Resources (DMR). According to the January Director’s Cut the rig count in the state has varied from 188 in October, through 186 in November, and 184 in December, to 181 at the time of the report. Why is this number important? Well, as I will explain in more detail later, the decline rate of an individual well in the region is very high, and thus the industry has to continue to drill wells at a rapid rate, just to replace the decline. (This is the “Red Queen” scenario that Rune Likvern has explained so well.) The DMR recognize this by showing the effect of several different scenarios as the number of rigs changes.
For example they project that 170 rigs will be able to drill around 2,000 wells a year. At that level, and with some assumptions about the productivity of individual wells that I am not going to address here, but which Rune discussed. I would, however, suggest that it is irrational to expect that new wells will continue to sustain existing first year levels as the wells move away from formation sweet spots. Yet, accepting their assumptions for now, DMR project that the 170 rigs will generate the following production from the state:

Figure 1. Achieved and projected North Dakota production when 170 rigs are used to continue to develop the field into the foreseeable future. (ND DMR).
The DMR plot also assumes that the wells are developed and brought into production in a timely manner. In October the state produced an average of 749 kbd of oil, which was through mid-January the current peak level of production. Currently it is estimated to cost $2 million to frack a well, and in January there were 410 wells waiting on that service.
In order to reach a higher level of production (and bear in mind that OPEC has been projecting significant further increases in production to make their anticipated supply and demand levels balance) the DMR looked at estimates of production if there were 225-250 rigs, and contrasted that with what would happen if the rig count fell almost immediately to 60.

Note that at 60 rigs the state production goes into an immediate decline. Somewhere in between those two extremes lies the likely future, but with the Director noting a December price of $77.09 that future may be at the lower, rather than higher end of the scale. (Though in January it popped back up to $87.25).
To illustrate the sensitivity of these numbers consider that if the rig count fell from 170 to 100, then production would decline to 800 kbd but would still fall into decline in 2020, while at 200 rigs the production would rise to a peak of 1 mbd, although the peak interval might only be four years from the 2,400 new wells added each year.
The ferocity of the decline rates of these wells is part of the reason that they are called unconventional, since they do not behave in the same manner as a conventional well, nor can they be developed in a similar way.
To return to the geology of the deposits (and shale is a consolidated clay) the middle Bakken formation is made up of a combination of layers of shale, sandstone, siltstone and limestone. These are, in general, rocks that have a very low permeability, and that property was explained in more detail in an earlier post. Simplistically it is a measure of how easy it is for fluid to flow through the rock, and for most of the Bakken rock it is not easy at all. If it were then there would be no need to put in the crack paths that the oil uses to reach the well. Let me repeat a figure from that post:

Figure 3. Block of sandstone with a crack in it (shown by the arrows).
I have been on a site where my hosts (a federal agency) had injected fluid that they were hoping would penetrate a layer of ground so that it would form an impermeable barrier. It had not, even though the ground was relatively easy for the fluid to penetrate. Instead it had all flowed into a crack no bigger than the one shown in the picture above, and the attempt was a failure.
Put that into reverse where you are trying to pull fluid out of the ground. There are two places where the fluid (oil or gas) is located, in the natural cracks and joints of the rock – which the hydrofrack is designed to cut across. And in the much lower permeability of the blocks of rock that are edged by these fractures, bedding planes and joints.

Figure 4. Representation of a horizontal well drilled in the Marcellus, shown against the natural fracture pattern (Source AAPG )
Over the millennia the oil/gas has migrated to those bedding planes and natural joints and fractures in the rock. When the well is first put in place it is that fluid that is more easily available to flow through the intersecting crack pattern to the well. But as those interstices empty out it is much more difficult to move the oil from the rock surrounding the natural cracks into that crack and thence to the well.
Most illustrations of hydraulic fracturing show a network of artificially induced cracks getting more numerous as they move away from the well. That, actually, is not the way it normally happens. The majority of the cracks that open are already there, and these are much easier to develop – as my unfortunate hosts learned – that it is to try and generate a multiplicity of new fractures, as I have previously explained here and here. The production, to go back to my initial metaphor, begins to move, over that first year of production, and dramatic fall in yield, from relying on the permeability of the wine cooler part of the rock, to that of the teacup.
Read more!
Friday, September 28, 2012
OGPSS - An introduction to Iran
The theme of these posts, over the past eighteen months, has been to look at the leading producer nations that provide crude oil to the world, and see whether it is realistic to anticipate significant increases in their production. Posts have now looked at North America, Russia, Saudi Arabia and China based on the original list of rankings produced by the EIA in 2009. And, as I noted before beginning the China posts the interesting question at the moment relates to a) how much oil is Iran currently producing and b) how much, realistically, can it be expected to produce.
These are not questions with the same answer, since the current sanctions that have been imposed on the country have clearly already had an impact on the amount of oil that is being exported from Iran. Nevertheless the volumes produced have fallen below those now achieved by China, and for that reason China was given priority when it came to the order of writing these posts. But back at the beginning of 2011 there was no doubt that Iran was one of the top 5 producers (particularly if one combines the USA and Canada into the new “politically correct” term of North America as a way of dodging questions on long-term US production levels).
If one looks at the latest, September OPEC Monthly Oil Market Report (MOMR) for example, there is now a gap of 1 mbd between the official production claims, which are shown below, and the reports from other sources, which follow.

Figure 1. OPEC production reports, from the originating country (OPEC September MOMR )

Figure 2. OPEC production reports, as provided by secondary sources (OPEC September MOMR )
In passing it should be noted that OPEC is anticipating global oil demand to grow 0.9 mbd in 2012, and 0.8 mbd in 2013. To meet that OPEC anticipates that non-OPEC production gains will be 0.7 mbd in 2012, and 0.9 mbd in 2013, taking some of the pressure away from the OPEC producers. Within OPEC production, the gains from NGL’s are anticipated to further increase by 0.4 mbd in 2012, and 0.2 mbd in 2013. These figures again ease the need for OPEC to show increases in production to meet export demands, at the time that their internal consumption continues to rise.
Iran is thus, by the original criterion, the last of the Big Five to be looked at, although, in light of current production numbers it has clearly fallen into the second tier, and with current production below 3 mbd it joins others (Mexico and Veneuela, for example) who have fallen through from upper second tier into the lower second tier of nations that produce below 3 mbd, though this is likely transient, depending on how long sanctions last and, more critically, are effective.
If there is little likelihood of major increases in production from Russia, Saudi Arabia, and China, and that I take some of the optimism over North American production gains with a considerable grain of salt, then global increases in production must come from nations that are now producing below 3 mbd. With that size of an industry it is difficult to anticipate spectacular increases from a single producer. Rather individual country gains (with the exception of Iraq, which could increase production to 4 mbd) will likely only be perhaps on the order of 100 kbd. As a result, if global needs are to be satisfied, there has to be a whole series of overall gains in a multiplicity of countries. For it is only in this way that the total can combine to sustain the optimism of those who see a cornucopia of oil flooding our future through at least the next ten years.
That Iraq has moved into the second tier above 3 mbd this month (by both their own and other counts) makes it a separate point of discussion. But first there is Iran. And with President Mahmoud Ahmadinejad giving a more subdued speech before the UN this week as sanctions continue to bite, the role of crude in the Iranian economy may be becoming more evident to their government. Domestic consumption runs at about half of production, but the country needs the income from exports.

Figure 3. Iranian Oil statistics (Energy Export Databrowser )
Euan Mearns illustrated the range of Iranian oil facilities in his post last December prior to the embargo.

Figure 4. Iranian oil and gas fields and infrastructure (Euan Mearns at TOD)
Oil production in Iran has increased since the days in 2005 when, for a while, it appeared that the country had reached a point of declining oil production, and where natural gas injection was being debated as the possible answer. At that time as the debate over Iran “going nuclear” was beginning to build there was already a rationale for the development of nuclear power in the country.
Jump forward seven years and that debate is now at a much more intense level. The Israeli Prime Minister is seriously concerned over the development of nuclear weapons in Iran, as are other countries in the region, and around the world. The relative need for Iran to establish a nuclear-based electricity program, while used as a justification of the program by their government, has been largely neglected in the concern over the potential for weapons development. Sharing the largest gas field in the world (the South Pars: North Field) with Qatar, Iran has a resource that is being used at an increasing rate internally, with slight amounts being imported in the remote northern part of the country, where it is easier to use gas from abroad than to lay the delivery lines in country.

Figure 5. The South Pars: North Field Gas field shared by Iran and Qatar. (petroleum reports via The Encyclopedia of Earth)

Figure 6. Iranian natural gas statistics (statistics (Energy Export Databrowser )
And so, with the above as background, the next couple of posts will look at the Iranian situation in a little more detail.
These are not questions with the same answer, since the current sanctions that have been imposed on the country have clearly already had an impact on the amount of oil that is being exported from Iran. Nevertheless the volumes produced have fallen below those now achieved by China, and for that reason China was given priority when it came to the order of writing these posts. But back at the beginning of 2011 there was no doubt that Iran was one of the top 5 producers (particularly if one combines the USA and Canada into the new “politically correct” term of North America as a way of dodging questions on long-term US production levels).
If one looks at the latest, September OPEC Monthly Oil Market Report (MOMR) for example, there is now a gap of 1 mbd between the official production claims, which are shown below, and the reports from other sources, which follow.

Figure 1. OPEC production reports, from the originating country (OPEC September MOMR )

Figure 2. OPEC production reports, as provided by secondary sources (OPEC September MOMR )
In passing it should be noted that OPEC is anticipating global oil demand to grow 0.9 mbd in 2012, and 0.8 mbd in 2013. To meet that OPEC anticipates that non-OPEC production gains will be 0.7 mbd in 2012, and 0.9 mbd in 2013, taking some of the pressure away from the OPEC producers. Within OPEC production, the gains from NGL’s are anticipated to further increase by 0.4 mbd in 2012, and 0.2 mbd in 2013. These figures again ease the need for OPEC to show increases in production to meet export demands, at the time that their internal consumption continues to rise.
Iran is thus, by the original criterion, the last of the Big Five to be looked at, although, in light of current production numbers it has clearly fallen into the second tier, and with current production below 3 mbd it joins others (Mexico and Veneuela, for example) who have fallen through from upper second tier into the lower second tier of nations that produce below 3 mbd, though this is likely transient, depending on how long sanctions last and, more critically, are effective.
If there is little likelihood of major increases in production from Russia, Saudi Arabia, and China, and that I take some of the optimism over North American production gains with a considerable grain of salt, then global increases in production must come from nations that are now producing below 3 mbd. With that size of an industry it is difficult to anticipate spectacular increases from a single producer. Rather individual country gains (with the exception of Iraq, which could increase production to 4 mbd) will likely only be perhaps on the order of 100 kbd. As a result, if global needs are to be satisfied, there has to be a whole series of overall gains in a multiplicity of countries. For it is only in this way that the total can combine to sustain the optimism of those who see a cornucopia of oil flooding our future through at least the next ten years.
That Iraq has moved into the second tier above 3 mbd this month (by both their own and other counts) makes it a separate point of discussion. But first there is Iran. And with President Mahmoud Ahmadinejad giving a more subdued speech before the UN this week as sanctions continue to bite, the role of crude in the Iranian economy may be becoming more evident to their government. Domestic consumption runs at about half of production, but the country needs the income from exports.

Figure 3. Iranian Oil statistics (Energy Export Databrowser )
Euan Mearns illustrated the range of Iranian oil facilities in his post last December prior to the embargo.

Figure 4. Iranian oil and gas fields and infrastructure (Euan Mearns at TOD)
Oil production in Iran has increased since the days in 2005 when, for a while, it appeared that the country had reached a point of declining oil production, and where natural gas injection was being debated as the possible answer. At that time as the debate over Iran “going nuclear” was beginning to build there was already a rationale for the development of nuclear power in the country.
Jump forward seven years and that debate is now at a much more intense level. The Israeli Prime Minister is seriously concerned over the development of nuclear weapons in Iran, as are other countries in the region, and around the world. The relative need for Iran to establish a nuclear-based electricity program, while used as a justification of the program by their government, has been largely neglected in the concern over the potential for weapons development. Sharing the largest gas field in the world (the South Pars: North Field) with Qatar, Iran has a resource that is being used at an increasing rate internally, with slight amounts being imported in the remote northern part of the country, where it is easier to use gas from abroad than to lay the delivery lines in country.

Figure 5. The South Pars: North Field Gas field shared by Iran and Qatar. (petroleum reports via The Encyclopedia of Earth)

Figure 6. Iranian natural gas statistics (statistics (Energy Export Databrowser )
And so, with the above as background, the next couple of posts will look at the Iranian situation in a little more detail.
Read more!
Subscribe to:
Posts (Atom)

 Posts
Posts


