Showing posts with label Brazil. Show all posts
Monday, January 20, 2014
Tech Talk - Production, Profit and Projection
As we move steadily through the first month of this new year, US production of crude has continued to increase, with the EIA now showing levels of around 8.2 mbd production.
Figure 1. US Domestic Crude production through the end of 2013 (EIA TWIP)
Finished gasoline production has been floating around a level of 9.2 mbd.
Figure 2. U.S. Finished gasoline production at the end of 2013. (EIA TWIP)
At the same time ethanol production continues at around 0.9 mbd.
Figure 3. U.S. Ethanol production at the end of 2013 (EIA TWIP)
US gasoline demand, on the other hand, has fallen below 9 mbd, in the normal seasonal decline during the winter months.
Figure 4. US gasoline demand at the end of 2013. (EIA TWIP)
In the latest Director’s Cut of the news from the North Dakota Department of Mineral Resources the state reports that production averaged 973 kbd in November, up from 945 kbd in October). The rig count is running around 190 rigs (below the all time high of 218 – roughly 18-months ago) and the agency notes that companies are moving toward a higher density for horizontal wells as a means of enhancing oil recovery. They estimate that at the current rig count there will be enough work under this program to sustain the industry for more than 20-years. However production will decline as the richer spots are drained, and in the most favorable scenario production will rise for another 2 to 3 years before stabilizing and then declining. At present the rate of growth in production is in the range of 300 kbd per year.
Figure 5. North Dakota Oil Production – historical and projected (ND Dept of Mineral Resources )
This is roughly similar to the growth in production from the Eagle Ford Shale in Texas over the past year.
Figure 6. Changes in production from the Eagle Ford Shale in Texas (Texas Railroad Commission )
Growth in production from the deep waters of the Gulf are likely to be closer to 50 kbd. Even combined, and recognizing that there may be some additional production from developing shale prospects, it is difficult, as the above three regions hit production peaks in the near future, to anticipate that US production will increase by the 2 mbd that is projected by some forecasts.
Some of this doubt comes from North Dakota agency itself, which has some concerns over the continued ability of the industry to attract drilling capital, as well as the impact of additional regulations. This limit of available funds is something that Gail Tverberg has pointed out in a recent post. Shell is only one of the major companies recognizing that the increasing costs of development in more difficult parts of the world are not being offset by compensating increases in production, price and profit. As operations around the world continue to attest, (offshore Brazil being but one example) just because the money is invested does not mean that production will of a certainty arrive on the original date forecast, nor will it be at the original price estimated. In the case of Brazil, while new fields show the promise for the future with a steady increase in the reserves that the country projects, this has yet to be reflected in increased production.
Figure 7. Growth in projected reserves offshore Brazil over the past 30 years (Offshore )
The problems of development are being blamed on a lack of available drilling rigs as well as budget constraints. This may be a considerably simplified version of the realities which are likely to continue to see delays in production against target figures into the medium term future. This is unfortunate since there remain few places where global production can be expected to increase in the near future.
In the latest Monthly Oil Market Report (MOMR) OPEC notes that non-OPEC supply growth is anticipated to be 1.2 mbd this year, with the bulk of that growth coming from the United States, Canada, Brazil and the two Sudans. Oil production from the Canadian oil sands is anticipated to reach 3 mbd by 2015 on its way to a total production estimate of around 6 mbd by 2035, at an approximate growth rate of 100 kbd per year.
Figure 8. Anticipated growth in Canadian oil production (NEB )
Perhaps more than most the Canadian growth is likely to follow the projected path, although there, as in other parts of the world, the need to ensure future capital for the increasingly expensive operations, and the provision of sufficient infrastructure to handle the increased production are matters that will continue to provide caveats to the overall levels achieved.
And as regards the increase in production from Sudan and South Sudan, certainly the conditions in South Sudan are not encouraging to hopes for increased production at any time in the near future. Fighting in the regional capital of Malakal shows the increasingly tribal nature of the conflict and this may well indicate that fighting will not easily be stopped and order (let alone oil flow) restored. This is of concern to China, which imported some 14 million barrels of oil from the region in 2013 but is now faced with the problems of sustained investment in the face of lost production and facilities after seeing a similar collapse in production from Libya. And while these problems are considered relatively small at the moment, at this time when global production and supply are relatively closely tied, the continuation of problems will mean the China must look elsewhere for that production, with consequent impacts on overall prices.
The problem, as the very short list from OPEC illustrates, is that there are not that many places around the world where increased production is likely and where China can invest to achieve the levels that it anticipates that it will need as demand continues to grow. And as the market becomes more competitive, so prices are unlikely to decline much (apart from regional short term issues such as the recent desire in the US to produce more diesel from refineries). Yet while this will give some reassurance to those seeking to invest capital in the industry it comes at a time where there remain concerns over regulation in some countries, and conflicts in others both of which cause investors to hesitate in their commitment. The problem is that there aren’t that many alternative strategies that hold much hope for working.
Read more!
Tuesday, December 17, 2013
Tech Talk - The IEA World Energy Outlook
It is the time of year again that different folk stare into their own versions of a crystal ball and project how much energy the world will need in the future, and where they think that it will come from. It is interesting to look at these various predictions as the global supply picture morphs under a changing reality.
One of the changes in reality that is likely to have significant impact in the near-term is the flow in the Alyeska pipeline. Long-time concerns over the decline in flow and the effect that heat loss has on the contents is leading to new work to change the pipe dynamics and possibly to remove the water before it is pumped, lowering the temperatures at which the line currently has to be maintained.
Figure 1. Historic and Projected flows through the Alaskan pipeline (Alyseka)
The precipitation of ice and water from the oil, within the pipeline will otherwise reach a point that flow will stop – potentially at around 300 kbd, at a date not too far into the future.
In their annual World Energy Outlook, the IEA continue to see, overall, a gain in US oil production through 2025, largely coming through the light tight oil of the sort being produced from North Dakota and West Texas.
Figure 2. IEA projections for global oil production growth in the years to 2035. (IEA)
However in the following years , out to 2035, that supply also declines so that by 2035 the US will likely be in the same sort of supply situation, relying heavily on imports, that it is today.
The IEA make the point that the only longer term places that can be relied on are Brazil, with the off-shore fields, and the Middle East. Looking first at Brazil, which continues to have some problems in bringing their fields on-line on-schedule, the IEA anticipates that the major production growth is likely to be in the next ten years, but will continue beyond that point.
Figure 3. Brazilian oil production through 2035. (IEA)
Because the IEA foresee that Brazil will continue to supply the largest portion of its energy from hydropower this means that the largest volume of the fuel can be exported, where it meets the continually growing demand from the rest of the world.
Figure 4. Anticipates sources of power for electricity generation in 2035 (IEA)
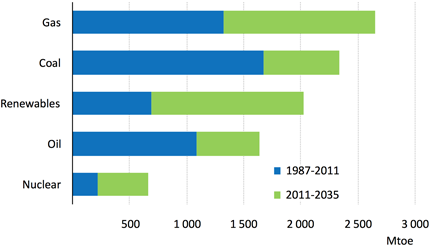
At the same time the IEA anticipate that primary energy demand will still focus heavily on fossil fuel sources through 2035, with renewable energy only slowly nibbling away at the totals so that, by 2035 fossil fuel will have dropped from contributing the current 82% down to 75% of the larger total.
Figure 5. Anticipated changes in the sources of primary global energy through 2035. (IEA)
Although, by that time the IEA foresee a change not only in the places where demand is highest, but also in the relative rankings. The major finding in this regard that they draw attention to is the anticipated greater growth rates in India than in China, as time passes.
Figure 6. Changed picture of global energy demand in the year 2035 (IEA)
Other than projecting the growth in demand there is the need to anticipate where the supply will come from, and in this regard the IEA projects that the largest growth will come from natural gas (Figure 5), although crude oil is still anticipated to grow, with refinery capacity increasing to about 104 mbd.
It is interesting that the IEA projections for oil production growth hang most heavily on increased production from the Middle East. It requires very little glance into their crystal ball to assume that this is likely based on the increased production from Iraq, an assumption that was, last year, a largely common assumption to all future projections. Unfortunately for those earlier projections in the interim the initial Iraqi targets have been cut back, with current targets being reduced below the “best case” scenario that the IEA had projected in their review of the country.
Taken with the possibility of a significant and sudden decline in production from Alaska, and the likelihood that the rate of drilling in the Bakken will decline, as prospects become more uneconomic suggests that it will be difficult to sustain the levels of crude output that the IEA are anticipating can be made available to meet their projected needs.
By the same token the growth in the global demand for natural gas is predicated on the reserves uncovered in the United States being exported, as needed, to the rest of the world. It is, however, also predicated on the price of natural gas remaining relatively stable in terms of current costs.
Figure 7. Anticipated components of the costs of US LNG when shipped to either Asia or Europe (IEA)
The underlying flaw in that assumption is that the costs of purchasing the natural gas in the United States are now starting to rise to a more realistic level relative to the costs of production from tight shales. This week's OGJ, for example has noted the EIA Short Term Energy and Winter Fuels outlook that notes that prices are expected to rise 13% this winter over last (on constant demand) to $3.62 per kcf. Given that the EIA is expecting the price to inch upwards towards $5.00 per kcf over the next year this makes the IEA report appear a little over-optimistic on costs and hence market share.
Figure 8. Natural Gas Prices in the United States (EIA)
This is likely to be particularly true as some of the older gas fields, such as the Haynesville, appear to be in decline even at prices in the $4 - $5 per kcf range.
Figure 9. Natural Gas Production from the Haynesville Shale (OGJ )
Increasing the price of natural gas will reduce its competitive advantage over coal and in consequence I would anticipate that power generating companies will continue to build boilers that can handle both coal and natural gas, and that the longer-term continued switch to natural gas will become more of an economic choice dependent on how much LNG finally comes onto the market from the United States and at what price. I am not convinced that this will be quite the bargain and cornucopia that it is anticipated to become. In other words I still find the IEA view of the future to be a somewhat optimistic one, given the realities that are now unfolding before us.
Read more!
Labels:
Alaska pipeline,
Brazil,
China,
global demand,
Haynesville shale,
IEA,
India,
Iraq,
Natural gas,
World Energy Outlook
Sunday, September 29, 2013
Tech Talk - Iran and a slight cough toward CNN
There has been considerable comment this week over the telephone call between President Obama and the President Rouhani of Iran. Certainly the election of a new President in Iran gives the opportunity for a fresh start, particularly given the belligerent attitudes of his predecessor. However the cynical side of me does wonder if there is more driving this than simply the change of personalities.
There are two points that need to be considered, as a possible new relationship between the two countries might slowly coalesce out of the mists of diplomatic effort. Firstly the major driver seen in moving Iran toward a more positive position is said to be the increasing bite that sanctions, and particularly oil sanctions, are having on their economy. As sanctions have tightened, so Iranian oil production has fallen, with reports suggesting that oil exports have fallen from 2.2 mbd to May’s value of 0.7 mbd. The reduction in income that this has had on the Iranian economy is significant, with the currency officially devalued to half, though the effect has been more of an 80% fall from peak, as inflation has reached 42%.
Easing sanctions to allow more oil flow would significantly improve the situation, although there is concern, expressed for example at CNN, that the increase in oil flow would weaken the positions of the Kingdom of Saudi Arabia and Iraq. They suggest that the advent of Iranian oil (presuming that they can bring 1.5 mbd to the market relatively quickly) is foreseen as having a potential impact on the United States in that it may, at least transiently, produce a glut in the market. That would drive down prices, until such time as KSA could drop production and bring the supply and demand back into balance, raising prices back to around $100.
In a peaceful world such a scenario might have some viability, but consider what is really happening in the world of global supply. Instead of the KSA moving toward a supply of 12.5 mbd (which was only a capacity number in the first place) they have backed this down to 12 mbd and have talked recently as lowering that number further as they hire more and more rigs to help sustain existing production at just under 10 mbd. Iraq, which was promising to rapidly increase production toward a target of 11 mbd, is instead considered by the IEA likely to reach no more than 6 mbd by 2020. Further with the ongoing increase in violence in the country being able to sustain current production at around 3 mbd and increase it beyond 3.5 mbd as the Majnoon field comes on line. However Shell’s target for the field is already below initial estimates for this year, and it is discussing lowering the 2017 target from 1.8 mbd to 1.0 mbd. There has recently been an outbreak of violence in Kurdistan, which might portend that even in this relatively stable part of the country oil production and security is becoming a greater target.
These events suggest that future increases in production from around the region are not as assured as one might hope. At the same time, while there are those who continue to expect the United States to become oil-independent in the next few years, the reality is somewhat different, and further increases in production much above current figures become more difficult to justify. If Russia, similarly, is unlikely to increase production – which it is not – then the questions that should be asked are rather where is the world going to get the additional 1 mbd that it requires every year to balance increasing demand against supply.
Over the course of this year Saudi Arabia has had to increase production from 9.1 to 9.96 mbd to keep supply in balance, and prices stable. At the same time production from Libya, which has run at around 1.6 mbd had fallen to 150 kbd at the beginning of this month. Hopes that this could be increased back up to 700 kbd rely on tribal militias that control strategic parts of the country, and their long term co-operation is dubious, while the fields and pipelines in the east remain shut down. It seems reasonable to anticipate that there will be at least a million barrels a day of Libyan production held off the market for some time.
If one goes around the world one sees that Brazilian promises of production increase are behind schedule, as are promises of production increases from countries such as Veneuela. And suddenly one is left with not much in the way of places left to balance off the current declines in supply and increases in demand.
At this point that 1.5 mbd of potential supply from Iran starts to look a little more promising as an answer. It might allow KSA to ease back on production levels that might be starting to impose a little strain on their infrastructure. It would help to provide balance if production increases around the world fail to show on time. One should recognize that negotiations to bring Iran back into the fold are going to take at least a year or two before it is realistic to anticipate full return to supply, but even the easing of sanctions a little might cause the flow to China, India and Asia to increase to meet the burgeoning demands that they have, and oil is still to some degree fungible.
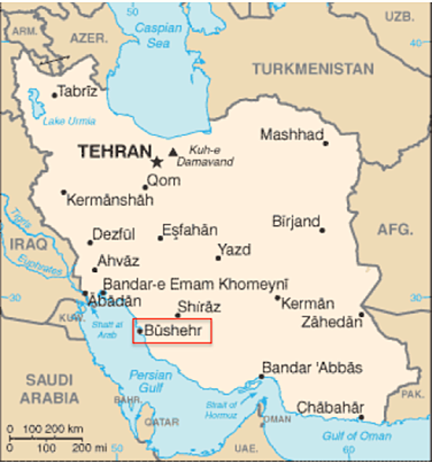
But in that regard, Iran has also just recently reached 100% output from the first of the nuclear power stations at Bushehr and is about to start construction of the second unit. Nuclear fuel will be provided by Russia, and spent fuel returned to Russia. It is a 1,000-megawatt unit, and since the unit was built under supervision by the International Atomic Energy Agency it is not subject to sanctions.
Figure 1. Bushehr Nuclear Plant
If the protocols that worked to make this happen can be expanded, then it is possible that, though negotiation, the tension in the region can be eased. This could well have benefits all around, most particularly for ensuring that, for at least a sadly few more years, there will be enough oil on the market to meet demand at a reasonable price.
Figure 2. Location of the Bushehr Plant
Read more!
Labels:
Brazil,
Bushehr nuclear plant,
China,
CNN,
crude oil production,
Iran,
Iraq,
KSA,
Libya,
Majnoon,
oil demand,
Russia
Wednesday, September 25, 2013
Tech Talk - The Rise and Fall and . . . . of Brazil
Brazil seems to be appearing in the news a little more regularly these days. Whether it is because the President objects to NSA activities or because Unilever is buying 3 million gallons of algae-produced oil from Solazyme, to be produced at a new plant in Brazil that will generate 30 million gallons a year, the emphasis has switched from a focus on their growing oil and ethanol economy, perhaps because it has stopped growing.
Back when The Oil Drum first started (where the last post has now gone up) one of the earliest posts noted that Petrobras was seeing a 14% increase in production, as they reached 1.82 mbd, back in May 2005. This was at the time that discoveries were being made offshore in what is now known as the Pre-salt deposits.
Figure 1. Nature of the offshore deposits that are being developed from under the Salt Layer. (Seeking Alpha )
Part of the problem with the development of these deposits comes from where they are and what they are. Rock salt is one of those materials that will flow under pressure. (One of the more interesting examples of this is in the Polish salt mine at Wielicza where old mining tools were found encased in salt in a region of the mine that was thought to have never been worked.) This poses some problems with drilling – although these are now relatively well understood. The other problem is that the reservoir rocks under the salt are recognized to be very weak, which makes it more difficult to drill long lateral holes, and keep them open. (The genesis of the basin has been described by Schlumberger).
Note: this post has been updated to include the new discovery in the SEAL-11 area.
Exploration first found the Espirito Santo, Campos and Santos basins and this was followed, in 2006, by the Tupi province which held the promise, at the time of discovery, of producing 8 billion barrels of light oil and natural gas.
Figure 2. The initial Tupi discoveries offshore Brazil (Offshore Technology )
Because of the location offshore the oil and natural gas would be recovered using a Floating Production Storage and Offloading unit (FPSO) and the first of these to be dedicated to the site was contracted in 2009, the first crude being produced in May, 2009. An earlier FPSO, the Cidade de Sao Vincente, was already in use as a test platform for the field. At the same time further development showed that three offshore fields (Tupi, Iara and Guara) held the potential to supply up to 40 Tcf of natural gas. Guara was discovered in 2008, and was initially anticipated to have 1-2 billion boe potentially available. Iara was also discovered in 2008, and holds a potential 3-4 billion barrels of light oil and natural gas. By the end of 2010 the collective potential for the three fields was estimated at 10.8 billion boe.
Figure 3. The development blocks around Tupi (Rigzone )
A second FPSO was ordered in June of 2010 with a capacity of 120 kbd of oil, and 5 mcf of natural gas. Initial production from the first FPSO, the Cidade de Angra dos Reis, began in October 2010 with a target of 100,000 bd, and an additional eight FPSO’s were ordered in November of that year, increasing capacity by up to 150 kbd each, although collectively they are anticipated to reach maximum production in 2017 at 900 kbd.
At the end of 2010 the Tupi development had been renamed as the Lula field, in honor of the retiring President, and two more FPSO’s were chartered to increase production by another 150 kbd each, from the fields of the region. By May the first well connected to the FPSO Cidade do Angra dos Reis was producing over 28 kbd as the first of six wells connected to the platform.
As the development of the platforms to commercial production became closer Petrobras also commissioned the construction of 2 more FPSO’s, noting that these would be able to inject some 200 kbd of water back into the formations, in order to assist with production and the maintenance of pressure.
By June of this year the first production was received on the Cidade de Paraty a third FPSO, although only at 13 kbd, rather than the target 25 kbd as the vessel and support structure was still in process. The platform will ultimately receive oil and gas from 7 production wells (for a total capacity of 120 kbd) while feeding water back through 6 injection wells.
The potential is thus evident for Brazil to become a significant producer to meet not only their domestic demand, but also to start exporting oil and natural gas, given the potential for these offshore fields. But, to date, this promise has yet to be fulfilled. Ron Patterson has been plotting production and I have taken this plot from his site.
Figure 4. Production of crude and condensate from Brazil (Ron Patterson )
As I noted last time, the EIA had been projecting that Brazil would be producing up to 2.8 mbd by the start of this year, rising to 3.0 mbd at the end of the year. The OPEC MOMR suggests that they will only make 2.67 mbd by the end of this year, but at the above chart shows, that would still be a considerable improvement, and reverse the drop.
The gain is anticipated to come from the FPSO Pappa Terra, which is the renamed Nisa, and which will be moored at the Pappa Terra field. This is in the Campos Basin, and is a heavy crude (API 14 – 17 degrees) with the potential to yield 380 million barrels.
Figure 5. Location of the Pappa Terra Field (Offshore Technology )
The vessel left China at the end of last year, and was completed in Brazil before sailing to the field in June.
Figure 6. The Pappa Terra FPSO (Shipbuilding Tribune )
On the other hand Brazilian production of ethanol had gone up by 6%.
UPDATE: Just after I had finished writing this Reuters carried a story which they had pieced together from other reports, and which indicates that Petrobras and an Indian partner have found a new large field of light crude about 1,000 miles north of the developments in the Lula area. The new discoveries have the advantage of not being covered with the salt layer, and so will be easier to develop. Currently production is anticipated for 2018.
Figure 7. Location of the new field off the coast of Brazil. (Energy-pedia)
There are a number of different development wells being drilled in the region, and they have found sufficient success to allow their results to be congregated into a field with a potential reservoir of 3 billion barrels of light oil. of which perhaps 1 billion will be produced.
Figure 8. The drilling blocks in the Sergipe Basin. (Petrobras) ,
Read more!
Sunday, September 15, 2013
Tech Talk - changes in South American exports
One of the large concerns that came up repeatedly over the years of discussions, both of the articles and of Drumbeat at The Oil Drum (TOD) was the subject of growth in domestic demand from some of the larger suppliers of oil and natural gas. This growth would be to the cost of the export market, and will, therefore, over time, reduce the amount available to importing nations. This becomes an even more painful reality to the rest of the world when the projections about future performance turn out to have been overly ambitious. Consider the countries of Latin America, where, back in 2010, the EIA drew the following baseline:
Figure 1. The largest producers of liquid fuels in South America in 2010 (EIA )
The EIA anticipated that Brazilian production would reach 2.8 mbd in 2012, and 3.0 mbd this year. However, as the latest MOMR from OPEC notes, Brazil will likely produce only 2.61 mbd this year, with the potential to rise to 2.67 mbd by the end of the year. However the rise in domestic consumption, and the failure to achieve the production goals expected has had an impact on the exports to the United States.
Figure 2. The changing volumes of US imports from Brazil (EIA )
The EIA reported that Venezuela produced some 2.47 million barrels a day in 2011, of which the USA imported roughly 1 mbd. That volume has, however, been declining for some time. (Note that in the plot below the Virgin Island imports should perhaps be included, because the crude that runs through the refineries on the islands originates in Venezuela, but they are not in this plot). At the same time a significant proportion (250 kbd in 2010) is now being shipped from Venezuela to China.
Figure 3. The changing picture of US imports from Venezuela over the years (EIA )
The situation in Argentina similarly shows that as with the other countries internal consumption is rising, while in this case overall production is falling and there is a consequent impact on exports.
Figure 4. The oil balance in Argentina (EIA )
China has been getting around 20% of Argentinian exports, while, in 2011, the USA got 40%, but the volumes of US imports have now turned negative.
Figure 5. The changing picture of oil imports to the USA from Argentina (EIA )
Of the five countries that were tabulated at the top of the post, Colombia is the exception. Production is still rising significantly, however it should be noted that, back in 2010 when the USA received some 422 kbd of crude and refined products from the country, China was financing a pipeline to carry 600 kbd to the Colombian Pacific Coast.
Figure 6. The increase in oil production with little increase in domestic production in Colombia (EIA )
The oil for the pipeline is anticipated to come from both Venezuela and Colombia, and the preliminary agreement for its construction was signed in May, 2012. Venezuelan agreement is still lacking to the deal and Venezuela, which was supposed by now to be sending natural gas to Colombia (after having received supplies for years) has still not made the switch. Volumes of exports to the USA from Colombia have fluctuated recently, while India and China have been acquiring oil wells and their production, which then ships to Asia.
Figure 7. The changing picture of oil exports to the USA from Colombia (EIA).
And that leaves Ecuador., which for those who might have forgotten, is also a member of OPEC. (It rejoined in 2007 ) It produces around 500 kbd, and with internal consumption running at around 200 kbd, exports the rest.
Figure 8. The changing picture of oil exports to the USA from Ecuador (EIA )
The recent news that the President of Ecuador is opening the rain forest to oil development, after trying to find funds for preservation of the forest without it and failing. Ecuador has an increasing debt with China (about $20 billion) and this is forcing it to use oil exports as a way of servicing that debt. One $2 billion loan, for example, carries a return agreement for some 130 million barrels of oil over six-years (60 kbd). Part of the loan from China will be spent on refineries in country.
The point to note in all five cases is that the imports to the United States have been declining. Given the increase in US domestic production that is not wholly surprising, nor is there yet any immediate cause for concern. But it is what is happening to whatever excess that these countries produce, over that consumed domestically and in the US that is significant. Because, increasingly it is going to China, and to Asia in general.
The concern that this raises is that, should US production not continue to rise at the rates that the more cornucopian of the main stream commentators suggest, then there will come a time when the US will have to go back to its suppliers from the last decade to ask for more. And at that time the odds are going to be high that either the countries won’t be able to meet the demand because their own domestic consumption has consumed the surplus, or that the surplus has been sold to China.
Given that China is making investments at the moment in the South American oil infrastructure, from wells to pipelines, means that it will control this production, and that removes a significant source of supply, at a time when it will be needed.
Read more!
Labels:
Argentina,
Brazil,
China,
Colombia,
domestic consumption,
Ecuador,
Export Land Model,
US oil imports,
Venezuela
Monday, August 26, 2013
Tech Talk - A Dickensian Situation revisited
Back in March 2005 I posted my first offering to the new site that Kyle and I had agreed to call “The Oil Drum.” Now, some eight years later, this will be my final Tech Talk to appear on that site, and it is perhaps appropriate to go back to that first post, and make a couple of comments on how it panned out. It read as follows:
Figure 1. Changes in liquid supply sources from 2000 to 2040 as anticipated by Exxon Mobil, with lines added to show 2005 and 2013. (The Outlook for Energy: A view to 2040)
I have added lines to show the situation in 2005, when the piece was written, and for this year. It is worth noting that, using the definitions that Exxon Mobil give, conventional crude and condensate production has, indeed, declined since I wrote those words. And if one includes Oil Sand and Deepwater then production has remained fairly stable at the levels back in 2005, and will (according to EM) likely stay so into the projected future.
The three sources that I had underestimated, in terms of production growth were in Biofuels (which is now at around 2 mbd), the growth in Natural Gas Liquids (which for OPEC alone is now projected to reach 6 mbd by next year up from around 3 mbd in 2005, and the growth in tight oil. This latter development, particularly with the use of long horizontal wells that are artificially fractured and injected with a slick-water suspension of a proppant, has been very successful in developing resources which were otherwise at best marginally economic. However the relative contribution that this is expected to make in overall supply is not that great, and I expect that, because of the high decline rates in individual wells, that this will only contribute on the margin of the problem.
When I began writing at The Oil Drum I was concerned that there was a lack of understanding of the impact that reservoir decline rates would have on long-term supply. As larger fields are depleted, so the world turns to smaller fields and these drain more rapidly, so that more and more are needed. (The Red Queen situation that Rune Likvern and others have so aptly described.
Deepwater resources have proven to be more difficult to bring on line than originally estimated and thus, for example, in the case of Brazil OPEC now anticipates that the production from the Lula field (originally Tupi) will only offset declines from wells in the rest of the country, with perhaps only a gain of 10 kbd overall from the addition of the 100 kbd expected from wells now coming on line. And thus, while this is a resource getting more attention (there are expected to be 60 Deepwater rigs in the Gulf of Mexico by 2015) the slow pace of development may not fill the increasing gap left as conventional oil production continues to fall, as Exxon Mobil suggest.
In retrospect, therefore, I was wrong in anticipating a relatively immediate impact from an anticipated imbalance between oil supply and demand. But, within the time frame the price of oil has risen, and the future looks no happier than it did back in 2005. The threats have changed – we seem to be in a quiescent period for major Gulf Hurricanes, for e.g. – but the threat of growing and spreading turmoil in MENA makes it less certain that we can count on much increase in production from Iraq, among others. Russian production rebounded more than I expected, but whether that can be sustained is still in doubt. The hope, at the beginning, was that the threat would spur increased looks into alternate sources of liquid fuel. But while there was a flurry of activity into biofuels (and I myself saw algal work that held a great potential, - though funding has now disappeared for that effort) there is less of a feeling of urgency in the air. Wind and solar sources have reached a point where they are no longer novel, and there is not much else in the near term that holds much potential.
Oil production takes money and resources, but most critically it takes time. Without that investment, particularly in viable alternatives, the oil “income” (supply) will likely soon start to fall short of the oil “expenses” (demand) and as Mr. Micawber so aptly said “we are forever floored.”
When these posts began, technical blogs, such as TOD, posed the potential for mass education in a way that had not been seen before. Readers have been kind in regard to the quality of the posts themselves. But the contributions from those interested, and those in industry who took the time to comment and debate ended up making this much stronger than the initial words in any post. Expertise came in many forms and informed me as well as the rest of the readers in what turned into a wonderful opportunity for many people to understand some of the complexities of supplying the world with hydrocarbon energy. I was thus able to help bring a little understanding of the energy business to vastly more folk than I had in the entirety of my academic career.
I will always be grateful to Kyle for giving me the opportunity to make this contribution, and to his efforts which led to its great success. I can illustrate that with some numbers – as an academic I took persuasion to allow my class size to rise much above 20, and at Bit Tooth Energy I see about 300 readers on a typical good day – Kyle had us above that number in a very few months, and at its peak TOD was handling 200 times that number. The site would not have continued too long as it grew in size without the indefatigable SuperG, who kept the site up under wide ranging pressures, and took care of the technical side of the house. Leanan brought and kept us readers, and provided many of the topics that we needed to create the posts on site, and Gail kept me going with encouragement and support in more difficult times. Nate orchestrated the closing posts and that was not easy.
The folks Kyle brought in to build an international forum were formidable and highly productive, and so to them, and to all of the gentle readership I say again a heartfelt “Thank You!”
(Heading Out – Dave Summers in the mundane world – will continue to write Tech Talks at Bit Tooth Energy, though he writes on a wider range of topics at that site).
When I was young I was fascinated by a small china statuette that my Grandparents had of Mr Micawber. He is a character, and a sympathetic one, in Charles Dickens's book "David Copperfield", in the course of which he goes into debt, His explanation of his financial condition can be compared to the coming world experience as we now live through Hubbert's Peak. You might, in today's phraseology, call this the Money quote:
'My other piece of advice, Copperfield,' said Mr. Micawber, 'you know. Annual income twenty pounds, annual expenditure nineteen nineteen and six, result happiness. Annual income twenty pounds, annual expenditure twenty pounds ought and six, result misery. The blossom is blighted, the leaf is withered, the god of day goes down upon the dreary scene, and - and in short you are for ever floored. As I am!'.
In this case consider that our expenses, i.e. the world use of oil, went up last year to around 83 million barrels every day (mbd). (A barrel is 42 gallons). Now as long as our supplies (income) can match this outlay then we are in happiness. This was, in relative terms, where we ended last year.
However this year our expenses are going to go up. It is a little difficult to predict exactly how much but current predictions are for this to be around 2 mbd. Let us equate this to the old English sixpence (which was back then worth about a dime. Twenty pounds being worth about $100).
If we follow the Micawber example if our income, world oil supply is equal to or greater than our expenses then we can stay happy. But here is the rub.
When world oil production is just about as high as it can be (non-OPEC countries are now producing just about as fast as they can) and OPEC spare capacity is down to around an additional 1.3 mbd. then our income this year will likely not be much above 85 mbd, if it gets there. (In a later post I will explain why it probably won't).
So we are at the point where within the next few months income and expenditures will be in balance (Micawber's twenty pounds). Except that the industry being a big one there are always things going wrong. In the latter part of last year for example we had:
• the hurricanes in the Gulf that closed down about 0.5 mbd of production for several months,
• oil production in Iraq, which should be around 3 mbd, but because of pipeline bombings etc dropped below 2 mbd,
• there were frequent threatened strikes on the oil platforms in Nigeria,
• and Russian production declined more drastically than had been anticipated.
Some of these are still with us, some have been resolved. And other problems, such as the complete employment of the world tanker fleet, have yet to make an impact. But any one can drop supply.Looking around it is reasonable to note that we don’t see the level of misery that, from reading that post, one might have expected to happen. We have gone through a major recession, yet demand has, overall, increased and production has risen to meet that demand. Yet looking at how this has been met is instructive.
Yet while our supply (income) is about at a peak (twenty pounds), our expenses (demand) are still going up by this sixpence a year. So that some time this year expenses will have gone from twenty pounds to twenty pounds and sixpence. A number of economists had been predicting that there would be a reduction in the rise in demand to keep us below that figure, but it is already clear that they do not adequately recognize the considerable needs in China and India that drive this increase (and they only have to read the papers to see it).
The big question is when will we reach the point that we cross over the balance point. Right now with the Saudi Arabian government saying that they can increase production by up to 1.5 mbd one might think we could get through to just about the end of this year. Unfortunately some of us are a little cynical about that number, and I'll explain why in another post.
One final gloomy thought - production in other countries (such as the UK) is falling, and the countries that used that supply must find another source. And if we are now at the peak of production, then our income cannot increase above twenty pounds and and may indeed fall back below twenty pounds, while our expenses will continue to increase to twenty pounds and sixpence. It is not the absolute size of the market that will now drive, but the relatively small fluctuations that take us out of balance.
The result is misery, and we are for ever floored.
Figure 1. Changes in liquid supply sources from 2000 to 2040 as anticipated by Exxon Mobil, with lines added to show 2005 and 2013. (The Outlook for Energy: A view to 2040)
I have added lines to show the situation in 2005, when the piece was written, and for this year. It is worth noting that, using the definitions that Exxon Mobil give, conventional crude and condensate production has, indeed, declined since I wrote those words. And if one includes Oil Sand and Deepwater then production has remained fairly stable at the levels back in 2005, and will (according to EM) likely stay so into the projected future.
The three sources that I had underestimated, in terms of production growth were in Biofuels (which is now at around 2 mbd), the growth in Natural Gas Liquids (which for OPEC alone is now projected to reach 6 mbd by next year up from around 3 mbd in 2005, and the growth in tight oil. This latter development, particularly with the use of long horizontal wells that are artificially fractured and injected with a slick-water suspension of a proppant, has been very successful in developing resources which were otherwise at best marginally economic. However the relative contribution that this is expected to make in overall supply is not that great, and I expect that, because of the high decline rates in individual wells, that this will only contribute on the margin of the problem.
When I began writing at The Oil Drum I was concerned that there was a lack of understanding of the impact that reservoir decline rates would have on long-term supply. As larger fields are depleted, so the world turns to smaller fields and these drain more rapidly, so that more and more are needed. (The Red Queen situation that Rune Likvern and others have so aptly described.
Deepwater resources have proven to be more difficult to bring on line than originally estimated and thus, for example, in the case of Brazil OPEC now anticipates that the production from the Lula field (originally Tupi) will only offset declines from wells in the rest of the country, with perhaps only a gain of 10 kbd overall from the addition of the 100 kbd expected from wells now coming on line. And thus, while this is a resource getting more attention (there are expected to be 60 Deepwater rigs in the Gulf of Mexico by 2015) the slow pace of development may not fill the increasing gap left as conventional oil production continues to fall, as Exxon Mobil suggest.
In retrospect, therefore, I was wrong in anticipating a relatively immediate impact from an anticipated imbalance between oil supply and demand. But, within the time frame the price of oil has risen, and the future looks no happier than it did back in 2005. The threats have changed – we seem to be in a quiescent period for major Gulf Hurricanes, for e.g. – but the threat of growing and spreading turmoil in MENA makes it less certain that we can count on much increase in production from Iraq, among others. Russian production rebounded more than I expected, but whether that can be sustained is still in doubt. The hope, at the beginning, was that the threat would spur increased looks into alternate sources of liquid fuel. But while there was a flurry of activity into biofuels (and I myself saw algal work that held a great potential, - though funding has now disappeared for that effort) there is less of a feeling of urgency in the air. Wind and solar sources have reached a point where they are no longer novel, and there is not much else in the near term that holds much potential.
Oil production takes money and resources, but most critically it takes time. Without that investment, particularly in viable alternatives, the oil “income” (supply) will likely soon start to fall short of the oil “expenses” (demand) and as Mr. Micawber so aptly said “we are forever floored.”
When these posts began, technical blogs, such as TOD, posed the potential for mass education in a way that had not been seen before. Readers have been kind in regard to the quality of the posts themselves. But the contributions from those interested, and those in industry who took the time to comment and debate ended up making this much stronger than the initial words in any post. Expertise came in many forms and informed me as well as the rest of the readers in what turned into a wonderful opportunity for many people to understand some of the complexities of supplying the world with hydrocarbon energy. I was thus able to help bring a little understanding of the energy business to vastly more folk than I had in the entirety of my academic career.
I will always be grateful to Kyle for giving me the opportunity to make this contribution, and to his efforts which led to its great success. I can illustrate that with some numbers – as an academic I took persuasion to allow my class size to rise much above 20, and at Bit Tooth Energy I see about 300 readers on a typical good day – Kyle had us above that number in a very few months, and at its peak TOD was handling 200 times that number. The site would not have continued too long as it grew in size without the indefatigable SuperG, who kept the site up under wide ranging pressures, and took care of the technical side of the house. Leanan brought and kept us readers, and provided many of the topics that we needed to create the posts on site, and Gail kept me going with encouragement and support in more difficult times. Nate orchestrated the closing posts and that was not easy.
The folks Kyle brought in to build an international forum were formidable and highly productive, and so to them, and to all of the gentle readership I say again a heartfelt “Thank You!”
(Heading Out – Dave Summers in the mundane world – will continue to write Tech Talks at Bit Tooth Energy, though he writes on a wider range of topics at that site).
Read more!
Labels:
biofuels,
Brazil,
Deepwater resources,
Exxon Mobil,
Gulf of Mexico,
Kyle,
Micawber,
NGL,
OPEC,
The Oil Drum
Sunday, April 3, 2011
OGPSS - The top 30 oil producers, a review
These posts have been going through the EIA list of the top oil producers in the world, over the past few weeks, I thought I might just review them collectively, but briefly, before starting to look at individual countries and oilfields. Even the posts that I have written recently have become out of date with new information (Russia increased production again in February by 20 kbd over January reaching 10.23 mbd) and then fell back to 10.2 mbd in March but at this stage, rather than focusing on such details, I am trying to generate a sense of the overall picture. It should also be recognized that I am just grabbing a snapshot of data, rather than the more detailed studies that look at the longer term, which folk such as Rembrandt, Rune and Euan provide. The simplest way to do this is to place my current estimates of production for the top 30 oil producers that I have reviewed in this series against the EIA estimate of their production in 2009.
Top 30 oil producing countries (those increasing production over 2009 are shown in red). (Click on the table to enlarge it)
It is significant to note that while Saudi Arabia was producing 8.05 mbd of crude in 2009, this has risen to 8.869 mbd on average for February as the Kingdom increased production to match the shortfalls in oil exports from Libya, inter alia. (With roughly 1.8 mbd in “other liquids” this takes total KSA production to 10.67 mbd and moves it back to the top of the League. However those numbers were from the March MOMR, which reports on February, In that report Libya was still being recorded as producing around 1.3 mbd). It is now reported that overall OPEC was not able to match the Libyan decline in March, falling about 350 kbd short, while KSA production has now reached 9 mbd, (10.8 including other liquids).
Contrary to President Obama’s recent remarks the EIA are anticipating a decline in US crude oil and liquids production over the next two years, part of which has been blamed on the change in GOM regulations. As a result it would be optimistic to anticipate much more than a US production of 8.3 mbd (and the EIA project it will be down to 8.2 mbd next year). It is unlikely that US production will increase beyond that point.
US crude and liquid fuels production – (EIA )
With China, Iran, and Canada holding relatively steady in the short term, this gives an updated total of 39.83 mbd for the top six, which is about 1.4 mbd higher than when I wrote the initial post back in February, but 500 kbd below the EIA estimate for their 2009 production. (While Russia and the KSA increased, the USA and Iran declined). Of these it is likely that only the KSA can continue to increase production much more.
In the second tier, Mexican production continues to fall, and was down to 2.556 mbd in February, with reports that it will now be an oil importer well before 2020. Exports have already fallen to 1.23 mbd, which does not bode well for customers. The United Arab Emirates (UAE) have, like the KSA, increased production to help out, though so far this has only been up to 2.394 mbd from 2.3 mbd for most of last year. (They also produce roughly another 500 kbd of other liquid fuels). By 2020 they should be able to produce up to 3.5 mbd. And in similar vein Kuwait, now producing at 2.368 mbd, up from 2,3 mbd. Kuwaiti plans are to reach 3.5 mbd by 2015, and be at 4 mbd by 2020.
The current political turmoil has even persuaded Venezuela to increase production, with OPEC reporting levels of 2.39 mbd for February, a gain of around 100 kbd. Though how long that is sustained depends on the success of the many investors that have been persuaded to invest in the Venezuelan oil sands.
In the third group Norway is declining, being now at just over 2 mbd, and even though it has just announced a major new discovery that will not come on line for at least 5 – 10 years, and in the meanwhile production will continue to fall. Norway needs more discoveries similar to this, however, to be able to sustain production levels extending into the future, since without them production will collapse.
Brazil was touted, by President Obama in his remarks about the Energy Blueprint last week, though the increasing volumes of oil that they will produce remain foreign to the United States, and though they will likely increase production up to around 4 mbd by 2020, rising domestic consumption may well take much of that increase.
Which brings us into the states that has some political turmoil. Iraq has been able to bring production back to around 2.64 mbd (according to OPEC) with the hope of reaching 3 mbd by the end of this year. At the moment about 1.2 mbd of this is exported. One of the great questions of the decade is just how close to a projected 10 mbd by 2020 that Iraq will be able to get. Sadly the continuing conflicts there, though reduced in scale, make it difficult for me to see much beyond 5 mbd by 2020.
Nigeria, which has had its own internal conflicts for some time, is going to the polls as I write this, and the expected winner is planning to overhaul the oil industry. However, if stability continues, then it might be possible to resurrect some of the older fields and perhaps increase overall production by some 350 kbd.
Algeria, which has had some turmoil, but may emerge from the ongoing protests without much change, is producing around 2 mbd of liquids. That has not changed as OPEC has moved to match the decline in volumes from Libya and other countries facing protests, and may reflect the current maximum that the country can produce. In the stability stakes I suspect that Algeria may survive without much change, although the plot I put up from Energy Export Databrowser does suggest that production may have peaked.
Algerian oil statistics (Energy Export Databrowser)
Angola is currently producing 1.7 mbd but may add some 650 kbd this year, for a total of 2.35 mbd. And that brings us to Libya, where the increased fighting, particularly over the oil refinery town of Ras Lanuf, makes it increasingly unlikely that the 1.7 mbd which came from Libya will be available again soon.
The United Kingdom is in significant decline, but recent moves to further tax the oil industry have made it possible that the decline may steepen. This because the new taxes proposed will likely reduce the profitability of the field developments proposed, discouraging their development. Recently production has run at 1.35 mbd of liquids, which is scheduled to drop to 1.3 mbd this year, and 0.94 mbdoe of natural gas, anticipated to fall to 0.85 mbdoe this year. The criticality of investment is shown in the projected production over the next 5 years, with the different colors showing the likelihood of success. Note that the grey of current production is declining at about 10%.
UK Projected Oil production (2011 UK Oil and Gas Activity Survey )
UK Projected Natural Gas production (2011 UK Oil and Gas Activity Survey )
Moving to the next tier down, Kazakhstan is now at 1.6 mbd and slowly increasing production toward a target of 3 mbd by 2020. Qatar is running at 1.4 mbd, but with almost 0.6 mbd of that in NGL. Indonesia is producing right around 1 mbd and may maintain that in the short term. It is being challenged in rank by Azerbaijan which has just incremented up to 1 mbd, a volume that is expected to continue to rise until it reaches about 1.25 mbd in 2014.
The tier that lies below 1 mbd starts with India, which is currently holding a production of around 878 kbd, and having to import increasing amounts of oil to meet demand. Given that the country also subsidizes the price, this is becoming an increasingly expensive consideration for the government. India is followed by Argentina, which is post peak and declined to 0.76 mbd most recently. Egypt is similarly declining, now to 660 kbd, but as one of the early nations to change under the most recent protests, and with the situation still somewhat fluid, it is difficult to predict how much the country will have both for itself, and for external customers, a year from now.
Oman will likely weather the current storms, and is also increasing oil production, to the point that it is moving up to pass India, with an Omani production of 863 kbd, some of which is tied to NGL production.
In the final four that produce more than 500 kbd Malaysia is barely maintaining production at 700 kbd, while Australia has fallen from 588 kbd to 540 kbd. Both are now being passed in production by Colombia, one of the “hotter” places for development at the moment, with production rising to possibly 920 kbd this year. Ecuador, which closes out the top 30, has recently increased production from 485 to 504 kbd.
That completes the top 30, and accounts for some 76.7 mbd of production. Those same countries back in 2009 were reported by the EIA as producing some 79.23 mbd of oil. Remember that world demand is anticipated to increase by somewhere between 1.4 and 1.6 mbd this year, and that of this list of 30 only 13 increased production, and the rest declined and the concern for the future becomes thus more clearly defined. (The difference between the two totals is partially explained by the loss in Libyan oil - we will see within the month how well OPEC covers that).
But it is not the overall production from the world that can be estimated that accurately, but by looking at individual countries and, in some cases, individual oilfields that we can get some better sense of what is to come. So the next step will be looking at these nations in more detail, in the weeks ahead.
Top 30 oil producing countries (those increasing production over 2009 are shown in red). (Click on the table to enlarge it)It is significant to note that while Saudi Arabia was producing 8.05 mbd of crude in 2009, this has risen to 8.869 mbd on average for February as the Kingdom increased production to match the shortfalls in oil exports from Libya, inter alia. (With roughly 1.8 mbd in “other liquids” this takes total KSA production to 10.67 mbd and moves it back to the top of the League. However those numbers were from the March MOMR, which reports on February, In that report Libya was still being recorded as producing around 1.3 mbd). It is now reported that overall OPEC was not able to match the Libyan decline in March, falling about 350 kbd short, while KSA production has now reached 9 mbd, (10.8 including other liquids).
Contrary to President Obama’s recent remarks the EIA are anticipating a decline in US crude oil and liquids production over the next two years, part of which has been blamed on the change in GOM regulations. As a result it would be optimistic to anticipate much more than a US production of 8.3 mbd (and the EIA project it will be down to 8.2 mbd next year). It is unlikely that US production will increase beyond that point.
US crude and liquid fuels production – (EIA ) With China, Iran, and Canada holding relatively steady in the short term, this gives an updated total of 39.83 mbd for the top six, which is about 1.4 mbd higher than when I wrote the initial post back in February, but 500 kbd below the EIA estimate for their 2009 production. (While Russia and the KSA increased, the USA and Iran declined). Of these it is likely that only the KSA can continue to increase production much more.
In the second tier, Mexican production continues to fall, and was down to 2.556 mbd in February, with reports that it will now be an oil importer well before 2020. Exports have already fallen to 1.23 mbd, which does not bode well for customers. The United Arab Emirates (UAE) have, like the KSA, increased production to help out, though so far this has only been up to 2.394 mbd from 2.3 mbd for most of last year. (They also produce roughly another 500 kbd of other liquid fuels). By 2020 they should be able to produce up to 3.5 mbd. And in similar vein Kuwait, now producing at 2.368 mbd, up from 2,3 mbd. Kuwaiti plans are to reach 3.5 mbd by 2015, and be at 4 mbd by 2020.
The current political turmoil has even persuaded Venezuela to increase production, with OPEC reporting levels of 2.39 mbd for February, a gain of around 100 kbd. Though how long that is sustained depends on the success of the many investors that have been persuaded to invest in the Venezuelan oil sands.
In the third group Norway is declining, being now at just over 2 mbd, and even though it has just announced a major new discovery that will not come on line for at least 5 – 10 years, and in the meanwhile production will continue to fall. Norway needs more discoveries similar to this, however, to be able to sustain production levels extending into the future, since without them production will collapse.
Brazil was touted, by President Obama in his remarks about the Energy Blueprint last week, though the increasing volumes of oil that they will produce remain foreign to the United States, and though they will likely increase production up to around 4 mbd by 2020, rising domestic consumption may well take much of that increase.
Which brings us into the states that has some political turmoil. Iraq has been able to bring production back to around 2.64 mbd (according to OPEC) with the hope of reaching 3 mbd by the end of this year. At the moment about 1.2 mbd of this is exported. One of the great questions of the decade is just how close to a projected 10 mbd by 2020 that Iraq will be able to get. Sadly the continuing conflicts there, though reduced in scale, make it difficult for me to see much beyond 5 mbd by 2020.
Nigeria, which has had its own internal conflicts for some time, is going to the polls as I write this, and the expected winner is planning to overhaul the oil industry. However, if stability continues, then it might be possible to resurrect some of the older fields and perhaps increase overall production by some 350 kbd.
Algeria, which has had some turmoil, but may emerge from the ongoing protests without much change, is producing around 2 mbd of liquids. That has not changed as OPEC has moved to match the decline in volumes from Libya and other countries facing protests, and may reflect the current maximum that the country can produce. In the stability stakes I suspect that Algeria may survive without much change, although the plot I put up from Energy Export Databrowser does suggest that production may have peaked.
Algerian oil statistics (Energy Export Databrowser) Angola is currently producing 1.7 mbd but may add some 650 kbd this year, for a total of 2.35 mbd. And that brings us to Libya, where the increased fighting, particularly over the oil refinery town of Ras Lanuf, makes it increasingly unlikely that the 1.7 mbd which came from Libya will be available again soon.
The United Kingdom is in significant decline, but recent moves to further tax the oil industry have made it possible that the decline may steepen. This because the new taxes proposed will likely reduce the profitability of the field developments proposed, discouraging their development. Recently production has run at 1.35 mbd of liquids, which is scheduled to drop to 1.3 mbd this year, and 0.94 mbdoe of natural gas, anticipated to fall to 0.85 mbdoe this year. The criticality of investment is shown in the projected production over the next 5 years, with the different colors showing the likelihood of success. Note that the grey of current production is declining at about 10%.
UK Projected Oil production (2011 UK Oil and Gas Activity Survey )
UK Projected Natural Gas production (2011 UK Oil and Gas Activity Survey )Moving to the next tier down, Kazakhstan is now at 1.6 mbd and slowly increasing production toward a target of 3 mbd by 2020. Qatar is running at 1.4 mbd, but with almost 0.6 mbd of that in NGL. Indonesia is producing right around 1 mbd and may maintain that in the short term. It is being challenged in rank by Azerbaijan which has just incremented up to 1 mbd, a volume that is expected to continue to rise until it reaches about 1.25 mbd in 2014.
The tier that lies below 1 mbd starts with India, which is currently holding a production of around 878 kbd, and having to import increasing amounts of oil to meet demand. Given that the country also subsidizes the price, this is becoming an increasingly expensive consideration for the government. India is followed by Argentina, which is post peak and declined to 0.76 mbd most recently. Egypt is similarly declining, now to 660 kbd, but as one of the early nations to change under the most recent protests, and with the situation still somewhat fluid, it is difficult to predict how much the country will have both for itself, and for external customers, a year from now.
Oman will likely weather the current storms, and is also increasing oil production, to the point that it is moving up to pass India, with an Omani production of 863 kbd, some of which is tied to NGL production.
In the final four that produce more than 500 kbd Malaysia is barely maintaining production at 700 kbd, while Australia has fallen from 588 kbd to 540 kbd. Both are now being passed in production by Colombia, one of the “hotter” places for development at the moment, with production rising to possibly 920 kbd this year. Ecuador, which closes out the top 30, has recently increased production from 485 to 504 kbd.
That completes the top 30, and accounts for some 76.7 mbd of production. Those same countries back in 2009 were reported by the EIA as producing some 79.23 mbd of oil. Remember that world demand is anticipated to increase by somewhere between 1.4 and 1.6 mbd this year, and that of this list of 30 only 13 increased production, and the rest declined and the concern for the future becomes thus more clearly defined. (The difference between the two totals is partially explained by the loss in Libyan oil - we will see within the month how well OPEC covers that).
But it is not the overall production from the world that can be estimated that accurately, but by looking at individual countries and, in some cases, individual oilfields that we can get some better sense of what is to come. So the next step will be looking at these nations in more detail, in the weeks ahead.
Read more!
Sunday, February 20, 2011
OGPSS - Lower second tier oil producers - Norway, Brazil, Iraq and Algeria
This current series of posts is aimed at an overview of the top oil producing nations, seeking to establish how the ranking of the countries is changing from the original table that EIA put out in 2008, After looking at the conditions governing the top six, this was followed last week when I looked at the condition of the following three (Mexico, UAE and Kuwait) in a little detail, but, having spent four posts on Veneuela in the recent past forebore going back there again.
Source EIA
It is worth recapping, however, that the initial order has changed, and that, currently Russia is at the head of the League, slightly ahead of Saudi Arabia., and both producing somewhere around 10.2 mbd. I’ll go more into that detail as the posts focus in on the individual countries later. The United States production, if one includes ethanol, is around 8.2 mbd, and this is in third place,. China has moved into fourth place, slightly ahead of Iran which is followed by Canada. At present these six appear to be the only countries producing over 3 mbd.
In the next tier down I have already mentioned the United Arab Emirates, which have moved into 7th place, with a production of around 2.81 mbd, how ahead of Mexico, albeit perhaps barely (based on the addition of NGLs etc). As with the UAE Kuwait has been limiting production in line with OPEC requests, but while only producting at around 2.35 mbd at the moment, is looking to increase this to up to 3.5 mdb by 2015, which would move it into the top tier. Venezuela, although it too has some grandiose plans, based on the potential increases in production from their tar sands, is currently producing at down around 2.26 mbd. As I have mentioned Venezuela does have plans to raise production to 4 mbd by 2015. However recent commitments to China of up to 1 mbd and problems that Venezuela continues to have in meeting current obligations leaves a large question mark on those predictions.
And so we come to the lower half of the second tier.
In order to create the current ranking we have to first work out what the current levels of production are, and the future potential. So let’s start with Norway, since that country did rank 11th in 2008. Statoil has noted that their equity liquids production fell to 1.945 mbdoe in the fourth quarter of 2010. Statoil anticipate that there will be little change in production this year, but that there may be a slight rise thereafter. Statoil is not, however, Norway, being responsible for about 80% of the countries production (with properties abroad as well) but I mention it as indicative of the trends. One hopeful sign of which been the agreement with Russia that defines who owns what in the Barents Sea. However when we look at the long-term Norwegian trend is is recognizably downwards, with the Norwegian Petroleum Directorate predicting a 1.7 mbd average production in 2011. The Directorate is predicting that oil production will fall to 1.54 mbd by 2015. This does not consider other liquids and if these are included, while the overall total still lies below 2 mbd, it is currently a lot closer to that, though that is not expected to last.
Norwegian oil production in 2011 (Norwegian Petroleum Directorate)
In January this total, was made up of 1.836 mbd of crude oil, 256 kbd of NGLs and 69 kbd of condensate. Most of Norwegian production is exported, and the percentage can be seen from the EIA Country Analysis. The relatively flat domestic production is (as we have discussed with the Export Land Model) not typical.
Declining production, and thus exports of petroleum from Norway (EIA )
Natural gas production, on the other hand, is continuing to rise, though it depends on finding and developing new fields, and 95% of this is exported.

Norway produced 3.65 Tcf in 2009, with the majority of production coming from the Troll, Oman Lange and Asgard fields.
The next country down the 2008 list was Brazil, and here there is a change in order since Brazil is now rising past 2.12 mbd of crude production in December, moving ahead of Norway. Offshore production in the Tupi field, which may hold 6.5 billion barrels of oil, will be followed by that from the Jupiter field, possibly of similar size. The fields fall deep offshore in the Santos and Campos Basins, which will deserve a couple of posts on their own, down the road.
Location of the Santos and Campos Basins off Brazil
Development has now started.
Brazil plans to double crude production from the current 2 mbd to 4 mbd by 2020, reaching 3 mbd by around 2014. However overall liquids production is already at 2.7 mbd and the EIA anticipates that this will rise over 3 mbd by next year. With the cumulative liquid totals Brazil has also passed Venezuelan production and may soon be competing with Kuwait as they both move into the top tier.
Brazil also produces ethanol, mainly from sugar cane, with production at around 450 kbd However, with a growing economy, the country does not, as yet, have much of its production available for export. (The BP figures are a little more pessimistic than those of the EIA).
Brazilian oil information (Energy Export Databrowser)
Brazil continues to find oil onshore, most recently in the Amazon Basin and this bodes well for the targets that it now envisages.
Brazil gets most of its electric power from hydro-electric power plants, but is able to use the natural gas that is recovered during oil production to meet about half of the national need for gas, the rest being imported.
The next country on the original list was Iraq. And this poses a problem of prediction since we have to decide who to believe in the tales of competing numbers that have been used, among other places by BP in predicting the sources of future oil supply. The problems in this case are as much geo-political and locally ethnic and religious as they have to do with the capabilities of producing oil. At the moment Iraq has finally got back up to a production level of 2.6 mbd not that this will necessarily help Western imports that much:
In January, OPEC reports, Iraq produced a total of 2.7 mbd, which was 300 kbd up on production in the last quarter of 2010. To put this in context in February 2003, just before the conflict began, Iraq was producing 2.8 mbd. At the moment production is centered on the North and South Ramalla fields and that of Kirkuk in the North. The problems of Iraq are not so much, in the short term those of most of the rest of the world, i.e. in finding more oil. In the immediate short term the information on fields that have been known for some time (and in some cases were previously producing) already exists. What is needed is some way of ensuring that the infrastructure is repaired and, if necessary, new pipelines laid. Those plans are now advancing although it is now going to be more difficult to foresee their short-term success, given the developing turmoil in the region. The EIA has posted a table showing the potential from the different regions.
Estimate of oil availability in Iraq
Consumption in Iraq has been fairly stable until about 2007 where it started to climb, and, given a little more stability in the country, it is reasonable to expect that it will surge as it has in much of the Middle East. On the other hand it is a little difficult for me to see production rising to the 12 mbd figures that are now discussed as being possible for Iraq by 2017.
Until recently Iraq was flaring more than 60% of the natural gas that it was producing (perhaps as much as 1 bcf/day) One option that is open is to pipeline some of the gas up to Turkey and then feed it into the Nabucco pipeline. There is a hope that this can lead to exports of up to 2.5 bcf/day but new legal hurdles are continuing to delay progress. Apart from resurrecting the pipelines there is also the possibility of installing an LNG train or two.
And when one is considering the growing instability of the region, the next country down the list is Algeria, and that has now started to be mentioned among the countries feeling the fallout from the initial protests in Tunisia. The Algerian Foreign Minister is denying the risk of a “domino” effect. Possibly this could be because, as it is reported the income from oil and gas sales can, in this case help.
Algeria is a member of OPEC, which reports the January 2011 production of oil at 1.28 mbd, which has been relatively stable for some time. The EIA consider that the crude is some of the finest in the world . Production is supplemented by condensate (450 kbd in 2008) and NGL (357 kbd) for a total liquid fuels production of over 2 mbd. It is the largest oil-liquids producer in the African continent.
Algeria, which operates the oil and gas through the company Sonatrach exports most of its natural gas, through pipelines to Europe and through LNG terminals, with a new one that is to be completed in 2012. Total exports are around 2 TCF making it the fourth largest exporter. (CIA 2011 World Factbook). Gazprom has recently become involved in field development. It also provides a useful fuel for the processing of fertilizer in Morocco, as Jeff Vail noted, back in 2008. As one of the world’s largest exporters of natural gas, Algeria supplies Southern Europe.
Algerian natural gas delivery network
The Algerian reserves are found in the Sahara
But the current turmoil may make some of these plans moot.
Source EIA It is worth recapping, however, that the initial order has changed, and that, currently Russia is at the head of the League, slightly ahead of Saudi Arabia., and both producing somewhere around 10.2 mbd. I’ll go more into that detail as the posts focus in on the individual countries later. The United States production, if one includes ethanol, is around 8.2 mbd, and this is in third place,. China has moved into fourth place, slightly ahead of Iran which is followed by Canada. At present these six appear to be the only countries producing over 3 mbd.
In the next tier down I have already mentioned the United Arab Emirates, which have moved into 7th place, with a production of around 2.81 mbd, how ahead of Mexico, albeit perhaps barely (based on the addition of NGLs etc). As with the UAE Kuwait has been limiting production in line with OPEC requests, but while only producting at around 2.35 mbd at the moment, is looking to increase this to up to 3.5 mdb by 2015, which would move it into the top tier. Venezuela, although it too has some grandiose plans, based on the potential increases in production from their tar sands, is currently producing at down around 2.26 mbd. As I have mentioned Venezuela does have plans to raise production to 4 mbd by 2015. However recent commitments to China of up to 1 mbd and problems that Venezuela continues to have in meeting current obligations leaves a large question mark on those predictions.
And so we come to the lower half of the second tier.
In order to create the current ranking we have to first work out what the current levels of production are, and the future potential. So let’s start with Norway, since that country did rank 11th in 2008. Statoil has noted that their equity liquids production fell to 1.945 mbdoe in the fourth quarter of 2010. Statoil anticipate that there will be little change in production this year, but that there may be a slight rise thereafter. Statoil is not, however, Norway, being responsible for about 80% of the countries production (with properties abroad as well) but I mention it as indicative of the trends. One hopeful sign of which been the agreement with Russia that defines who owns what in the Barents Sea. However when we look at the long-term Norwegian trend is is recognizably downwards, with the Norwegian Petroleum Directorate predicting a 1.7 mbd average production in 2011. The Directorate is predicting that oil production will fall to 1.54 mbd by 2015. This does not consider other liquids and if these are included, while the overall total still lies below 2 mbd, it is currently a lot closer to that, though that is not expected to last.
Norwegian oil production in 2011 (Norwegian Petroleum Directorate) In January this total, was made up of 1.836 mbd of crude oil, 256 kbd of NGLs and 69 kbd of condensate. Most of Norwegian production is exported, and the percentage can be seen from the EIA Country Analysis. The relatively flat domestic production is (as we have discussed with the Export Land Model) not typical.
Declining production, and thus exports of petroleum from Norway (EIA ) Natural gas production, on the other hand, is continuing to rise, though it depends on finding and developing new fields, and 95% of this is exported.

Norway produced 3.65 Tcf in 2009, with the majority of production coming from the Troll, Oman Lange and Asgard fields.
The next country down the 2008 list was Brazil, and here there is a change in order since Brazil is now rising past 2.12 mbd of crude production in December, moving ahead of Norway. Offshore production in the Tupi field, which may hold 6.5 billion barrels of oil, will be followed by that from the Jupiter field, possibly of similar size. The fields fall deep offshore in the Santos and Campos Basins, which will deserve a couple of posts on their own, down the road.
Location of the Santos and Campos Basins off Brazil Development has now started.
The Tupi field is being developed as a pilot project in two phases. In the first phase tests will be conducted to gather information about the future production systems. This phase is expected to end in 2012.
The second phase is expected to start from 2012 and will include two parts. In the first part (2012-17) ten production units will be installed at the field with 20 producing wells and injectors expected to be drilled during this time.
In the second part of phase two (after 2017), new technologies such as dry completion units will be employed to recover oil and natural gas from the field.
Brazil plans to double crude production from the current 2 mbd to 4 mbd by 2020, reaching 3 mbd by around 2014. However overall liquids production is already at 2.7 mbd and the EIA anticipates that this will rise over 3 mbd by next year. With the cumulative liquid totals Brazil has also passed Venezuelan production and may soon be competing with Kuwait as they both move into the top tier.
Brazil also produces ethanol, mainly from sugar cane, with production at around 450 kbd However, with a growing economy, the country does not, as yet, have much of its production available for export. (The BP figures are a little more pessimistic than those of the EIA).
Brazilian oil information (Energy Export Databrowser) Brazil continues to find oil onshore, most recently in the Amazon Basin and this bodes well for the targets that it now envisages.
Brazil gets most of its electric power from hydro-electric power plants, but is able to use the natural gas that is recovered during oil production to meet about half of the national need for gas, the rest being imported.
The next country on the original list was Iraq. And this poses a problem of prediction since we have to decide who to believe in the tales of competing numbers that have been used, among other places by BP in predicting the sources of future oil supply. The problems in this case are as much geo-political and locally ethnic and religious as they have to do with the capabilities of producing oil. At the moment Iraq has finally got back up to a production level of 2.6 mbd not that this will necessarily help Western imports that much:
The rising output will boost Iraq’s oil exports by 5 percent to 2 million barrels a day next month, Falah al-Amri, head of the country’s State Oil Marketing Organization, said today in an interview in Baghdad. The nation sells about 60 percent of supplies to India, China and other Asian countries where demand is increasing, he said
In January, OPEC reports, Iraq produced a total of 2.7 mbd, which was 300 kbd up on production in the last quarter of 2010. To put this in context in February 2003, just before the conflict began, Iraq was producing 2.8 mbd. At the moment production is centered on the North and South Ramalla fields and that of Kirkuk in the North. The problems of Iraq are not so much, in the short term those of most of the rest of the world, i.e. in finding more oil. In the immediate short term the information on fields that have been known for some time (and in some cases were previously producing) already exists. What is needed is some way of ensuring that the infrastructure is repaired and, if necessary, new pipelines laid. Those plans are now advancing although it is now going to be more difficult to foresee their short-term success, given the developing turmoil in the region. The EIA has posted a table showing the potential from the different regions.
Estimate of oil availability in IraqConsumption in Iraq has been fairly stable until about 2007 where it started to climb, and, given a little more stability in the country, it is reasonable to expect that it will surge as it has in much of the Middle East. On the other hand it is a little difficult for me to see production rising to the 12 mbd figures that are now discussed as being possible for Iraq by 2017.
Until recently Iraq was flaring more than 60% of the natural gas that it was producing (perhaps as much as 1 bcf/day) One option that is open is to pipeline some of the gas up to Turkey and then feed it into the Nabucco pipeline. There is a hope that this can lead to exports of up to 2.5 bcf/day but new legal hurdles are continuing to delay progress. Apart from resurrecting the pipelines there is also the possibility of installing an LNG train or two.
And when one is considering the growing instability of the region, the next country down the list is Algeria, and that has now started to be mentioned among the countries feeling the fallout from the initial protests in Tunisia. The Algerian Foreign Minister is denying the risk of a “domino” effect. Possibly this could be because, as it is reported the income from oil and gas sales can, in this case help.
Unrest in Algeria could have implications on the world economy since it is a major oil and gas exporter, but analysts say an Egypt-style revolt is unlikely because the government can use its energy wealth to placate most grievances.There are, however, other opinions.
Algeria is a member of OPEC, which reports the January 2011 production of oil at 1.28 mbd, which has been relatively stable for some time. The EIA consider that the crude is some of the finest in the world . Production is supplemented by condensate (450 kbd in 2008) and NGL (357 kbd) for a total liquid fuels production of over 2 mbd. It is the largest oil-liquids producer in the African continent.
Algeria, which operates the oil and gas through the company Sonatrach exports most of its natural gas, through pipelines to Europe and through LNG terminals, with a new one that is to be completed in 2012. Total exports are around 2 TCF making it the fourth largest exporter. (CIA 2011 World Factbook). Gazprom has recently become involved in field development. It also provides a useful fuel for the processing of fertilizer in Morocco, as Jeff Vail noted, back in 2008. As one of the world’s largest exporters of natural gas, Algeria supplies Southern Europe.
The part of the Algerian gas in the gas balances in some European countries is significant. 86% for Portugal, 61% for Spain, 49% for Italy, 26% for Belgium, 25% for France and 21% for Turkey. Today about 97% of Algerian gas exports supply the European market next to Russia, and Norway, one of the main suppliers of the Europe. Algeria accounts for 29 percent of European Union gas imports and 15% of gas consumption
Algerian natural gas delivery network The Algerian reserves are found in the Sahara
• 67% of oil and gas reserves contained in the Oued Mya and HassiMessaoud areas, where the two giant fields Of Hassi Rmel (Gas) and Hassi Messaoud (Oil) are located.Algeria is hoping to increase exports by 50% by 2015, using a new pipeline into Spain to help develop the European market.
• The Illizi basin comes third with 14% of initial reserves;
Then come the basins of Rhourd Nouss (9%), Ahnet Timimoun (4%), and the Berkine basin.
But the current turmoil may make some of these plans moot.
Read more!
Subscribe to:
Posts (Atom)