Showing posts with label oil pipelines. Show all posts

Sunday, June 22, 2014

Tech Talk - More on Iraq

A single picture is sufficient to tell the story of the fate of the Baiji Refinery in Iraq. Recently reached by the ISIS forces, it has been the largest refinery in Iraq, with a capacity of 310 kbd, and has been used to provide products for domestic use. Since it would provide fuel for both sides in the conflict it had been left largely intact, but that “understanding” seems to have fallen apart.


Figure 1. View from space of the fire at the Baiji Refinery in Iraq (Slate)

The remaining significant refineries in Iraq are at Daura near Baghdad which can produce 210 kbd, although promised at 280 kbd and Basra in the south, which can produce 140 kbd. There are an additional 11 very small refineries located around the country.

The conflict has already led to a drop in Iraqi exports of around 300 kbd and while this will not immediately impact the United States, given that imports have been declining in the face of growing domestic production, it will affect the overall global market, with longer term impacts on price and availability. India, for example, is already worried. It is quite possible that Iraq will partition, with the northern tier ending up Kurdish.


Figure 2. The Kurdish part of Iraq (Talking Points Memo)

This region has already run a separate pipeline through its own territory up into Turkey and thence to Ceyhan. From there it is tankered, and the Kurds have just sold a shipment to Israel, which arrived at Ashkelon on Friday and unloaded that night. The report has, however, been denied by the Kurdish Ministry. Three more tanker-loads destined for other customers are now in process at Ceyhan. The tanker was one which has, until recently, been unable to find a market.
In May, the Kurds took a further step by leasing two tankers, loading them in Jihan and looking for buyers. Attempts to sell oil to Morocco and other countries were rebuffed, out of solidarity with Iraq and concerns over legal action. It now seems that the Kurds have re-discovered their old ally Israel, which agreed to purchase the oil. To avoid a direct sale, the Kurdish tanker unloaded its oil onto another tanker. It’s unclear if the purchase is a one-off deal or the start of a permanent arrangement.
But the Kurdish pipeline is currently limited to a capacity of 100 kbd, whereas the main pipeline running up the center of the country (and through ISIS territory and control) can handle 600 kbd. The potential for a continued drop in Iraqi exports flowing north to Turkey of over 500 kbd is thus now quite possible. However the oilfields in the Kurdish territory are only, at present, producing around 120 kbd. Yet, by the end of the year it is projected that the pipeline can be expanded to handle flows of up to 400 kbd, with that capacity being reached as additional oilfields around Kirkuk are connected into the system and production raised. In the meantime additional oil is being trucked up to Turkey.

The impact of the conflict has already caused bidding on the Nassiriya oilfield and refinery to be postponed indefinitely.


Figure 3. Location of Nassiriya (Red point) (Google Maps)

Bidding on development of the 4 billion barrel oilfield, and associated 300 kbd refinery, was scheduled to have taken place on Thursday, but after being postponed in December and January has now been put off indefinitely.

At the same time Lukoil remains optimistic about expanding the West Qurna 2 field over the next year. The field has started production, and reached 200 kbd and Lukoil is hoping to start filling tankers in the third quarter of this year. The project was shared with Statoil, but they dropped out in 2012. West Qurna is in the South of Iraq, and at present a considerable distance from conflict.


Figure 4. The location of the West Qurna 2 field. (Statoil)

The field is anticipated to ultimately be capable of yielding 1.8 mbd of oil. In order to handle higher flow rates a new agreement has just been signed in which Lukoil will build two new pipelines from the field down to the off-shore terminal at Fao.

As long as the conflict remains north of Baghdad, and the oilfields in the South are not threatened then the major restriction on plans to grow exports from the south to 6 mbd may continue to lie with the Iraqi bureaucracy and the delays in installing the necessary infrastructure needed to support both production and also transport of the oil to the offshore terminals. There has also been some reduction in targets, for example Zubair which had been producing at 200 kbd was originally scheduled to produce at 1.2 mbd a target that was dropped to 850 kbd last year. A 200 kbd gas and oil separation plant (GOSP) has just been contracted, with completion in 2016.

This does not discount, however, that sabotage and terrorist attacks will not have some impact. The main pipeline to Turkey has been closed for months due to such attacks, but while that pipeline runs through Sunni territory, the lines from the Southern fields are all within Shia controlled land, and those in the north are now controlled by the Kurds. Oil companies have, however, as a precaution, begun repatriating some of their employees. Gazprom has just begun production from the Badra field. Originally projected to begin, at 15 kbd, in 2013. Production has now begun, although it is now anticipated that it will be another couple of months before the field reaches that initial 15 kbd target, and 2017 before it peaks at 170 kbd. Gazprom have, at least publically, “no problems” at the site.

Read more!

Tuesday, June 10, 2014

Tech Talk - Optimism is becoming harder to sustain

For some time the nations of OPEC have been suggesting that demand for their oil will remain relatively stable in the near future, as increased production from the non-OPEC nations is expected to more than meet demand increases. Thus, for example, in the May Monthly Oil Market Report OPEC anticipates that global oil demand will increase by 1.14 mbd this year, while non-OPEC production will increase by 1.38 mbd, allowing a slight reduction in the volumes OPEC market, which continues to fluctuate around 30 mbd. In the longer term, however, as previous annual oil company prognostications of future supply have emphasized, the MENA countries are going to be pulling an increased weight in supply. For example ExxonMobil has noted:
The Middle East is expected to have the largest absolute growth in liquids production over the Outlook period — an increase of more than 35 percent. This increase will be due to conventional oil developments in Iraq, as well as growth in NGLs and rising production of tight oil toward the latter half of the Outlook period.
At the same time BP pointed out that in just a couple of years demand for OPEC oil is likely to start to steadily increase.


Figure 1. BP view of the increased demands to be made on OPEC oil with time. (BP Energy Outlook 2035)

A large part of that increase has been expected to come from Iraq. With the end of the Iraq war, and the government encouraging development there were some claims that production might eventually rise to over 13 mbd (ahead of both Russia and Saudi Arabia). But those optimistic views had to be measured against the reality that the country has taken a long time to recover back to the 3 mbd levels of exports that it had achieved before conflict.


Figure 2. The fall and recovery of Iraq’s oil production. (EIA)

At present OPEC reports that Iraq was producing at 3.298 mbd in April, making it second only to Saudi Arabia (at 9.579 mbd) among the OPEC nations. There still seemed to be some chance that the country might be able to reach some lower target figures, such as those suggested in the OGJ.


Figure 3. Anticipated Iraqi exports and their market region (OGJ)

Regrettably violence is now significantly increasing in the country, with Mosul being over-run by Sunni militants. This puts them in charge of the main pipeline to Turkey, as well as giving them potential control of some of the adjacent oilfields.


Figure 3. Known Iraqi oilfields in 2010.

Euan Mearns has written of the potential for oil from the Kurdish regions and Turkey has just allowed a second tanker to sail from Ceyhan carrying oil from that region to the market, without Bagdad’s permission. The oil is being delivered through a new pipeline capable of carrying 100 kbd from Kurdistan into Turkey. The main pipeline (shown in Figure 3) can carry as much as 600 kbd and runs from Kirkuk and perilously close to Mosul. The new pipeline runs through Kurdish territory until it reaches Turkey.

The declining influence of the central government over the northern territories of Iraq does not bode well for future production gains. Conflicts are getting worse, and the country is approaching the point where it could well be partitioned, since the government forces seem unwilling to take on the insurgency. Violence has already spread to the Al-Bayji refinery some 130 miles north of the capital. This is the largest refinery in the country, and currently produces below its 300 kbd capacity, all of which is used for domestic consumption.

The problems that this reveals are unlikely to be resolved soon, it is much more likely that they will continue to escalate over the next months, if not years. The impact on Iraqi oil production should not be underestimated. While the oil in the Kurdish region can make its way through the smaller pipeline that is under Kurdish control, the greater flow rates needed to sustain future growth in supply cannot be met by that pipe.

In the South developments in the Mesopotamian region around Basra from the fields of Rumaila and Majnoon will likely continue, with production being shipped out from the new facility offshore, although this is already quite significantly behind schedule.


Figure 4. Oil fields of Southern Iraq (IEA )

One has only to look at the degrading situation in Libya, where production has fallen from 1.6 mbd to a current level of less than 200 kbd, with no path forward now evident for production levels to be restored. Those familiar with the region doubt that there will be much improvement in the situation this year, and if the country follows the Iraqi path (figure 1) then it is unlikely that the world will see significant Libyan production for this decade.

That loss of a million barrels a day is likely to become increasingly evident as world demand continues to grow at greater than that level each year. When this is combined with the increasingly inability of Iraq to increase production as it moves back into more vicious internal strife, then one has to ask from where can future gains in oil production be anticipated?

The major oil companies have urged complacency having bet on Iraq and OPEC coming through (and in the process assumed that Saudi Arabia would also increase production significantly above 10 mbd, something that they have consistently declined to commit to doing). As Libya and Iraq remove that surplus from the table then the question becomes where else can it come from?

It is increasingly unlikely that US increases in production can be sustained for long, given the very short high-level life of the new wells completed in shale, and as the sweet spots in the current fields are consumed. Thus within a couple of years we are now likely to see an increasingly desperate search for new reserves. But those reserves take years to find and develop (as well as large amounts of money), and if the crisis comes at a faster pace than most now expect, then $100 a barrel oil may seem an absurdly cheap price to have had to pay. It may even have an effect on the next Presidential election.

Read more!

Thursday, October 25, 2012

OGPSS - Global crude oil and Iran

There has been a little stir in the news on Energy lately, as folks have begun to extrapolate the growth in American oil and gas production to the point that they predict that the United States may out-produce Saudi Arabia, in terms of the totality of hydrocarbon production. Of course, in some cases, it has been North American oil independence that is featured, rather then that of the USA. And the reason for the generalization is that by broadening the geography so that the region also includes Canadian and Mexican production then the US imports from those countries magically disappear (which does not mean that they don’t have to be paid for. The US imported around 2.5 mbd from Canada and 1 mbd from Mexico in July). The stories also don’t dwell on the comparison of apples and apples. Consider the following quote from NPR. It is that easily missed sentence at the end of the first paragraph that is critical.
In 2011 the U.S. produced 5.66 million barrels of crude oil a day, according to the Department of Energy's Energy Information Administration. By next year the agency projects that will increase 21 percent to 6.85 million barrels a day. Add in things like natural gas liquids, biofuels and processing gains at refineries and that number increases.

"By 2013, we'll probably be a little over 11 million barrels a day," says EIA administrator Adam Sieminski. "That puts you pretty close to Saudi Arabia's" production of more than 11 million barrels a day, he says.
In which regard it might be pertinent to note that some of the crude produced in the Kingdom of Saudi Arabia (KSA) will be refined in the US, providing refinery gains here, and further distorting the comparison. Ah, well!

The current production gain in the US has resumed, after a short plateau, although the gains following the shut-ins for Hurricane Isaac seem to be leveling off.


U.S. Crude Production through mid-October 2012 (EIA TWIP)

The information in the October Monthly Oil Market Report from OPEC, show that crude oil production from KSA is running at 9.85 mbd, as reported by other sources.


Figure 2. Reported production from the OPEC nations through September 2012, as reported by others (OPEC MOMR)

When one looks at the production that KSA itself is reporting the numbers are slightly reduced.


Figure 3. Reported production from the OPEC nations through September 2012, as they reported to OPEC (OPEC MOMR)

While the comparison of the two levels of crude suggest that the US has a long way to go in matching KSA crude production, the two sets of figures also point to the answer to another question.

Looking at the figures for Iran, it is clear that the sanctions which have been imposed on that country by the West are having a serious impact. Not only is this seen in the fall in oil production, likely around 1 mbd, but in the more consequential cut to exports this fall is reflected in a $7 billion reduction in income. Iran has just started to admit that this bite in their export market is hurting production. And it is only now that they recognize that this will further fall, though they are now also threatening to carry this drop to its ultimate conclusion, and to stop exports entirely. An immediate impact to this would fall on Turkey, which has cut oil imports from Iran by about 20%, but which has a six month exemption from the full impact of the sanctions. It is currently importing around 200 kbd of crude. Some of the value of that oil is apparently returning to Iran as gold bullion, which can be easier to spend.

However the primary question might well be, if world oil markets are so tight, how come taking a million barrels out of production hasn’t had a more significant impact? And the answer to this comes in part because of the increase in production from KSA (Note that a year ago the country was producing around 500 kbd less than it currently is), and also from the gains in production from the United States. (As shown in Figure 1).

Further, given that the global economy, though regenerating from the depths of recession, is still not operating at levels sufficient to bring unemployment to more normal levels, overall demand also remains below what it might be.

Since we live in a global economy the problems of Europe and America are reflected in a reduced demand for goods from China and other Asian countries, which impacts the energy demand from factories. China has been taking some 40% of the Iranian export. OPEC has noted that Chinese demand has declined, and that part of this decline has been through an 18% reduction in imports from Iran. Interestingly this was partially made up through an increase in imports from Iraq.


Figure 4. Change in Chinese petroleum imports over the past year (OPEC MOMR )

One of the threats that Iran has made it that it will shut down its exports completely. The country was initially exporting some 2.3 mbd before sanctions occurred, and sanctions have dropped this already to around 860 kbd. Of this 200 kbd are going to Turkey, but this is a country with pipeline connections that give it options. There is a pipeline running from Iraq, the Kirkuk- Ceyhan connection which carries 300 kbd, and was briefly damaged by fire in August; and, more famously, there is the Baku-Tiblisi-Ceyhan pipeline from the Caspian. This can carry 1 mbd of crude, and having run 190 mb through September this year, it is running not quite full.


Figure 5. Oil and Natural gas pipelines through Turkey (Journal of Energy Security )

In short, as with the suggestions mentioned the other week, that Iran might seek to challenge Qatar in going into the natural gas LNG market, the threat this week that it might shut off exports of crude seems to be likely only geared for domestic consumption.

The global demand at present is not such that the Iranian supply is critical to ensuring a balance at an acceptable price between supply and demand. It would seem that the global economy would need to regenerate further, and for North American and KSA to reach some form of current peak in production against that potential of rising demand before this balance is threatened. But, in consolation to Iran, resting oilfields can sometimes help in terms of their longer-term production (as KSA have practiced for years).

Read more!

Thursday, January 5, 2012

Alaska, diesel, refining changes and Venezuelan exports

The Iditarod dog-sled race commemorates the time in 1925 when serum had to be carried from Anchorage to Nome to counter a diphtheria outbreak and dog sleds were the only way of making it through. A different problem is now beginning to face some of the remote villages in that state, as it becomes more difficult and expensive to supply fuel reserves to get them through the winter. With supplies restricted and expensive to deliver, prices can rise as high as $7.15 a gallon, gasoline was $5.44 in Nome earlier this winter. I was reminded of that this morning, as the Russian tanker, the Renda, turned back for minor repairs before essaying the trip from Dutch Harbor in the Aleutian Islands to Nome carrying a million gallons of diesel fuel (which powers the electric generators) and 400,000 gallons of gasoline. The fuel would normally have gone by barge earlier in the winter, but storms led to that delivery being cancelled. Now the tanker is being escorted by an ice-breaker since the last 300 miles of the 700 mile voyage will be through ice that can be 2 ft thick.

In other Alaskan news the November figure for oil flow down the Alaskan pipeline averaged 625 kbd, which gets the flow above the 600 kbd level which becomes a concern in winter, since it can lead to ice and wax build-up in the pipe. The December figure should be released soon.
UPDATE: As of January 9th the Renda is 140 miles from Nome, but is finding it hard to make progress through the ice, which is under considerable pressure. The "dynamic ice" has brought both vessels to an occasional halt, and the ice is thickening.

UPDATE 2: The ice has been more than 4 ft thick in places, and pressure is closing the passage some times before the Renda can make it through. It is difficult enough that the 2 vessels took a 12-hour break on Sunday night. They made 53 miles of progress on Monday, with 100 miles still to go.

Positiion of the ships (the icebreaker is the Healy) relative to Nome at 5 pm Tuesday (Central time)

Diesel fuel prices in the rest of the country are continuing to fall, as the latest TWIP notes, although at $3.70/gallon on average the price is still some $0.50 per gallon higher than last year.

Change in Diesel prices (EIA )

The US is producing around 5 million barrels of distillate (diesel) a day, up almost half a million barrels from last year, with domestic demand running around 4 million barrels. The remaining million barrels is being exported, largely to Europe and Latin America. The EPA requirement for cleaner diesel in the US has, as a perhaps unintended consequence, brought the fuel into compliance with European usage, and opened that market to the industry. Coming at a time when Russia is seeking to lower exports of low-sulfur diesel in order to keep domestic prices down, as the Export Land Model bites again, and with China banning exports, US exports have risen to exceed fuel imports.

Increasing exports is a move of necessity for some refineries since the continued decline in domestic demand for gasoline is hurting refineries. Sunoco, for example, is getting out of the business.

Decline in US gasoline demand over the past two years (EIA )

Note that there hasn’t been as much change in the domestic diesel market.

Demand for diesel in the USA over the past 2 years (EIA )

In fact Valero, one of the Gulf refiners, projects that the diesel market will continue to grow more strongly than that of gasoline.

Anticipated world growth in demand for gasoline and diesel (Valero Investor Presentation 2012 )

It has, as a result, been suggested that the additional diesel which will be generated should the Keystone XL pipeline be approved, will largely go to export. It has been pointed out that the Valero Refinery is in a Foreign Trade Zone, the diesel that is refined and exported will not pay taxes on it.

Export Market for diesel (Oil Change International )

Exports from the Valero Refineries (Valero Investor Presentation 2012 )

In passing I noted that Valero also seems to be doing well with its ethanol operations.

Recent income from ethanol for Valero (Valero Investor Presentation 2012 )

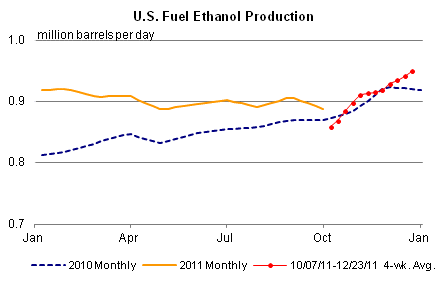
In the past 30 months Valero note that the EBITDA reached 90% of the purchase price of the 10 plants it runs, and which produce an average of 72,000 bd collectively. Collectively, in the USA, ethanol production has continued to increase.

US ethanol production (EIA )

And there was one final graph from Valero that I almost missed, but which is, in its way telling:

Venezuelan exports to the USA (Valero Investor Presentation 2012 )

It should be noted that this plot is just for refinery products, and that Venezuela has continued to export oil to the US over the past year. However the figures for the 4th Quarter show an average of 793 kbd, down 9% on last year, and the three monthly averages were October 916 kbd; November 748 kbd and December 715 kbd all significantly down on last year. In 2010 the US imported an average of 1.24 mbd, about half of Venezuelan production, but since Venezuela has fallen to become the fourth largest supplier to the USA with the average of 760 kbd much of the remaining Venezuelan production goes to China, and India. But should Venezuela continue to decline in overall production, that global shortfall will need to be made up from somewhere else.

Read more!

Saturday, November 19, 2011

More pipelines reverse flow as US demand falls

A recent post covered the plan to reverse the flow of oil along the pipeline that runs sensibly from Detroit to Portland, ME (Or if you are Canadian, since it actually runs most of the way through Canada, from Sarnia to Montreal and beyond). The move is one way of distributing the increasing flows of oil that are being extracted from the oil sands of Alberta, to take advantage of existing pipelines and to meet distributed diemand.

And while the plans for the Keystone pipeline are currently on hold, there is another pipeline which is also being reversed. This is the Seaway pipeline and it runs from Freemont TX to Cushing, OK. It can carry some 400 kbd of oil, and the intent is to have to reversal completed by 2013. This will get around some of the bottleneck that has been building at Cushing, and move more crude down to the refineries along the Gulf. The hope is that it will allow domestic oil to replace some of the crude that is currently imported to those refineries, as domestic production rises to an estimate of 6.4 mbd by 2016. (With that additional rise of around 0.7 mbd from Alberta still, hopefully, coming down to the Gulf Coast as well, by 2015). It is expected that the first 150 kbd may flow by the second quarter of next year.

There are also plans to reverse the flow and increase capacity to 225 kbd with the Longhorn pipeline that runs from El Paso to Houston to carry Permian Basin oil to refineries, by 2013.

Changes planned for the Longhorn pipeline (Magellan)

As these moves are planned, it is worth noting that the demand for gasoline has been falling in the US. This is evident from the latest EIA TWIP. The fall has been as much as 500 kbd, which is significant.

Changes in U.S. gasoline demand (EIA TWIP )

It has even caught the attention of OPEC, in their latest (November) Monthly Oil Market Report, which contrasts the fall over two years, showing the drop from pre-recessionary times. (The peak was 9.6 mbd). OPEC sees overall US demand falling 0.11 mbd in 2011, and only picking up by that amount in 2012.

Fall in summer driving demand for gasoline (OPEC Nov 2011 MOMR)

In passing the MOMR also notes that Russian production of passenger cars rose 46% y-o-y, which may mean that export volumes may fall more rapidly than currently anticipated. Oil consumption in the countries of the FSU is reported at 4.2 mbd, a gain of 0.1 mbd y-o-y. (Sales of U.S. vehicles were up by 10%. ) Their current projections, recognizing the economic problems of Europe, is that world demand will grow to 89 mbd next year, with half of the 1.2 mbd increase coming from Asia, and 0.48 mbd coming from China.

Turning back to the change in driving habits in the United States, the recovery – as evidenced by vehicle miles travelled - faltered and fell back earlier this year, showing the inherent problem still resident in the U.S. economy.

Rolling 12-month average of the vehicle miles travelled on all roads in the United States, through September 2011 (FHWA )

Current declines are seasonal and see to be following the patterns of previous years.

Urban travel on US highways, by month (FHWA )

However there are reports of healthier numbers now coming out of the U.S. economy, and so hopefully, these trends will turn around.

Read more!

Monday, November 14, 2011

The Keystone pipeline - A Canadian response

Well that didn’t take long! (With a hat tip to Art Berman). I mentioned at the end of the last post that the loss of the oil market through postponement of the Keystone pipeline would not sit well with Canada. The delay in the pipeline removes at least temporarily sales of some 600 kbd of Albertan crude from the Canadian inventory, with the concomitant losses to provincial and national government revenue.

Speaking in Hawaii, the Canadian Prime Minister (who met with the Chinese President while on the island) said:
“This does underscore the necessity of Canada making sure that we’re able to access Asian markets for our energy products, and that will be an important priority of this government going forward,”
And to emphasize the point, while the Canadian Finance Minister has noted that the pipeline plan itself might not survive the delay. TransCanada Corp, who were to operate the pipeline has to retain its customers, even as the Finance Minister flies to China to market energy exports, and perhaps sell the available supply to China. And in the broader scheme of things:
Canada will seek to join a new Asian trade block as it tries to increase energy exports to the region following the U.S. decision to delay approval of TransCanada Corp.’s $7 billion Keystone XL pipeline, Prime Minister Stephen Harper said.
To recap from the earlier posts in the OGPSS series on Canadian pipelines there are plans by Enbridge to build a “Northern Gateway” pipeline from the oil sands to the West Coast. And this has already found support from China. Given the irritation that the United States has just provided the Canadian Government it is worth repeating the comment by the President of Enbridge:
I challenge any of you to name one other country in the world that only has one market for its largest export. Right now our most valuable resource is landlocked in North America and isolated from the world market. That means it is often isolated from world price. The August spread between West Texas Intermediate and Brent Crude, the world price, was $22 per barrel. Canadian heavy crude has more often than not sold at a discount to U.S. light crude that goes well beyond the quality differential – simply because of lack of market.
It should not be forgotten in this debate that the greatest objection to the pipeline seemed to come from Nebraska. Lest you forget Nebraska is the largest producer of corn ethanol west of the Mississippi River. It has 34 ethanol plants, converting 769 million bushels of corn a year into 2 billion gallons of ethanol. (The equivalent of 130 kbd out of the national production of around 900 kbd).

Official map of the planned pipeline from the Department of State.
TransCanada Keystone Pipeline, LLC (Keystone) is proposing to construct and operate a crude oil pipeline from Hardistry (Alberta), Canada to Patoka, Illinois (view map of project). The pipeline will be able to deliver 435,000 barrels per day (bpd) of crude oil to existing terminals in Missouri (Salisbury) and Illinois (Wood River and Patoka). The system capacity could be expanded in the future up to 591,000 bpd.

The proposed project includes 1,073 miles of new pipeline in the U.S. (Keystone Mainline). The Keystone Mainline will be comprised of 1,018 miles of 30-inch diameter pipeline from the Canadian border to Wood River, Illinois and 55 miles of 24-inch diameter pipeline from Wood River to Patoka, Illinois. Keystone may also construct an additional pipeline segment from near the Nebraska-Kansas border to Cushing, Oklahoma consisting of 291 miles of 30-inch diameter pipeline.


Read more!

Monday, October 3, 2011

OGPSS - Pipelines and Eastern Canada

I wrote, last time, about the projected pipelines that are being anticipated to take advantage of increased production from the oil sands in Alberta, Canada with the intent that I would use that to lead into a review of the oil sands operation itself. However Gail has raised the issue of the proposed reversal of the pipeline (Line 9) that runs from Sarnia in Ontario to Montreal so that oil would flow to the Suncor refinery in Montreal, rather than the current flow which runs the other way. (Sarnia is right by Detroit). The pipeline reversal is planned to continue beyond Montreal, to include reversing the flow of a supply pipeline from Portland, ME so that the oil from Alberta might also supply northern New England. The project has been called “The Trailbreaker” and had been postponed two years ago when demand declined.

The overall question of the relative role of exports and imports on the Canadian oil supply equation was also raised in comments on the previous post. As a result I am going to look a bit more into the overall Canadian picture, and particularly that in the East Coast, and will postpone the oil sand piece a week (sorry Neil). To begin it helps to look at the current projects that Enbridge have in mind for pipelines.

Overview of the Enbridge planned pipeline projects (Enbridge)

The Ozark pipeline, which is shown running from Cushing to Wood River was closed on Friday, Sept 30th, when the pipeline was found to be exposed as it ran across the bottom of the Mississippi River. It carries around 240 kbd and the shut down is precautionary, since there has been no leak detected.

The dark green arrow from Cushing to Houston will be known as the Wrangler pipeline and would carry up to 800 kbd from Cushing to the refineries along the Gulf, competing with the Keystone XL, which is planned to bring an additional 500 kbd down from Alberta (about 500 kbd flows through existing connections). The intent is to move the oil away from Cushing where it is proving to be a bit of a glut.

With this surplus, and the ability to move oil around the Mid-West, the need for additional feed down from Montreal dissipates, and thus the argument for the reversal of flow so that crude from Alberta can be sent back up that pipe to the refineries in Eastern Canada. At present oil comes by tanker to Portland, ME and then enters the Portland-Montreal Pipe Line (PMPL) system. The oil flows through either an 18-inch or 24-inch line up to Montreal, a distance of 236 miles, with flow then continuing to Sarnia. A certain increase in energy security would thus be achieved for the East Coast of North America, if the oil refined on the East Coast was produced in North America, instead of coming from Russia and the Middle East. At present flow would be reversed in only one of the pipes, the 18-inch, coming from Portland. At present some 200 tankers a year offload in Portland, and send around 95 kbd up to Montreal. (The pipeline came into being in 1941 to avoid exposing oil tankers moving into Quebec to U-boats).

Portland Montreal Pipe Line (Wikipedia)

If one looks at the overall flows of oil in Canada, the increasing reliance on Albertan oil can be appreciated.

Flows of Canadian crude oil in thousand cubic meters/day – (multiply by 6.3 to get kbd) in 2009 (Canadian NEB)

Canadians consume around 1.5 mbd, of which half is gasoline, and 30% diesel. I discussed their exports in the last post.

Interestingly the largest exporter of gasoline from Canada to the US lies further East, where it comes from the Irving Oil refinery in St John New Brunswick with the 300 kbd refinery shipping 75% of the gasoline it produces into the Eastern United States.

There are two other refineries in the region, the Dartmouth refinery at Halifax in Nova Scotia refines 82,000 bd of crude, largely for the Eastern provinces of Canada. The crude is off-loaded from tankers, refined and then loaded onto smaller coastal tankers for delivery.

Yet further East is the Come by Chance refinery, now the North Atlantic Refinery in Newfoundland. In its time it was one of the largest bankruptcies in Canadian history, but it now refines some 115 kbd that arrives in 320,000 ton tankers at the nearby ice-free port. It suffers from that bankruptcy in that a subsequent sale was commensurate on the product not being sold in Canada (outside of Labrador and Newfoundland), which means that the products largely ship to the United States.

Yet one must go even further East to find the oil fields of the Eastern Canada Sedimentary Basin. And unfortunately while the nearest refinery might be near an ice-free port, the fields themselves are not.

Eastern Canadian Sedimentary basins and hydrocarbon fields (Center for Energy )

The fields include White Rose which is expected to yield around 230 milllion barrels, at around 120 kbd, with a life of 12 – 15 years. First oil was in 2005.

Terra Nova is estimated at 406 million barrels. With a production of around 125 kbd it is anticipated to last 18 years. Production began in 2002.

Seasonal floating ice in these parts varies from 1.6 to 5 ft thick and an average wind speed of around 20 mph. also leads to ice buildup on the tankers and superstructure making it a consideration in operations, as are icebergs. (Remember the picture of the tug pulling an iceberg). That was taken around here.

Hibernia is also producing at around 126 kbd, and by August 2010 had produced 704 million of the 1.4 billion potentially recoverable oil from the field, Approval has now been given to extend development to the south.

Current plans to develop Hebron, some 6 miles N of Terra Nova include also the fields of West Ben Nevis, and Ben Nevis. Production is expected to begin in 2017, at a rate of around 150 – 180 kbd of oil and 200 – 350 kbd of water. Reserves are considered to be in the 400 – 700 mb range.

Although these numbers are significant, and will provide for a considerable fraction of the need in this part of the world, and further south, they do not constitute the promise of sustained increased levels of production that are required for significant help against the declining production seen in many of the worlds major oilfields. For some help in that direction it is necessary to head West. And so it is time for the review of the oil sands.

There is however, considerable controversy over the operation of the oil sands in Alberta, particularly from those objecting citing the mess that is made of the landscape. In general the illustrations of oil sand operations that are used, show the site during mining, where the black color of the sand tends to make for a dismal picture. It might be more informative to show what the sites are like afterwards. And so, as a prelude to more discussion, here is a photo of some reclaimed land. It is here that the wood bison (as opposed to buffalo) roam.

Reclaimed land after the oil is removed from the sand (CAPP )


Read more!

Thursday, September 29, 2011

OGPSS - Pipelines through Canada

If one looks at the countries that are major importers of oil into the United States, Canada currently easily tops the list exporting 2.085 mbd of crude (2.524 mbd of total petroleum products) for example in June. Interestingly Saudi Arabia was in second place at 1.164 mbd and Mexico had fallen to third place at 1.108 mbd. In light of the countries that used to occupy places on earlier lists and no longer do, it is worth noting that places such as Chad and the Congo are now on the list.

Top 15 countries sending crude oil to the United States in June (EIA )

Since that summary review Canada has gone on to post some of the highest volumes of the recent past:

Weekly imports of crude from Canada into the United States (EIA)

This increase has occurred as the amount imported from Mexico has seen some of its lowest numbers.

Weekly imports from Mexico into the United States (EIA )

The numbers suggest a growing importance for that oil coming from the North. It was, for example, interesting to note that in the recent report reviewing available United States oil and natural gas, authored by the National Petroleum Council, (which I discussed earlier) and which had Daniel Yergin as Vice Chair, that Canadian oil has begun to get counted with that of the United States in the more generic classification of North America thereby acting as an anticipated aid in solving some of the “domestic” supply problems in the near future. Following that report, Dr Yergin wrote an article in the WSJ denouncing the idea of peak oil. Euan Mearns has provided his usual detailed and well-argued rebuttal to this (as does this entire series) so I will not go into that further at this point.

I briefly looked at Canada when I was writing the earlier summary posts on the top 30 producers in the world, Looking at the reported and projected production for this year, production is anticipated to steadily climb once the summer months have passed.

Production of Crude Oil and Equivalent in Canada in 2011 (Canadian National Energy Board)

The increase reflects a steady increase in the component from Western Canada, which started the year at 91% of the total, but is anticipated to reach 93% by the end, largely on the basis of an increase in production from the bitumen of the oil sands.

In passing it should be noted that not all the oil that will come from Canada necessarily started there, since, for example, there is currently a move to lay a pipe that would carry oil from the Bakken formation in North Dakota and Montana through Saskatchewan to the Enbridge terminal in Manitoba, and thence to refineries in the United States. Further not all future Canadian oil exports can be assumed to come to the United States. Two pipelines also being proposed are to run the 727 miles from Bruderheim, Alberta to Kitimat in British Columbia. The first of these would carry an average of 525 kbd west, while the second would transport back some 193 kbd of condensate, which would help to thin the crude going through the larger pipeline. Not surprisingly this $6.6 billion project is getting considerable support from China.

Not that this would be a totally new investment by China in Canadian oil,
Earlier this year, for example, five companies signed up for so-called firm service, or guaranteed access, to a portion of the Trans Mountain pipeline, which carries oil from Edmonton to a port at Burnaby, B.C. Among them is PetroChina International (America) Inc., a subsidiary of Chinese energy giant China National Petroleum Corp.
The investment is not just in the pipelines to get the crude to China, there has also been a growth of Chinese acquisitions of shares in the companies extracting the oil. Recognizing that, in contrast with many exploratory operations, the presence of the oil in Alberta is much more certain, the risks of investment are reduced and a return, or in this case the oil itself is a much more certain outcome. As a result there are now more Asian companies entering the oil sand business.

It is not unwelcome news in Canada. Bear in mind that at present 99% of Canadian oil exports go the United States, and as the President of the Enbridge Northern Gateway noted recently:
I challenge any of you to name one other country in the world that only has one market for its largest export. Right now our most valuable resource is landlocked in North America and isolated from the world market. That means it is often isolated from world price. The August spread between West Texas Intermediate and Brent Crude, the world price, was $22 per barrel. Canadian heavy crude has more often than not sold at a discount to U.S. light crude that goes well beyond the quality differential – simply because of lack of market.
In perhaps the same way as they acted to provide a second market for the natural gas of Turkmenistan (other than Russia) thereby allowing the Turkmen to be able to sustain higher prices, so now they can, to some eyes, be seen to be riding to the rescue of Canadian prices.

And then there is the controversial Keystone XL pipeline set to run from Alberta down to Houston and refineries south, and which is generating some high-level opposition.

Planned route for the Keystone pipeline

There are some current indications that the State Department will approve the pipeline, permission needed since it crosses an international border. It may not hurt those chances that the chief lobbyist for TransCanada was, apparently, the deputy manager of Secretary Clinton’s 2008 campaign. The latest step by the opposing forces has been to challenge the permit that TransCanada has to carry out construction on the Canadian side. Apparently the delays that are holding up the start of construction of the 700 kbd pipeline have carried the project beyond the year during which TransCanada had permission to start construction, without such construction beginning. On the other hand TransCanada are pointing to preparations for river crossings and the laying of foundations for oil storage tanks as evidence of such construction.

It is expected that with this increased demand production from the oil sands will double by 2020. This expansion is not without demands of its own, since the use of natural gas in the mining process (see earlier posts) will lead to an increase in demand from 1.1 bcf to 3.0 bcf to help in that production gain. And so I will take another glance at the plans for the oil sands in the next post in this series.
.

Read more!

Tuesday, February 8, 2011

The Sundering of Sudan - it may increase oil production

The disruption that began in Tunisia is continuing in Egypt, with changes also starting in countries such as Jordan and Yemen. And in the midst of this turmoil, the (finally) democratically dictated separation of Sudan into two separate countries is moving towards the July 9th separation date. At that time Southern Sudan will divide from the North. Sudan has only been selling its oil on the world market since 1999 and the transition will impact those exports.

With the hopeful end to the conflicts in the country, there is also now an increasing possibility that the oil and natural gas resources of the two new nations will be developed. Until recently China has been the most active player in the region, but as the results of the vote have become apparent, Russia too is indicating an interest.
Like other players in the world oil market, Russia would like to promote its energy interests in that region. Moreover, it is capable of becoming a serious competitor for both Western and Chinese companies in oil production and power supply. Russia’s clear competitive advantages are its technological experience in developing oil fields in many regions of the world, its investment potential and the absence of any political conditions for energy cooperation. The latter is important both for Khartoum and Juba, the current administrative centre of South Sudan, because after the referendum both sides will have to reconsider the criteria of their independence.


Map of Sudan (United Nations ) The blue tone marks the bounds of the South Sudan States.

The EIA notes that in 2009 oil was the major revenue generator for the country, bringing in more than 90% of foreign earnings. Within the country the primary energy source is that of combustible renewables and waste, reflecting the rural, non-electrified population of much of the country. And although BP (as reported by Energy Export Databrowser) suggests that virtually all the oil it produces is exported:

Oil statistics from Export Data Browser, based on the BP review.

The EIA find that there is a significant, and growing, domestic market, that uses a significant percentage of production. Various estimates of the size of the export market (for reasons given below) hover around the FT estimate of around 500,000 bd.

EIA statistics on Sudanese oil production.

The EIA note, as is shown on the graph above, that production and exports developed after a pipeline was run 1,000 miles from the oil fields up to Port Sudan. And it should be noted that while about 75% of the oil reserve (perhaps 6.5 billion barrels) is mainly in the South, that port (map above) is in the North. And as European nations in particular, but also those of the FSU, know from the past, those who control the pipeline can often remain in a position of power. The previous arrangements and actual distribution of funds have been viewed with some suspicion.
Much of this is due to the opacity with which Khartoum's captured state machinery operates, siphoning as much as 40% of total oil revenue through various forms of mispricing. Meanwhile, though the Comprehensive Peace Agreement (CPA) of 2005 established that 50% of revenues must be remitted to the Government of South Sudan (GOSS), this share is determined not by volume but sales. Khartoum markets the oil nearly exclusively and determines price as well as volumes exported, with little or no independent monitoring. According to U.K. watchdog Global Witness, major discrepancies of between 9% and 26% have been documented, underpaying the GOSS by as much as $700 million. Little is known of the $7 billion in oil revenues remitted to the South as accountability mechanisms were never factored into the CPA.
That initial agreement is set to expire this July. The pipeline supplies oil to two refineries (at El Obied and Khartoum) that supply the domestic market.

Current pipeline and bid blocks in Sudan (USAID )

One thing that may change this is the construction of s second pipeline, running from the South to Mombasa in Kenya. This would also feed a new refinery proposed for Lamu, which is near Mombasa. However the pipeline would be 870 miles long and have to go uphill to get into the Kenyan highlands, making it quite expensive. An extension of a railway line has been suggested as an alternative. But it now appears that the rail link will go through Uganda, rather than directly to Lamu.

Possible oil routes South from the new capital at Juba.

North Sudan is currently producing about 100 – 110,000 bd of Sudanese total production, but it hopes, by increasing production from the Balila oilfield in South Kordofan from 60 kbd to over 100 kbd, among other gains, to raise this level to 195 kbd by 2012. It has also been exploring for oil offshore in the Red Sea.

Meanwhile exploration in the South is expected to increase, and there are hopes that production might increase to 2 mbd by 2015, from their current estimated production of 450 kbd.

Conditions in the South however are not currently ideal for oil production, even for the Chinese
He said trucks bringing in fuel vital to operations were stopped at 12 illegal checkpoints on one 200km stretch of road alone, each time being charged $300. Waste oil has been set ablaze and workers kidnapped, he added.
These conditions may make China less likely to invest at the scale required for the new transport network. On the other hand China is but one of several partners in production.

For while China has a 40% interest, Malaysia has a 30% interest, and India in 3rd place with 25% in the current production company. And with the Russians expressing interest, who knows what may transpire.

Read more!