Showing posts with label gas shales. Show all posts

Thursday, August 11, 2011

OGPSS - North Dakota and the Bakken shale

Nick has pointed out that the chart I used last time, in writing of the production in the deep waters of the Gulf is out of date. North Dakota is heading for second place behind Texas, having passed Oklahoma, and has the ability to pass Alaska in a few years. In May the state was averaging a production of 361 kbd of oil, and 361 bcf of natural gas, from a total of 5,570 wells (all three figures being all-time highs). Gas flaring, at the moment, is at around 29%. The current rig count is at 183 and also an all-time high. So where is all the excitement? It is not in shallow gas given that, as the Director of the Department of Mineral Resources has noted::
North Dakota Shallow gas exploration is not economic at the current price.
The answer lies in the Bakken and Three Forks with rigs that can drill more than 20,000 ft being the most actively employed. The Bakken has already been discussed in an earlier post at The Oil Drum and I don’t really want to repeat much of that information, and so this presentation will, perhaps, rely a little more on visuals. The Bakken and Three Forks partially lie in Western North Dakota, and the Department of Mineral Resources (DMR) for the state, has shown how the total Original Oil In Place (OOIP) estimates vary from county to county within that region.
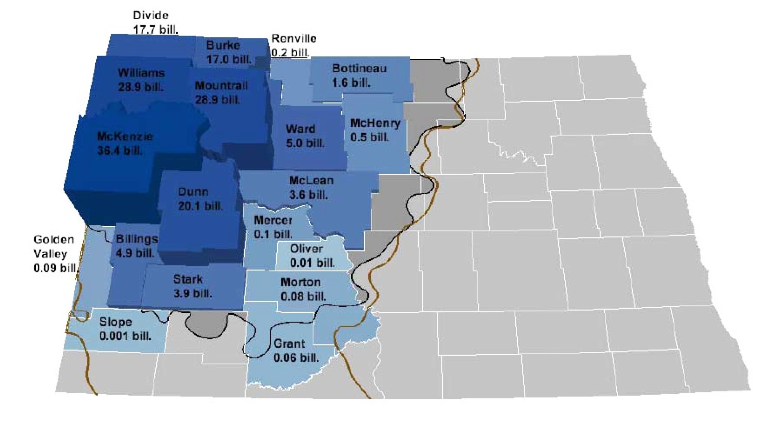
OOIP estimates by county (North Dakota DMR)

The state has also produced some three-dimensional models of the formations in the region around Williston, which is where some of the most productive wells are found.

Region of North Dakota that is modeled. (ND DMR ) The sides of the square cover 135 miles.

By developing the model it is possible to look both at the section showing the location of the productive beds in the region. Since the Department covers other valuable minerals beside oil and gas, they are also shown in the section:

Section through the ND geology (ND DMR )

The Bakken lies at a depth of around 11,500 ft with the additional need for rigs to drill 20,000 ft coming from the use of horizontal drilling along the formation, which is typically only around 150 ft thick. One of the advantage of the model is that it can be used to generate a view of the Bakken itself, with the overlying ground removed. This also helps show that, while the above section shows the beds lying in a syncline, where oil might be expected to migrate out and up the sides away from the central dip, there is a central anticline where oil could be trapped, and the structure is not smooth. (Bear in mind also the scale of the model, so that small traps in the field are not picked up at this level. ) The structure of the shale beds themselves also make it less sensitive to geological modifications which drive oil migration, though obviously not completely or else there would be little oil flow to the well.

Model of the Bakken formation around Williston (ND DMR )

The dominant feature that runs relatively North-South through the center helps then explain the location of many wells drilling into the reservoir.

L:ocation of wells in the modeled region of North Dakota (ND DMR )

While the formations have been known for some time it was only with the development of horizontal wells, and fracking capabilities, that the opportunities to extract the oil became viable. To borrow a picture from that earlier post by Piccolo (H/t Gail)

Change in Bakken production with the introduction of horizontal wells and Fracing (TOD)

As the number of horizontal wells has grown one finds, as I noted above, that 20,000 ft of drilling will include perhaps 9,000 ft of horizontal well in the formation itself. Such a well, as for example the Credo Petroleum well that is cited, may initially produce 1,267 bd of oil and 1.24 mcf/day of natural gas.

However one of the concerns that has been expressed, both by Art Berman, and later myself, has to do with the long-term production rate from long horizontal, frac’ed wells in shale, and it is therefore instructive to see the information that is now available on a typical well, which has been compiled by the ND DMR.

Typical Bakken well production (ND DMR )

At the time of the presentation (last year) there was still a large proportion of the gas being flared.

Gas flared as a percentage in ND (ND DMR )

Since then, as I noted at the start of the piece, the amount flared in May of this year has risen to 29%.

There is a more than adequate array of pipelines to handle the fuel that is being produced, at the moment it is the oil that is the critical, and valuable component. But even with a projection that the state will see about 2,000 wells a year being drilled over the next few years, with the expectation that the field will last some 20 years, the overall production is not expected to increase much beyond the levels that it is now attaining. This is because of the relatively rapid drop in well production, for which there is now a considerable data base. That doesn’t stop some from projecting, however, that the field can increase in production to levels as high as 1 mbd or so. That would, of course, include production from Montana and Canadian parts of the Bakken, which I have not discussed here.

One point that should be noted is that the lease rates for Bakken in North Dakota are quoted as being around $7,000 to $8,000 per acre, while those in Montana are reported to be considerably less. To date there has not been that much activity in Montana, though with time this will change. Already permit numbers are rising, and there has been some success to equal that in North Dakota.
Brigham Exploration, one of the most aggressive in Montana, recently unveiled five wells there ranging from 909 boe/d to 2,962 boe/d, the latter volume a "record for the state," Pritchard said. The five wells averaged 1,579 boe/d.

At present, however, most of the rigs (170 to 10) remain on the North Dakota side of the border. That too will change, with time.

Overall the Bakken is likely to see further increases in production as the areas being drilled expand, but with the relatively short life of the well at significant levels of production, it is harder to see the higher levels of production overall that others have cited, and one also has to remember that is often the sweetest spots that get drilled first.

Read more!

Sunday, December 12, 2010

OGPSS-When oil isn’t crude and gas isn’t gas, the Eagle Ford Shale play

There are two figures that keep cropping up when folk write about the production of oil, one number is the daily flow rate for crude oil, and while the EIA report that the peak production year to date was in 2005, when the world produced 73.72 mbd, the IEA have reported that the peak occurred in 2006. Yet just last week the IEA raised their forecast for next year’s oil demand to 88.8 mbd and there is about 15 mbd difference between the two numbers. So you might ask what causes this, where do these additional liquids come from and what is their future, relative to that of crude alone.

Part of the answer comes from what are known as refinery gains, the fact that when you crack a high-carbon crude into lower carbon products in a refinery then there is a gain in volume. In Oil 101 Morgan gives this processing gain in volume to be around 2.2 mbd. In addition there is the rising level of bio-fuel production, about 900,000 bd of ethanol in the US alone, for example. But the largest volume comes from the liquids associated with the production of natural gas.

These are collectively described as Natural Gas Liquids (NGL) and condensate. Simplistically, when natural gas comes out of the reservoir it is not always what is referred to as a dry gas, but rather can often contain a number of other constituents in the fluid flow. The NGLs are normally a combination of ethane, butane, isobutene, propane and natural gasoline and are normally combined with other light hydrocarbons that condense out of the fluid flow at the surface, when pressures and temperatures fall from those in the reservoir. These additional fluids are the ones generally called condensates, as a result. (The NGL's need a little pressure to re-liquefy). NGL total volume is about 8 mbd. Now to make life somewhat more complicated both oil and gas can come out of the same well at the same time in a admix that can include all of the above. And that requires that they be separated, but that is a topic for another day or two. Today I want to give an example of the importance of those liquids that lie between crude and natural gas.

These mixtures can be more important, depending on the relative composition of the flows that are then obtained. Consider, for example, the Eagle Ford shale, the new field that is being developed in Texas, where wells that are to be drilled into the gas shale are now touted for their liquids content, rather than for the natural gas that they are more commonly anticipated to produce. When the field was first drilled, back in 2008, the initial well flowed with natural gas production of 7.6 million cf/d and there have been some 944 permits for wells as and of last week.

Wells in the Eagle Ford Shale Texas Railroad Commission

However it is not just the surface location of the wells that has to be considered. And if those of you with more knowledge will forgive the repetition, I need to just give a short paragraph of explanation about where oil and gas originally came from. Very simplistically they come from algae that flourished in the oceans of the time, somewhere between 65 and 500 million years ago. The algae contained some lipids (an oil precursor) as do those of today. As the algae died their bodies fell to the seabed where they accumulated in layers, along with the sediment that collected with them. Over time that nascent rock was buried deeper in the Earth’s crust and as it did the pressure and heat slowly changed the lipids, initially into oil. However if the rock was carried deeper, then the oil was further cooked and became natural gas. The process has been illustrated at the oil and gas geology website where I got this illustration:

Transition from lipids to oil and then gas over time and depth of burial ( Oil and Gas Geology )

As a rough rule of thumb down to 15,000 ft the hydrocarbon is more likely to be oil, (which is thus referred to as the Oil Window) and below that it is more likely to be gas. That is only a rough rule of thumb, and one must remember that over time there has been a lot of uplifting and eroding, so that 15,000 ft isn’t necessarily what it used to be.

And the Eagle Ford shale is a fairly good example of this. If we use the EIA map of the play you can see that in the North, where the reservoir is about 6,000 ft deep the hydrocarbon is oil, while further South, where the deposit is down at around 14,000 ft then the hydrocarbon is dry gas. And in between it is what is known as a wet gas.

Eagle Ford play showing the depths to the reservoir and the nature of the hydrocarbon (EIA )

You will also see that the majority of the wells are in the wet gas/condensate section of the field. As a result, when we look at the amount of the different fluids that have come from the field in the two years of major production to date, we get the following plot. And to make it, I have made the simple assumption that 6,000 cubic ft of natural gas is equivalent to a barrel of oil (which I call the Apache number )

Fluids produced from the Eagle Ford shale (Texas Railroad Commission )

You may note that the condensate from the wells in the wet gas zone have produced around 2.3 million barrels, while there has only been about 1.6 million barrels of crude produced. It is also worth noting that while the natural gas coming from the formation has been twice the equivalent volume of oil, the market for natural gas, at the moment is still down at around $4.6 per kcf, which using the Apache conversion, would give it a price of around $27.60 a barrel of oil equivalent. On the other hand the condensate is a light high quality product, and West Texas Intermediate crude is running at the moment at around $88.30 a barrel. (EIA last Natural Gas Weekly ) You should also remember that these are not the retail price for the products – natural gas in Florida, for example, was given as $10.56 per kcf, while it is around $9.81 in New York (ibid).

The current excess of natural gas over supply, which is likely to continue through at least next year (and which I will discuss in more detail in a number of future posts) will likely keep the price of natural gas down around the $4 figure through most of next year. On the other hand the increasing demand for oil when set against the limited ability of the industry to respond, will likely mean that oil may well move over $100 a barrel.

So now you know why they are drilling in the middle of the play known as the Eagle Ford Shale.

Read more!

Sunday, December 6, 2009

Shale, gas and water

This is a short technical note as part of a series that discusses some of the aspects of fossil fuel production. Earlier posts in the series are listed in the column on the right. By the nature of the length of post that I think will hold people's interest, and what I think folk know and want to know, these posts tend to be very simplistic reviews of topics that are often, in detail, much more complex. I am very grateful to those who, in comments, help to illustrate that complexity.

One of the most promising sources of natural gas that has recently started to come into production is that from the shale deposits around the United States. Since it is possible that similar gas or oil-bearing shales occur around the world this provides a new potential source of energy that has some considerable promise, in the short term, for helping to fuel the world.

Shale, as a descriptive term, does not describe just a single rock, however, and there are a large variety of shale types. Consider, if you will, that much of the shale that contains the hydrocarbon started out as the mud at the bottom of a bay, as the algae bloomed, grew, multiplied and died, to be trapped within the mud and gradually buried with it. As the layer was further buried beneath additional layers of material, so the pressure, and increasing heat, gradually turned the oil in the algae into either oil or natural gas. Along the way the mud itself was compressed, largely dewatered, and baked so that it turned into what we now call shale. When these reservoirs are now tapped, they can produce large initial flows of natural gas, for example, in the Haynesville, the Garfield 25 H-1 just started production at some 20 million cu.ft/day at 7,700 psi delivery pressure.

There are other shale types that are found in producing fossil fuels. In the same way that the mud underlay the water where algae grew, it also pervaded the swamps where, during the Carboniferous era, the trees and vegetation grew that, in time, and to a degree under the same type of burial, pressurization and heating, led to the formation of coal seams. The mud underneath that was the soil in which the trees had been growing was also changed, and so it also formed the shale layer that remained under the coal through the eons. (In the North of England we sometimes referred to it as the “seat earth.”)

But while the term shale is used to describe a generic type of rock not all shales are the same, in the same way as not all soils are the same. By geological description the key part of the description lies in the bedded nature of the rock, and its high clay content. But is it the clay part of the content that I want to focus on in this piece.
Geologists are strict with their rules on sedimentary rocks. Sediment is divided by particle size into gravel, sand, silt and clay. Claystone must have at least twice as much clay as silt and no more than 10 percent sand. It can have more sand, up to 50 percent, but that is called a sandy claystone. (See all this in the Sand/Silt/Clay ternary diagram.) What makes a claystone shale is the presence of fissility—it splits in more or less thin layers whereas claystone is massive.

Shale can be fairly hard if it has a silica cement, making it closer to chert, but usually it is soft and easily weathers back into clay. Shale may be hard to find except in roadcuts, unless a harder stone on top of it protects it from erosion.
The reason for stressing the point is that of weatherability, or how the shale holds up in the presence of water. Let me tell a small anecdotal story.

Back some years ago we used to test rock for different companies, and had been sent some samples of a shale, which we were asked to saturate in water before testing. Due to some confusion we did not get that message initially, and the rock sat – as received – over the weekend. First thing Monday we got a frantic call, don’t put the samples in water. Turned out that two different sets of samples had been sent, and the other sample had been immersed in water over the weekend, and when the lab had looked in the bucket that morning, they had found a residual pile of particles as the shale had totally disintegrated in the presence of water. The shale was so sensitive that we ended up doing all the sample prep (cutting, coring, grinding etc) dry to make sure that we could keep the samples intact.

Testing different shale samples for their susceptibility to water attack, their durability if you will, is not that easy. One of the more common tests is known as slake durability, for which there is a standard test protocol. (Free version here. The sensitivity is also perhaps illustrated by the categories into which the results from another one of these tests (the jar slake test) can fall;

Different responses to shale testing in the jar slake test.

The durability tests generally involve the tumbling of ten intact sample pieces of shale in water for ten minutes, oven drying it, and repeating the tumbling and drying. The amount of material retained on a screen afterwards as a percentage defines the durability. But bear in mind that the shale may still have fragmented or softened.

I am putting a little bit of emphasis on how sensitive the shales are, in general, to water, because, when the oil and gas shale reservoirs are developed, the drilling is usually performed with a water-based mud, and the resulting fractures that are driven into the shale to provide pathways for the gas to leave, are created using a water-based frac’ing fluid.

Now there are ways of stopping, at least temporarily, the wetting action of the water on the shale. One way of doing this is by adding more polymers to the water. Particularly at higher concentrations these (which also make the water "slick") can reduce wettability and stop the softening of the shale, but some of that work is still part science and part art. And part of the question is how the shale will behave in the longer term after it has been wetted.

Remember that to get the gas out the fractures through the rock have to be held open, and the way that this is done is to push small particles (called proppant, but similar to sand in nature) into the fracture to hold it open and still give a passage way through the fracture for the gas to get out.

But if the wetted shale along the edges of the fractures does soften with time, then under the pressures of the well, it may deform around the sand particles that are holding the fractures open, and slowly close the fracture, reducing production rate over that anticipated from a fully open fracture, and reducing the potential overall recovery of gas from the well. In that case, in order to sustain production from the well, it will need to be refrac’ed, perhaps more than once.

Read more!

Sunday, November 15, 2009

Making holes and cracks around oil and gas wells

This is a continuation of the technical topics that I write about on Sundays. For the past few weeks I have been writing about some of the techniques used in producing the gas from shales, and that will likely continue for another week or two. Because of the need to condense the topic into a relatively short post I would ask those familiar with the topics to understand that I have had to shorten the description and gloss over some details in order to keep the main theme clear. But further comments to help readers understand the techniques better (or questions when it isn't) are appreciated.

There is a simple test that I use in one of my introductory classes, where I give the students a rectangle of paper and ask them to pull it apart, then I give them a rectangle with a cut half way through it perpendicular to the length, and half-way down, and ask them to pull that apart. It tears apart much more easily, and it is how I start a lecture on the role of cracks in causing materials to fail. You apply that principle about every time you pull open a package with a serrated top. The deeper cuts focus the force you are pulling with over a small area, making it easier to part the package and extract the candy, nuts or whatever without having to pull so hard that, when the package tears, you throw the contents around the neighborhood.

Today I want to talk a little more about perforating the wall of a well, and a bit more about hydrofracing. They are not necessarily used together, but both are ways of getting cracks out from the immediate wall of the wellbore so that the valuable fluid on the other side can have an easier path into the well.

To begin with the topic of perforating a well, I have written about this earlier, but more from the point of the tools used to do the job. What I’d like to do here is to talk a little more about it from the rock point of view. As I mentioned last time the rock right around the well can be subject to a high enough pressure that it will partially fail, or crush, and this can lower the amount of fluid that can get through, or alternately it might have been damaged in some other way. By bringing in a tool with a set of shaped charges in it, and then firing these at the appropriate place this problem can be overcome.

Arrangement of shaped charges (the yellow cylinders) – when the explosive goes off the cones collapse and small liquid metal jets shoot out of the open end, through the casing, concrete and into the rock, creating a channel. (Core Labs)

The charges aren’t all necessarily fired at one time or place, even though, for the illustration below, they appear to be.

Representation of shaped charges firing and penetrating the casing, cement and wall (OSHA

The jet of metal that shoots out of the cone will travel into the rock roughly 10 cone diameters, as a rough rule of thumb, and this carries a channel, or tunnel, out through the damaged rock into the surrounding reservoir. The collapse and creation of the channel happens very fast:

Penetration of a perforating charge into Plexiglas after 3, 12, 21 and 30 microseconds. Marks are in cone diameters. (after Konya*)

The channel is initially hollow, and drives a set of small and large cracks out into the rock around the line of the charge.

Jet penetration through Plexiglas (note the lateral cracks away from the line of penetration. The dark section is due to a change in background. (after Konya*)

However, while it is easier to show the damage that the jet does by showing how it penetrates Plexiglas, this is not rock, but it does show some of the events that occur. When, for example, (vide the discussion on jointed shale last week) the jet shoots into rock where there are clear joint planes defined, then these act to stop the crack growth (perhaps in the way that those who used to remember stopping cracks growing in old cars by drilling a hole at the end of the crack. It distributes the stress that was causing the crack to grow when focused on the tip, over a larger area so that it drops below the critical level). Or the stress is high enough to cause cracks to form and be reflected back at the jet.

Jet damage confined between two adjacent planes when the charge is fired into plates that run parallel to the direction of the jet. (after Konya*)

If the charge is not carefully designed and used, therefore, it might not be as effective as initially hoped, and this becomes even more true if the pieces of metal that are formed when the cone collapses are carried into the channel and partially block it. There are different strategies, depending on the well and the surrounding rock and it is one of those things in life where, if you got it right the results are almost immediately obvious – as is the converse.

Creating cracks that go out into the surrounding rock has become a vital part of the economic production of gas from the shales around the country, as we have discussed, and having a starting crack in the right direction, whether it is a natural joint in the rock, or a crack that has been deliberately created helps control where the crack starts and how it grows.

Crack growing out from a drilled hole in Plexiglas, the small notch at the top of the hole controlled the direction of the growth of the crack (We put ink in the hole to show how the fluid goes into the crack).

In the above picture you can see that when the hole was pressurized, a crack grew, and ink flowed into the crack, as it formed, but, when the pressure came off, the crack closed and most of the ink was forced back out of the crack. (We created the pressure by firing an air rifle pellet into the hole).

So if we are going to have a useful crack we need to have it open after we take the pressure back off – after all we need to get the fluid back out of the well, so that the gas can pass up the well for collection.

Now it is not quite as easy to grow the crack, or prop it open as I may have suggested earlier, and to explain some of the issues in a little more detail I am going to use an example and some details from the Modern Shale Gas Primer .

When you decide to frac the well, and each well is different, as is just about every location, so there is a significant amount of preparation and knowledge required to work out the procedure required at that particular point. Bear in mind that the crack that you are going to have to grow needs to stay in the shale layer, and not go out beyond it into the surrounding rock. One of the reasons for this is, apart from giving the gas a path to the well, if it goes outside the reservoir rock then the gas can escape, or, alternately, other fluids can gain access to the well. This is particularly true of the Barnett where the rock immediately below it, the Ellenberger limestones, can hold a lot of water that can muck up the gas recovery if it gets into the fractures. (Given this degree of control and the large distance below the ground to the reservoir rock, this is why a lot of the fears that the frac job will damage the ground water tend to be dramatically overstated).

In the example cited, which is from the Marcellus shale, the treatment of the frac takes a total of 18 steps, and because some of these are fairly similar I am going to go through them in groups. First the hole is treated with an acid, to clean away any remaining debris and mud from the drilling operation and to clean any fractures around the hole, so that they can be used to help the frac grow. After the acid the hole is filled with an initial polymeric fluid, largely water, but containing the “Banana Water” that I referred to in an earlier post. This is a friction reducing agent and will help carry the particles used to hold the crack open into the crack in the first place. The problem with that polymer is that some of the choices available, while good at reducing the friction to help move the particles, aren’t that good at holding the particles in suspension, and the last thing we need is for them to settle out in the bottom of the well, and so in the subsequent steps in the process as the particles (or proppants) are added, there is usually a second polymer in the mix to hold them in suspension.

Once the hole is full of the slickwater (the official term for the first polymer solution) the initial frac is made with a fine sand suspended in the fluid. To keep the crack open all along its length we need sand along the path and the crack gets narrower as it grows deeper. So for the first several stages of the crack growth the fluid is filled with successively greater concentrations of the fine sand, so that, in this way, it can penetrate to the deepest part of the fracture.

In the example cited there are some seven of these sub-stages with the fluid being pumped into the well at some 3,000 gpm but varying the fluid:proppant density to carry more and more of the particles into the fracture. Once these stages have been completed, then the job is finished by pumping an additional eight sub-stages of fluid, with this second set containing a larger size of proppant particles. In this way the area closest to the mouth of the fracture will be held wider apart to make it easier for the gas to escape. As with the first set of sub-stages, the concentration of proppant in the fluid increases as the stages progress. In total, in the example given, some 450,000 lb of proppant was used to make the fracture, together with some 578,000 gallons of water.

Once the fracture is created, then the well is flushed to clean out the different fluids, and make it easier for the gas to get out out of the rock and into the well. (It also removes any loose and ineffective proppant so that it doesn’t later become a nuisance). If you think that this would need a lot of equipment you are right!

Equipment used for hydraulic fracturing a well (Primer)

Since there is some discussion of the effects of the different constituents of the fracing fluid on local waters I thought I would end with the listing of common chemicals used in that liquid, which is provided in the Primer .

As usual this has had to be a very brief review of the technology and may have oversimplified to the point of not being clear, so all technical comments and questions are appreciated.


* The initial photos in this post were taken as part of the dissertation of Dr Konya, "The use of Shaped Explosive Charges to Investigate Permeability, Penetration and Fracture Formation in Coal, Dolomite and Plexiglas" Missouri S&T, 1972.

Read more!

Thursday, November 5, 2009

Availability and Profitability of Natural Gas and LNG

It is a little difficult to predict, just at the moment, which way the natural gas situation is going to swing over the next year. The number of different events that are contributing to the overall supply of natural gas seem, on the surface, to indicate that there will be more natural gas than is needed. But there is some question as to how much will actually appear, as the year develops.

For those who want everyone to believe that there is no longer a shortage of natural gas there are the additional LNG supplies that are now coming on stream. Just this week Yemen begins shipping its first cargo to Korea, with a second cargo from Belhaf soon to follow. The gas comes from a reservoir in the center of the country and had to travel some 320 km to the processing plant and terminal. The first train is committed to the Korean market. A second train is expected to be brought on line in a few months, to raise total production to some 6.7 million tons per year. While the market for this second stream was originally expected to be in the US, at present they are keeping it closer to home by intending to sell to India.

The USA had been seen as a sure market for LNG at the time that Belhaf was planned but that was before shale gas began to hit the scene. Now, the declining price in the American market, and the prevailing large quantities in storage, make that less desirable.

Moving around the coast to Qatar, business is good with three LNG vessels shuttling to the UK this month. With three LNG terminals – at Dragon, South Hook and Isle of Grain, the UK can now import up to 25% of its needs as LNG. That is helping to keep the price of natural gas lower in Western Europe and has a natural knock on to prices that those countries want to pay to such companies as Gazprom.


Qatar is simultaneously setting up to be a major supplier to China. The Chinese see that market being in the range of 40 to 60 million tons by 2020. They have just started taking delivery of an initial 2 million tons per year from Qatar.

Back in early 2006 when the expansion of LNG trains was planned for Qatar it was expected that the US would be buying up to 30% of its needs from Qatar and Qatargas Trains 3 and 4 each with a capacity of 7.8 million tons, were started on that assumption. Now, of course, with the increased domestic production from the shales there is no longer such a need and the question becomes one of working out where the new surplus of natural gas will go.

Part of this may go to Europe to replace the Turkmen gas that may not make its way West this year, since Turkmenistan and Russia (not to mention Russia and Ukraine) still seem to be at odds over the price and profit that they each might make from supplying gas West. Turkmenistan can now hold on, given that it is selling its natural gas to China, in almost the same quantities, but for a much better price. Russia is, however, starting to get natural gas from the new Achimov deposit. The declining market, due to the recession, has seen Gazprom sales fall, but they are now claiming some turn around in that situation. incidentally, those who wish to get some idea of why it might be hard to gain a good idea on Turkmen reserves and production should read Shaun Walkers story in The Independent.

Not that China is content to just rely on the new feed from Turkmenistan. It is also starting to import LNG from Malaysia through a new terminal at Shanghai, and will purchase the LNG from Qatar train 2. A third Chinese LNG terminal also began operation earlier this year.

Now that is all the good news about supply. The questions that remain relate to the production that can be anticipated from the gas shales in the United States. The problems of maintaining production from gas fields that can drop production by over 20% in a month, or 80% in a year are not yet recognized. One significant one, that Arthur Berman raised as a concern, is the ability of wells to attract enough investors to pay for sinking them. If the recovery rate from the wells requires a high price and sustained volume to attract those investors, then the availability of cheaper LNG from the Middle East may keep the price from reaching the levels that are needed. Another LNG terminal has just been approved for Port Dolphin in Florida, while there is growing support for a facility at Coos Bay in Oregon. But that is, in the short term, seeming to bring in natural gas into a country that already has enough. The EIA notes that the current price of natural gas (Henry Hub) is around $4.289/kcf - the threat of imports from abroad will likely keep it down at around that level this winter. The question then comes as to whether, at that price there is enough profit in the gas wells to continue drilling in the gas shales.

I suspect that the hype, for a short time, will keep that program running, but if you’re losing money on production you can’t make it up on volume. The rig count is slowly rising, but whether the resulting production will make money, and how long will the wells last are topics for another day. Though cold weather, short term, might help in reducing what continue to be record stocks of natural gas.

Read more!

Sunday, November 1, 2009

Shales and the gas within them

This is Sunday, so this is a technical talk about getting fossil fuel out of the ground. While some previous posts have dealt with sandstone and carbonate deposits I’m going to be talking about getting gas out of shale for a couple of weeks, and so, before I started talking about Horizontal Wells, we’d better chat for a minute or so about shale. And when I don’t give an alternate reference for the information, I am likely quoting from the Primer on Natural Gas in Shale, from the Department of Energy.

Folk who live near rivers, or along their outlet to the sea are familiar with the large mud flats that can develop around the outlet. These flats, which extend out into the sea, can cover large areas. When I was in school at Lancaster in the UK, we went to Morecambe Bay when my parents came to visit, and the large areas exposed when the tide ebbed remain a lasting memory. Through geological time these beds of mud have lain under large stretches of water, and so, at the algae that float in the water died, so they fell, and were caught in the mud. The mud is largely made up of clays, which in very small sizes are shaped a bit like a plate, and so as they settle, capturing and covering the algae remains, they tend to create layers (which can later tell us some of the conditions at the time they were deposited). When conditions are right – generally with a relatively warm sea containing a lot of nutrients – the sea can host vast colonies of algae, and over geological time the death of these algae built up considerable organic matter in the mud on the sea bed.

The main gas shale deposits in North America are in the Barnett shale, the Fayetteville, the Woodford, the Haynesville, and the Marcellus while, in Canada, the large fields are in the Horn River and Montney deposits. Not that there are not others, but these are the ones that the Oil and Gas Journal calls “The Magnificent Seven.” As an example the Barnett shale was deposited during the Mississippian Epoch, itself part of the Carboniferous Era, between 315 and 350 million years ago. At that time the map of the Earth looked at bit like this ) .

Shape of the Land and Seas at the time of the Mississippean Epoch

However not all the shales were deposited at that time. The Haynesville, for example is much younger, having been laid down in Jurassic Era, (remember the dinosaurs of Jurassic Park?) which was some140 to 200 million years or so ago, and when the globe looked a bit more familiar.

The map of the earth some 195 million years ago during the Jurassic

The mud that was deposited grew to be very thick – even after it was compressed by the weight of overlying additional sediments that turned into rock, the Barnett shale still can measure between 50 and 600 ft thick.

The individual particles that made up the mud were quite small, so that, as the material was compressed, the resulting rock became relatively impervious. Thus if the gas-generating algal remains were trapped, they were held in the shale, but dispersed throughout it, rather than concentrated in larger pore spaces, such as are found in sandstones. And, to be economic, there still needs to be a significant amount trapped within the pore space, which needs to be at least in the 5 – 12% range to hold enough gas to be worthwhile. Putting this into a different context, the Barnett, for example, is estimated to hold about 325 scf (cubic feet at a standard defined temperature and atmospheric pressure) of natural gas per ton of rock – or in about 13 cubic feet of rock. (Needless to say deep in the ground the gas is very compressed).

As the rock was buried deeper, so the temperature and the pressure also rose, gradually “cooking” the organic material over time. Depending on how deep the rock was buried, and the temperature, the material either turned into an oil, or if it were buried deeper and at a hotter temperature, it would turn into a gas. The relative conditions that set these bounds are sometimes referred to as the oil and gas windows for rock, and can be illustrated with a graph.

Geothermal gradients defining the oil and gas windows as a function of depth and temperature. (From WVU)

The current reservoir depths at which the different shales are now found can differ quite significantly from those at which the gas or oil was first formed, with depths for the Fayetteville being as little as 3,000 ft (0.9 km) to the Haynesville which can be at more than 14,000 ft. (4.3 km). The Barnett is around 6 - 8,000 ft (2.4 km).

Permeability, or the ease with which gas, oil or water can flow through a rock is measured in a unit called a Darcy, but it is sufficiently large that most rock permeabilities are measured in thousandths of a Darcy, or millidarcies (Md). As a point of reference for a rock with a good permeability such as the Ghawar oilfield in Saudi Arabia, Greg Croft quotes values in the 600 Md range.

A microdarcy is one thousandth of the value of a millidarcy, and it is this unit that the permeability of gas shales are often measured. Thus the permeability of the Marcellus shale can be around 20 microdarcy and the Barnett around 10 microdarcy. The density of the rock can be seen from the sample pieces shown at the Chesapeake Web site.

Illustration of gas shales from the Chesapeake web site.

These fine-grained rocks with low permeabilities mean that the producer has to rely on other paths within the rock to allow the gas to escape. Originally this was just the natural fractures that can be found in the rock. As the rock compresses vertical fractures often generate within the rock. These fractures can be quite consistent, though in contrast to the bedding, they normally occur vertically.

Shale fractures from Geology.com

The problem is that conventional vertical wells don’t intersect a lot of these fractures, and thus, when the gas shales were first drilled the production was very low, and often uneconomic.

However when horizontal wells were developed it became easier to intersect a lot of these fractures as the well moved along the reservoir, and so it is time to introduce horizontal wells in the next post.

As usual this has been a very short description of a relatively complex topic, and so questions, and comments are appreciated.

Read more!

Thursday, June 4, 2009

House Hearing on Hydrofracturing

This morning the House Committee on Natural Resources Subcommittee on Energy and Mineral Resources held a Hearing, motivated by (among others) Congresswoman Diana DeGette of Denver, to remove the Safe Drinking Water Act exemption from the hydraulic fluids used in hydraulically fracturing (hydrofracing) oil and gas wells. The exemption was granted in 2005. It is particularly relevant to today and tomorrow’s supplies of energy since it is only through the extensive use of hydrofracing that it is possible to viably recover the large quantities of natural gas that are now being developed from the gas shale deposits around the country.

I was led to listen in by Joe Romm at Climate Progress who seems to have just discovered both Peak Oil and the Gas Shales, and I am glad that I did. The issue seems to have become of increasing public interest since the discovery that one of the larger gas shale deposits in the country is the Marcellus, which can be found under parts of New York and Pennsylvania, and with the large volumes of fluid that are used in the hydrofracing process (of which more in a bit) there is a growing concern (and some rumors generated) that the fluids from that process will get into the local drinking water and surface waters; that the fluids contain toxic materials, and thus the public is being put, unnecessarily, at risk.


The witnesses before the Sub-Committee were:

Mr. Douglas Duncan who is 
Associate Coordinator for the Energy Resources Program of the United States Geological Survey.

Mr. Scott Kell
, President
 of the Ground Water Protection Council and a State Regulatory , Official from Ohio.

Mr. Mike John who is the 
Vice President of Corporate Development and Government Relations, for the Eastern Division
 of Chesapeake Energy Corporation.

Mr. Lynn Helms who is the 
Director of the Oil and Gas Division of the 
North Dakota Industrial Commission, and who spoke of the activity of the Interstate Oil and Gas Compact Commission.

Mr. Albert F. Appleton who is a consultant on 
Infrastructure and the Environment and a 
former Director of the New York City Water and Sewer System.

Of these, Mr. Duncan spoke of the size of the gas shale resource, on land in the United States (and did mention that the USGS was working out how much there was in the rest of the world) but otherwise seemed to try and stay outside of the debate. Interestingly, later in the debate, ho noted that the USGS had data for the public lands in the United States, but had not finished the survey as to what lay beneath private lands.

In his opening statement Scott Kell spoke to the work that the States already do in this regard. He specifically cited two reports, though I only got the reference to the first. That was “Modern Shale Gas Development in the United States – A Primer”, (pdf) and it appears to be an excellent reference to the topic, and I am going to use it to substantiate some of the comments from the panel of witnesses.

He noted that the rumors of ill health caused by hydrofrac fluids suggested up to 1,000 cases of environmental damage focused on six states. He contacted the relevant agencies in those states and found that the reports were unfounded. The Ground Water Protection Council was founded by State Oil and Gas Regulators and is designed to protect the public’s water.

Mike John, speaking on behalf of Cheasapeake, noted that the Marcellus is likely to be a real game changer in regard to US reserves. It will provide an “ocean of natural gas,” with production being limited by demand, since there is now too much supply. They have 94 rigs operating and he described defining the shale in their lease, identifying the sweet spots with 3-D seismic and then drilling, from a single 5-acre site, perhaps 6 t0 10 wells that go down 8 – 10,000 ft (depending on the deposit) and then turn lateral and go out a mile horizontally. He believes that the four major gas shales (Haynesville, Fayetteville, Marcellus and Woodford) will generate half the US demand for natural gas by 2020, at 30 bcf/day.

Lynn Helms spoke of the benefits to come from the Bakken in North Dakota, as a State Official he has no greater priority than protecting the water, but has seen no credible real threat to the water and believes that the industry is adequately regulated.

Thus the first four speakers (or at least the middle three) were of the “it ain’t broke so why fix it,” school, and it was left to the last member of the panel, Albert Appleton, to explain the concerns that had led to the Hearing and possible change in legislation). He has been, as one concerned with the NY water supply, a critical evaluator of what goes on in the watershed that feeds water to the city and the state. He spoke to the fact that we are supposed to be moving away from fossil fuels toward renewable ones, that there are concerns with the fluids that are used in hydrofracing, and the industry that says it can’t afford more regulation is the one that makes these huge profits. His main concern was that the fluids used are toxic and do not biodegrade, so that even though they are stored in deep wells, they are still there as a threat. But there are also concerns that there are not enough regulators to ensure compliance with the regulations, and that water withdrawal may have severe and negative impact on communities. And he returned to the point that the Government is now pouring billions into green energy but this will compete with natural gas, so that if we subsidize the gas by easing the regulations we are undercutting the green energy program. And we have to be concerned about global warming. (Joe Romm is quoting NASA as saying that we will set a new global temperature record within a year or two).

Well after these opening statements, the Sub-Committee members had their say, some speaking more themselves, and one or two merely asking questions. The ad hominem argument that appears in other discussions also popped up here. Congressman Hinchey (I believe) from New York asked Mr Kell where he got his funding and focused in on the oil and gas companies that therefore “bought” the conclusions he had provided. (This was rebutted by the witness). He was particularly concerned with the benzine in the fluid, and returned to its toxic nature and longevity once spilled.

Congressman Boren from McAlester, OK talked about the rigs that are laid down, and the high unemployment in the oil and gas business in his district, for him $4 gas was too cheap. He did note that then Senator Obama voted to provide the exemption, and he wondered why they were trying to “solve a problem that doesn’t exist.” He got the witnesses to differentiate between the depth of the wells (8-10,000 ft) where the fluid is used, and the 2-300 ft of the water supplies of concern. They also pointed out that without the hydrofrac, gas from the shales can’t happen. He noted that the prevailing backup to the wind and solar farms being installed today is natural gas, and so we really need it.

Congresswoman Lummis from Wyoming talked of the “game change” nature of the natural gas, and asked of the consequences of the proposed change. The example given in response was the effect of the LEAF (Legal Environmental Assistance Foundation) legislature in Alabama which was directed at control of coal bed methane and hydrofracing (historic review.) The result of the judgement was to place a two-year drilling moratorium in the state. She urged the Sub-Committee not to remove the exemption.

The State regulators pointed out that the States had been handling this problem for years, without documented cases where there were problems in over 20 years of operation.

Congressman Gohmert of Texas pointed out that they are drilling into the Barnett shale in downtown Ft Worth without problems. Congressman Fleming of Louisiana commented on the developments in the Haynesville shale and how they were a great boost for the local economy, without incidents.

Yet in a reply Mr Appleton returned to the point that non-Federal regulation of the industry was a subsidy to the National Gas Industry.

Congressman Sarbanes of Maryland went back to the toxic chemical point, seeking to determine if any of the fluids were Class 1 chemicals (they are Class 2) He was answered that all sites (to comply with OSHA) must have the pertinent MSDS data sheets for all the chemicals at the site and available – so the fluid chemistry is determinable. However, it was pointed out that the chemistry changes from well to well and site to site, and thus it is impossible to generate a single “one mix fits all.” The fluids from the well are stored on site, in either tanks or double clay-lined pits, from which the fluid (monitored by the agencies on a per barrel basis) is transported to injection wells and pumped deep underground. There are some issues with water quantity however, (though this was not followed up on very much).

In terms of price, Mr John said that Chesapeake could live with $4 gas (per thousand cu ft) but that he expected the price to return to $6 to $8 fairly soon. They have not shut in any of their wells in the Marcellus. In response to the question as to what a typical fracing fluid contains as a chemical package he began to read the table (exhibit 36) below.

Typical fracing fluid contents

Congresswoman DeGette then came into the Hearing and asked questions as to the objection to the legislation. If the chemicals are reported anyway, why is there a problem. Some foks say there are no incidents, but incidents don’t always get reported. And there are stories of contamination, and injuries.

There had been one break in the Hearing and I was distracted a couple of times so that this is not a full and complete report, just what I was able to note.

My sense was that most of the Sub-committee did not see the reason for change, with only two or three members pushing the need for a change in regulation, but I suspect that not all the members were there and that this may have more passion on the part of those seeking the change.

Read more!